
Chapter 14. Data Analytics
Analytics is an often-overlooked aspect of developing applications or services in general. Yet, when you are offering a service or providing a platform for people to interact with, it is extremely important that you know exactly what is happening on it. Who is performing which actions, what calls are being made, which calls are most expensive, which are consuming most of your resources—these are all questions that a solid analytics system will be able to answer, by making data, logs, and events meaningful.
In this chapter we are going to learn how to recognize important events and actions on our platform, identify key metrics, and keep track of them. We will also meet some tools that can be effectively used to easily build your own analytics platform.
Data Comes from Everywhere
Users and applications are constantly generating an enormous amount of data. Once your applications or APIs start living on the Web, or are being consumed by a number of other services or users, you will have to start struggling through logs and user-generated events. The problem with these streams of data is that they are actually extremely valuable at a macro level, but probably difficult to interpret individually.
Think for example of a simple log entry for a timeout. If you spotted it, you could interpret it as a simple warning of a certain error that happens every now and again in your application.
Now imagine that you could easily correlate that timeout message with certain events happening in one or some of your services. You would be able to identify patterns, and perhaps find out that a certain user is accessing expensive methods or performing resource-consuming actions.
Building a strong analytics service will help you:
- Scale your systems and infrastructure where and when this is needed the most.
- Improve overall service availability and maintainability for your infrastructure, applications, and networks.
- Diagnose all your environments from one application.
Being able to rapidly search, filter, and visualize actions and events can significantly reduce the time required for root cause analysis, by providing insights into how your web application is being used and how it performs, so that you can focus your optimization efforts where they are needed.
Tools combining analytics, log management, and event tracking will parse all requests in the application’s logs, create events on specific actions, create time series of various important metrics, and also send all the information gathered to a database so you can build up and keep historical data.
There are different services and tools available if you wish to develop an analytics platform. Some of these are open source, and you just need to install them. Others are provided as SaaS solutions that you can easily integrate into your application with an API.
What solution you should adopt depends, as usual, on a number of factors. Your decision would specifically result from how you answer the following questions:
- Can you maintain your analytics platform or would you like to focus only on developing your product?
- Can you maintain the analytics infrastructure (application server), or would you prefer not to worry about this aspect?
- Can you dedicate some time or resources to defining the events you would like to track, or would you prefer to work with a predefined set of events?
- Do you want to keep your event data, or do you not mind hosting it elsewhere?
Once you have decided to either build your own solution or use a framework or third-party service that handles some of the work for you, you can start planning your analytics and reporting architecture.
Monolithic Versus Microapplication Architectures
In a monolithic application all your data will be stored in one database, so to have meaningful insights into that data you will just have to query that database and retrieve the information you need. It is common practice, though, not to run the reporting application out of the same database as the main application. Instead, you duplicate the application database completely, to keep the reporting and the production environment separate (see Figure 14-1).
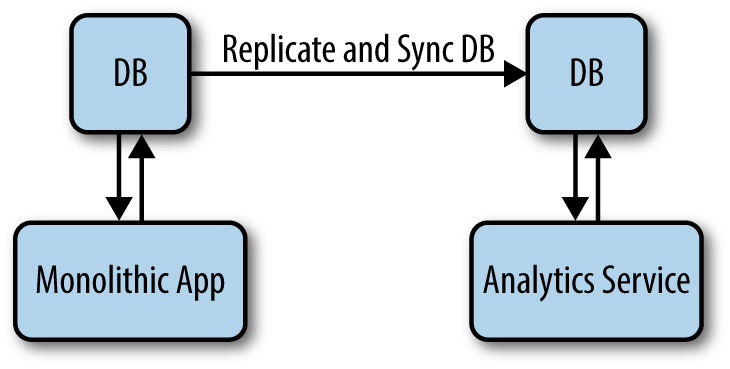
Figure 14-1. A monolithic application where the app DB is replicated in the reporting DB
There are a number of problems that such an architectural choice could bring. Firstly, your reporting application will run on “old” data. Typically the reporting database is updated at certain intervals, so you are never working on real-time data. Secondly, every time the databases need to be completely replicated or even updated, some stress will be generated on both systems. Thirdly, the reporting application might need data to be structured differently than your production environment, so you might end up having to duplicate some of the data, or store all the data plus some other information. You might then start to lose control of the extra data on the reporting database. Imagine when you need to track different events; you might end up without historical data about those events being directly available. In such a situation you might have to run expensive queries on your production database to find the data you actually need and have it available to your reporting service.
There is also a fourth issue that you might easily encounter when creating an external reporting system. If you would like your users to have access to some reporting data, they will have to go through the system. Therefore, you will either have to call it from your main application or have them access your reporting service through a different application. You can already see how this architecture in many ways encourages replication and complexity.
In a microapplication architecture, data is instead stored in a number of different databases and is shared through RESTful APIs. In this environment it makes sense that when an interesting event is triggered, the services or applications concerned make requests to the analytics service themselves.
Therefore, it is not up to the analytics and reporting service to run the queries on each database to pull the data. Each service or application instead “pushes” the data to the analytics service, through REST API calls, whenever an interesting event is triggered.
Interesting events are configured at the single application and service level, but all the statistics and reporting logic remains with the analytics service.
A microapplication approach will also allow you to easily integrate reporting tools and third-party services into your infrastructure through the analytics microservice. The analytics service is itself another application sharing and offering data in the architecture (see Figure 14-2). Therefore, if your users will need to access reporting information or logs, you will just have to map the appropriate API calls. Also, if you are missing historical data, you will not have to stress your entire system: only the application containing the data you need will have to sync with the analytics service.

Figure 14-2. A microapplication architecture, where analytics is just another service in the platform
With this approach you can also decide if you would like some events to be sent to your reporting app as they happen. Here is what happens in this case:
- An event is triggered in an application or service.
- Data is sent with a REST call.
- The analytics service processes the event.
Alternatively, the events may be scheduled to be sent at a later time. In this case it is often said that data is pumped to the reporting service at regular intervals. The workflow is then:
- An event is triggered.
- The event is scheduled to be sent in the next pump.
- The pump is sent to the analytics service.
- The analytics service processes the batch of events that it has just received.
In the next sections we are going to see what tools we have available at the moment and how we can configure events in our application.
Monitor, Optimize, and Enhance
Monitoring a system in production can become a complex task when the system is composed of a multitude of small services and applications.
With monolithic applications the ultimate source of errors is always the application itself, but in a microapplication environment any system component could be a source of potential problems; therefore, each microservice and microapplication needs to be monitored.
In addition, in a microservices application several third-party services are probably integrated within the application to solve additional issues. These calls need to be monitored as well.
One of the first objections against a microservices-oriented architecture is that you have to analyze multiple log sources in order to debug an issue. While it is true that microapplications and microservices certainly introduce more complexity when it comes to monitoring, it is also true that since the system is clearly split into logical units performing simple actions, it is possible to clearly understand which actions we need to monitor.
So, while microapplication systems can generate an enormous amount of log data that could easily become unmanageable, with the right tools in place we can easily isolate issues to the microservice or microapp level, without having to debug an entire monolithic application code base.
If we analyzed the architecture of a hypothetical monolithic app, we would find the same components as in a microservices architecture. These components wouldn’t be services on their own, but instead would be libraries or classes in the app. Also, some functions in the app could be scattered across several classes, and each of these classes could integrate different libraries. In such a situation, finding the culprit behind a slow call would probably be quite difficult. Of course, each approach has its pros and cons, but it is clear that using efficient statistics and correctly configuring reporting systems will make a microservices architecture easier to debug, by cutting maintenance complexity and isolating issues to a single service.
To understand how a microservices architecture should be monitored, we should think in terms of the single logical units first. Each microservice would ideally correspond to a logical unit, performing a single action.
Let’s go back to the Citywalks API. This application integrates two other APIs, the WikiCat API and the Wikipin API (Figure 14-3). In such a scenario, to begin with, we would probably want to monitor that our calls to all the APIs we are integrating are not timing out.
There are a number of indicators of how your Rails application is performing that you should monitor. We will take a look at these in order. In general, there are two simple rules when it comes to monitoring: if you can measure it you can improve it, and if you want to improve it you need to measure it first.
Application Logs
You can start analyzing a Rails application via its log files. Logs are stored by the Rails server in the /log directory, where each runtime environment has its separate log file.
Logs monitor application errors and general runtime messages and warnings, depending on your configuration.
Rails uses the standard Ruby logger to log information, but you can substitute another logger if you wish (such as Log4r) by specifying the alternative logger in your environment.rb or any environment file:
Rails.logger=Logger.new(STDOUT)Rails.logger=Log4r::Logger.new("Application Log")
Note
Log4r is a logging library for Ruby applications.
When a certain action or error is logged, it gets printed to the corresponding log file (so long as the log level of the message is equal to or higher than the configured log level of the app). By default, each log is created under Rails.root/log/ and the log file name is <environment_name>.log.
The standard Rails logger offers five log levels: :debug, :info, :warn, :error, and :fatal, corresponding to the log level numbers from 0 to 4, respectively. To change the default log level, use:
config.log_level=:debug# In any environment initializer, orRails.logger.level=0# at any time in your code
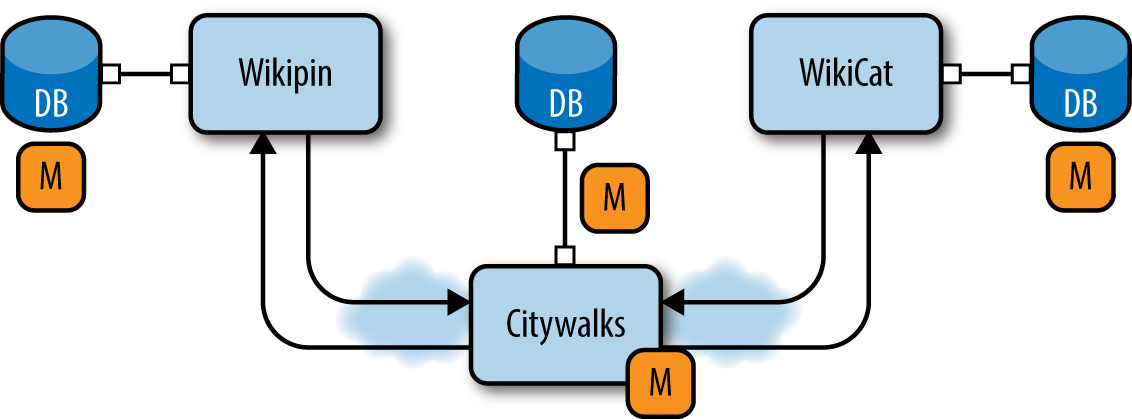
Figure 14-3. Monitoring the Citywalks API
The default Rails log level is info in production mode and debug in development and test modes.
To write in the current log, use the appropriate logger.(debug|info|warn|error|fatal) method from within a controller, model, or mailer:
logger.debug"Resource attributes hash:#{@resource.attributes.inspect}"logger.info"Processing the request..."logger.fatal"Terminating application, raised unrecoverable error!!!"
Adding extra logging messages makes it easy to monitor unexpected or unusual behavior in your application. If you decide to produce extra logging messages, though, be sure to adjust the logging levels accordingly to avoid filling your production logs with noise.
Monitor Request Response Times
By monitoring requests, you can find out which methods are slowing down your application and therefore taking more time to load, among other things. In a microservices architecture composed of multiple services, the question is where you should monitor such metrics.
In microservices architectures it is common, as the number of services grows, to set up a middleware for all your APIs to communicate. A middleware is really like a proxy, where all requests, external and internal, are routed to the appropriate service or application.
We are going to introduce the notion of middleware in the next chapter, where we will also see how to configure an Nginx server for different APIs to communicate. For the moment, we will consider a middleware as a proxy routing all our calls to the various services and applications in our architecture. In a scenario where all calls are routed by a central service (the middleware), a common solution is to monitor call performance on the middleware itself.
There are different solutions to use as middleware, but common choices are Nginx and HAProxy. Both possess a number of features allowing control over various statistics.
The ngx_http_status_module module of Nginx provides access to various status information, including:
- The total number of client connections
- The total number of accepted client connections
- The total number of dropped client connections
- The current number of active client connections
- The current number of idle client connections
- The current time in milliseconds since the epoch
- The total number of client requests
- The current number of client requests
If you are using several virtual servers, you might configure these in zones. A zone is a shared memory area where all information common to all servers in that zone—for example, sticky session information—is contained.
For each zone, it makes sense to check the following metrics:
- The number of client requests that are currently being processed
- The total number of client requests received from clients
- The total number of responses sent to clients
- The number of responses with status codes 1xx, 2xx, 3xx, 4xx, and 5xx
- The total number of bytes received from clients
- The total number of bytes sent to clients
In general, a good way to approach configuring response alerts is to understand what kind of baseline traffic your application experiences and trigger events around possible exceptional activities.
A common pattern is triggering an alert if the traffic data collected over a precise interval is significantly higher than expected, indicating a sudden traffic spike, or if the values are suddenly significantly lower, which might be indicating a problem preventing users from reaching your app.
Once you start having consistent information, you can benchmark your server to identify the traffic levels that start to slow down the server and the levels that make the server completely overloaded and therefore unusable. These values will also serve as a good upper limit that you can use to trigger customized alert and warning messages.
Monitor Processes
As part of your deployment process you should also keep your server processes and tasks running smoothly, without consuming too many resources.
There has been a long-running discussion in the Rails community about how Ruby on Rails does multithreading, how efficient this is (or isn’t), and whether it consumes too many of our server resources.
Consider two Ruby threads: thread A is waiting and does not need to use the CPU, while thread B is waiting but does need to use the CPU. Ruby specifically switches to another thread when it needs to block for I/O. That is, whenever a Ruby thread needs to wait and it is not using the CPU, like with thread A, Ruby allows for another waiting thread to take over the CPU—so in this case, thread B takes over the CPU, while A waits.
This means that in the unlikely situation that one of your web requests uses the CPU for 30% of the time and waits for I/O the rest of the time, you can ideally serve three requests in parallel, almost maximizing usage of your CPU resources. Figure 14-4 illustrates this scenario.
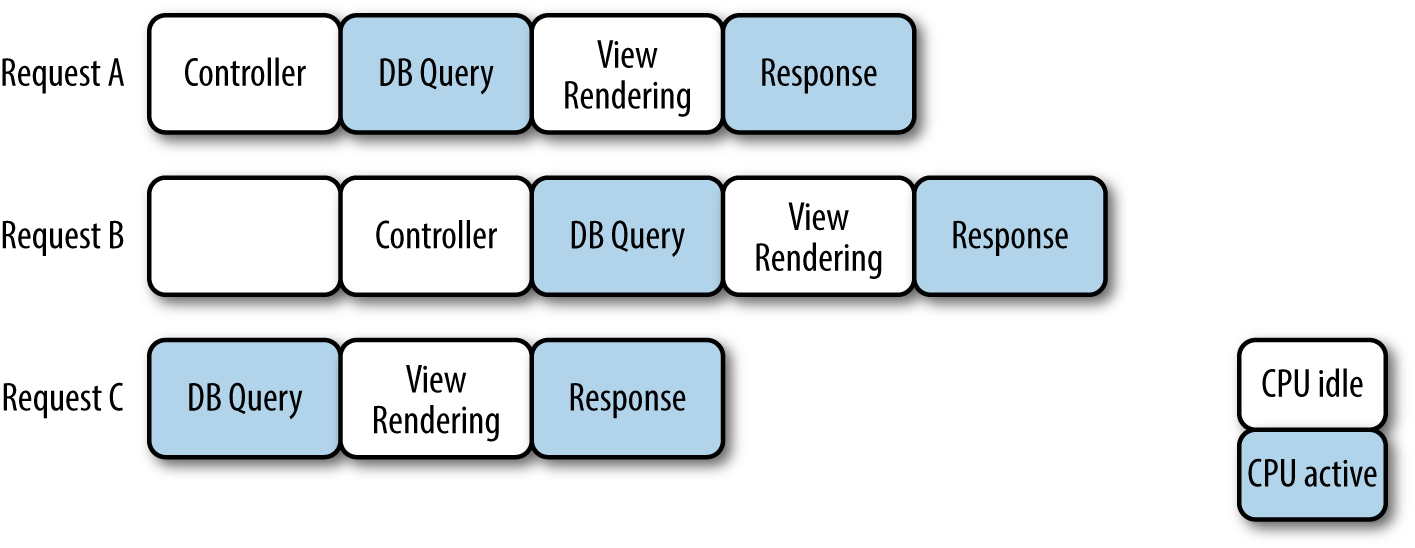
Figure 14-4. Simple multithreading in Ruby
Nevertheless, you might consider using a monitoring framework to monitor your server’s performance.
God is a monitoring framework completely written in Ruby. God performs actions such as keeping processes up or restarting processes when resource utilization exceeds your desired specifications. It is possible to configure many different kinds of conditions to have your processes restarted when memory or CPU usage is too high, when disk usage is above a threshold, when a process returns an HTTP error code on a specific URL, and more.
In addition, you can write your own custom conditions and use them in your configuration files. And because the config file is written in actual Ruby code, you can use Ruby language syntax to define conditions in your configuration, thus eliminating duplication. Many different lifecycle controls are available, alongside a sophisticated and extensible notification system.
To understand how God works, let’s imagine writing a simple process:
loopdoputs'Hello'sleep1end
Let’s save it as server.rb.
Now we can write a God config file to monitor our process. We’ll call it monitor.god:
God.watchdo|w|w.name="god-monitor"w.start="ruby /full/path/to/server.rb"w.keepaliveend
This is the bare minimum God configuration, declaring a God.watch block (a watch represents a process that you want to watch and control). At minimum, for each watch you must provide a unique name and a command that tells God how to start the process. The keepalive declaration tells God to keep the process alive. If it’s not running when God starts, it will be started, and if it dies it will be restarted.
For more configuration possibilities, see the God website.
Threads (in Ruby): Enough Already
Although it’s now a bit old, I recommend this great blog post from Yehuda Katz about threads in Ruby.
Monitor Your Server Diagnostics
Monitoring a server is about making sure that the system is healthy. This applies for your web server, your middleware server, and your database server.
Depending on the configuration and the tasks the server executes, there are a number of metrics that may need to be monitored. Memory usage and access to I/O are only some of these. You might also want to monitor average CPU utilization across all CPUs or cores, as well as on a per-CPU or per-core basis. You can set alerts to let you know when CPU utilization reaches a certain level or when your application is overloading your server memory. You might also want to keep control of how many times the server was unavailable or has restarted in the last time interval.
A list of common metrics to monitor includes:
- Uptime
- Active users
- Server time
- Average CPU usage
- Memory usage
- Resource usage
Let’s look at each of these in turn. The uptime command:
$uptime
gives a one-line display indicating the current time, how long the system has been running, how many users are currently logged on, and the system load averages for the past 1, 5, and 15 minutes.
You can see which users are currently running processes on your system by running the following:
$psaux|awk'{ print $1 }'|sed'1 d'|sort|uniq
This uses the ps command, with a few filters: we get rid of everything except the first column of output (the usernames), remove the header, sort the output, and eliminate duplicate lines, displaying only the users list.
You could also filter out all system users and only show the names of regular users (and/or the root user) with active processes:
$psaux|awk'{ print $1 }'|sed'1 d'|sort|uniq|perl-e'for (<>) { chomp; $u = ( getpwnam($_) )[2];print $_, " " if ( ( $u >= 1000 || $u == 0 ) &&( $_ =~ /[[:alpha:]]/ && $_ ne "nobody" ) ) }'
This would probably output just your system name and the root user.
To see the server’s local time and date, use:
$date
What if you would like to know the number of CPUs available in your system? You can check it on your instance by running the following command:
$grepprocessor/proc/cpuinfo|wc-l
To see how much memory your server is using you can use the free command, which displays RAM details in *nix machines:
$freetotalusedfreesharedbufferscachedMem:75136447115076398568524243813721134788-/+buffers/cache:55989161914728Swap:50331640650040043831240
The first line gives details about memory: total RAM, used RAM, free RAM, shared RAM, RAM used for buffers, and RAM used for caching content. Line 2 indicates the actual total RAM used (including by buffers and the cache) and actual total RAM available, while line 3 indicates the total swap memory available as well as how much is used and how much is free.
Resources usage
Using the top command you can get an overview in real time of which processes are using most of the system resources on your server:
$top
Figure 14-5 shows some sample output.
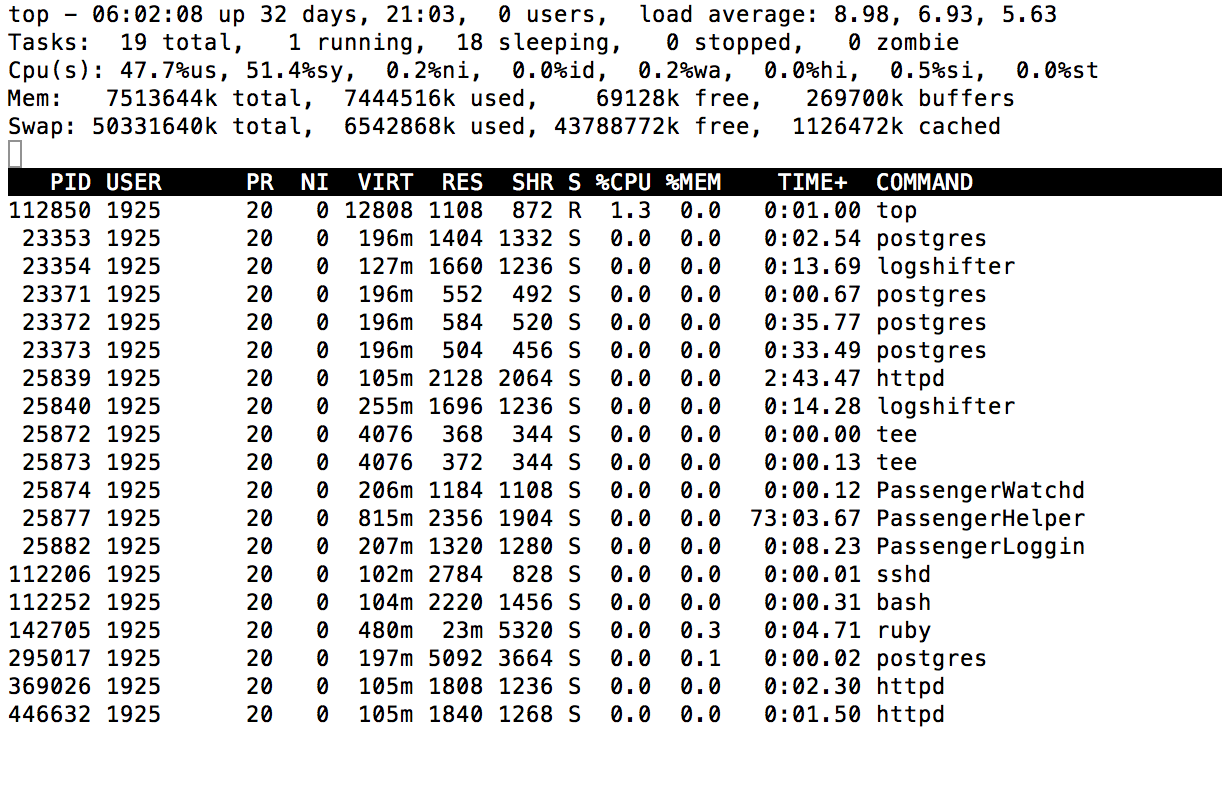
Figure 14-5. System statistics with top
The first line of top output gives the load and uptime values, followed by the number of users and the load average. The next lines summarize the task list (which will depend on what operations your server is performing at the moment), the load on the CPUs, and memory and disk swap statistics.
In top you can also customize the output in order to filter the processes. If you type n and then the number of processes you want to look at—for example, 5—you will see only the top 5 processes.
If you press Shift-M (for “memory”), you can order the processes by memory consumption.
If you want to check the CPU usage—more specifically, what processes are using the CPU and how much—you proceed by choosing which field (column) to study by pressing Shift-O (the letter O, not the number 0). To concentrate on CPU usage, press k—note in Figure 14-6 how the asterisk (*) moves next to the “k: %CPU” row, indicating the CPU field has been selected—and then press Enter.
Return to the processes page, and you will see that the %CPU column is the ordered field. From the interface page (Shift-O) you can choose to monitor different metrics to know exactly what is happening on your server. Also, as top by default automatically updates every 3 seconds, it gives a real-time overview of the status of your server.

Figure 14-6. The top settings interface shows what processes are available for inspection; the columns show a letter, the column code, and a summary of that code
Comprehensive Monitoring Solutions
There are different comprehensive monitoring solutions that you might consider integrating into your Rails application. A monitoring application usually takes the results of whatever checks, scripts, and programs that you might have put in place and run across your systems and, when certain conditions are met, passes the information across, sends alert messages, or just updates some values, depending on your configuration.
The solution that I am going to introduce is Sensu, an open source monitoring framework available at http://sensuapp.org.
Note
Sensu is a monitoring framework that aims to be “simple, malleable, and scalable.” It is released under the MIT license and its core repository is available on GitHub.
Sensu uses checks to monitor services or measure the status of resources. Checks are basically scripts executed on servers running the Sensu client. These scripts output data to STDOUT or STDERR and produce an exit status code to indicate a state (0 for OK, 1 for WARNING, 2 for CRITICAL, 3 or greater for UNKNOWN or CUSTOM).
Sensu uses handlers for taking action on event data. Handlers are scripts that perform actions like sending email or SMS messages, generating alerts, or adding metrics to external stores like Graphite.
Sensu is written in Ruby using EventMachine, an event-processing library for Ruby, and can be easily configured in JSON. It has great test coverage with continuous integration via Travis CI and it was designed with a message-oriented architecture, using RabbitMQ and JSON payloads.
Service Applications for Monitoring Ruby on Rails Apps
I have introduced Sensu because it is an open source framework that is also written in Ruby. Of course, there are different commercial options on the market that you might consider:
Actions and Events
There is a subtle relationship between data and events. Generally speaking an event is a data point resulting from something that has simply happened, and where different information has been recorded. An event can be the result of a user action, or of a state change in your system.
Events are a unifying paradigm crossing different fields of study, and how you define events in your service will inherently depend on the kind of problem that your business or application is trying to solve.
Events that we will consider valuable to record are those that we are interested in. Other types of events still occur, but we may decide to ignore them.
Doing Data Science
Data science, or more generally simply reasoning about data, can really make a difference in a number of situations. To get started with data science you don’t need to have a degree in statistics, but some learning and research might be required, especially at the beginning. Lectures from the Harvard Extension School’s Data Science class (CS109) are freely available online and are a good starting point.
Imagine that you have deployed an application suggesting videos based on certain information about the user. Imagine now that you also wish to offer the user an interesting new video every time she logs in.
In order to recommend something that your users will find interesting, though, you have to learn something about them. This is usually accomplished by creating a system that is able to collect users’ preferences and then make some predictions based on those preferences. For example, if a user has shown interest in basketball, it is likely that he might enjoy a video like “Best game winner in NBA history.” The resulting predictions can be used for a variety of services, from search engines to resource suggestions and targeted advertising. The system’s functionality thus relies on users implicitly or explicitly revealing their activity and personal preferences, which are ultimately used to generate personalized recommendations.
In order to create profiles of your users’ activities, you might start to collect different information. The kind of information that you might be interested in includes not only what videos they have actually watched, but also if they have decided to watch certain videos again, what time of the day they are most likely to log in at, and which days of the week they are most likely to share videos.
As you start considering which events to store and to analyze, you might find out more about the users of your platform. For example, you might notice that some of your users are more likely to watch a video from the beginning to the end, while others will tend to skip part of it or even close it before it has finished. Some users are more likely to share on other platforms what they have watched, while others will just ignore the platform recommendations.
As you start analyzing raw event data, you might start to ask yourself some questions:
- What patterns can you isolate about events in your platform or your users’ behavior?
- What is the average activity on your platform? What does this look like?
- What raw information can you translate into a predictive model?
- What raw information can be used to create useful metrics about your platform?
As you start asking yourself questions about your data, you will be able to create more meaningful data points that correspond to particular actions happening on your platform, and display aggregated data about these actions.
In our example scenario, users would be presented with a video that had been recommended to them. They could watch the video, share it, or just skip it by moving to the next video.
Each user can therefore perform three possible actions:
- Watch
- Share
- Skip
The three actions do not need to be exclusive. This means every combination of the three actions is possible in our app. Users can watch a video, then share it, then skip it and move on to the next video. They can also share it without watching it, or watch it for a while and then skip it, and so on.
Each action can also be analyzed from different points of view. For example, we can count how many videos were watched or shared in a certain time frame, or how many users skipped a certain video.
Once you start aggregating data, you will discover what metrics make the most sense for your platform. But once again, as you start counting and measuring you will start asking yourself some new questions:
- If you are measuring the number of videos watched, are you counting unique views or total number of views?
- If you are measuring the number of shares, are you counting the number of videos that were shared or the total number of sharing actions performed?
- What time ranges are you choosing for your aggregated metrics? Why?
- Are your metrics localized on your time zone or on the user’s time zone?
- What models, algorithms, and analyses should you consider and implement?
How you answer all these questions depends on a number of factors that are mostly dictated by your application problem and real-world context.
Plotting Data
There are different solutions available nowadays for visual time series analysis and plotting of statistical data.
We will concentrate on importing and plotting data with Graphite, a monitoring solution originally developed by Chris Davis at Orbitz back in 2006. Graphite is released under the open source Apache 2.0 license and its source is available on GitHub. Documentation is available online.
Graphite was designed to run on cheap hardware and do two main things: store numeric time-series data and render graphs of this data on demand. It consists of three software components: Carbon, a set of daemons that make up the storage backend; Whisper, a simple database library for storing time-series data; and the Graphite web app (graphite-web), a Django app that renders graphs on demand using Cairo.
The component responsible for receiving data into Graphite is Carbon. All Carbon daemons listen for and accept time-series data over a set of common protocols, but they do different things with that data once they have received it. There are three kinds of Carbon daemons in Graphite: carbon-cache, carbon-relay, and carbon-aggregator.
In a simple installation, only the carbon-cache daemon is typically used. carbon-cache accepts and writes metrics to disk. Metric values are first cached into RAM as they are received, and then flushed to disk at intervals using the underlying Whisper library.
As traffic increases, one carbon-cache instance may not be able to handle the load. In this case multiple carbon-cache instances can be run behind a carbon-aggregator or a carbon-relay, possibly on multiple machines.
The carbon-relay daemon has two roles: replication and sharding. If run with RELAY_METHOD = rules, a carbon-relay instance can run as a carbon-cache server and relay all incoming metrics to multiple backend carbon-cache daemons running on different ports or hosts. If run with RELAY_METHOD = onsistent-hashing instead, you can use a DESTINATIONS setting to define a sharding strategy to spread reads across multiple carbon-cache backends.
Finally, a carbon-aggregator daemon can be run in front of a carbon-cache instance in order to buffer metrics over time before reporting them in Whisper. This reduces the I/O load, and is useful when granular reporting is not required.
Note
For further details on Carbon daemon configuration, see the Graphite documentation.
Feeding your data
To feed data into Graphite, we have three main methods available: plain text, Pickle, and the Advanced Message Queuing Protocol (AMQP).
The plain text protocol is the most straightforward option. Data must be formatted as <metric path> <metric value> <metric timestamp>. Carbon will then translate each line of text into a metric that Whisper and the web app understand.
The Pickle protocol supports sending batches of metrics to Carbon in one go, by formatting data into a list of multilevel tuples:
[(path,(timestamp,value)),...]
The last option is AMQP, an open standard used for passing messages between applications or organizations. In order to use AMQP with Graphite, when AMQP_METRIC_NAME_IN_BODY is set to True in your carbon.conf file, the data should be in the same format as with the plain text protocol. When AMQP_METRIC_NAME_IN_BODY is set to False instead, you should omit the <metric path> component.
Note
Carbon’s config files are all located in /opt/graphite/conf/. For a fresh Graphite installation, none of the .conf files will exist yet; you will instead find a .conf.example file for each one. You can simply copy the example files, removing the .example extension, and customize your settings.
The main Carbon configuration file is carbon.conf. This defines the settings for each Carbon daemon (the settings are documented by comments within the file itself). For more information on this and the other config files available, see the documentation.
The documentation also provides further details on the protocols you can use for sending data to Graphite.
All data stored in Graphite has a path with components delimited by dots. Therefore, before sending your data into Graphite you need to decide on a naming scheme and data hierarchy. For example, for our Walks application, citywalks.walks.london would represent the number of walks created for the city of London by our Citywalks API.
If you have already planned ahead which time series to feed into Graphite and what these mean, it should be easy to define a clear data hierarchy.
Note
If you’d like to learn more about using Graphite to store and render time-series data, Matt Aimonetti has written a great blog post on the topic; check out his “Practical Guide to StatsD/Graphite Monitoring”.
Another aspect to consider is that Graphite is built on a fixed-size database: Whisper. Therefore, you have to create the right configuration beforehand, depending on how much data you intend to store and at what level of precision.
Whisper is similar in design to a round-robin database (RRD), like that used by RRDtool. An RRD stores time-series data in a circular buffer, which allows you to keep the system storage footprint constant over time.
A circular buffer is a particular data structure. To understand how it works, imagine a buffer where the beginning is connected to the end. A structure like this is particularly suited for data stream buffering.
The precision of your data defines the time interval between two consecutive data points. If you store your data with one-second precision, it means you will have one data point for each second.
The storage cost is determined by the number of data points you want to store; the finer your precision, the more data points you will store in memory.
Graphite’s documentation provides a set of questions to help you determine the best retention configuration for your needs:
- How often can you produce your data?
- What is the finest precision you will require?
- How far back will you need to look at that level of precision?
- What is the coarsest precision you can use?
- How far back would you ever need to see data?
Data points are stored on-disk by Whisper as big-endian double-precision floats. Each value is paired with its timestamp, in seconds since the Unix epoch (01-01-1970).
Each Whisper database contains one or more archives. Each archive has a specific data resolution and retention policy, which is defined in number of data points or maximum timestamp age. The ordering of archives goes from highest resolution and shortest retention period to lowest resolution and longest retention period.
The archive with the longest retention period determines the total retention time of the database, as the time periods covered by the archives overlap. That is, a pair of archives with retention periods of 2 months and 12 months will provide only 12 months of storage—the length of its longest archive—and not 14 months.
This latest policy is one of the reasons why Whisper is somewhat inefficient in its usage of disk space: when a data point is written, Whisper stores the same data in all archives at once. Each archive will store that data point until its retention period is exceeded. To avoid too much duplication, lower-resolution archives should be configured to have significantly lower resolution and higher retention intervals than their higher-resolution counterparts.
As noted, Whisper also stores each data point with its timestamp, rather than inferring a timestamp from the data point’s position in the archive. The reason behind this design choice is that timestamps are used during data retrieval to check the validity of each data point: if a timestamp does not match the expected value for its position relative to the beginning of the requested series, the data point is considered out of date and a null value is returned instead.
When Carbon receives some data, it determines where on the filesystem the Whisper data file is located for each metric. If the data file does not exist, Carbon creates it. At this point Carbon needs some parameters, which it retrieves from the schemas file (which you create by creating/editing opt/graphite/storage-schemas.conf). In order of priority, from the highest to the lowest, Carbon looks for the first schema whose pattern matches the metric name. If no match is found, the default schema is used: two hours of minutely data. When the appropriate schema is determined, Carbon uses the retention configuration for the schema to create the Whisper data file appropriately.
Once you have completed the configuration steps, you are ready to start sending data into Carbon and visualizing that data in Graphite. There is much more that you will be able to do with Graphite in terms of monitoring and visualization, but that doesn’t fall within the scope of this book. If you are interested in the topic, you should check out the quickstart guide on Graphite.