Reducing Mean Time to Detection for High-Severity Incidents
Introduction
High-severity incident (SEV) is a term used at companies like Amazon, Dropbox, and Gremlin. Common types of SEVs are availability drops, product feature issues, data loss, revenue loss, and security risks. SEVs are measured based on a high-severity scale; they are not low-impact bugs. They occur when coding, automation, testing, and other engineering practices create issues that reach the customer. We define time to detection (TTD) as the interval from when an incident starts to the time it was assigned to a technical lead on call (TL) who is able to start working on resolution or mitigation.
Based on our experiences as Site Reliability Engineers (SREs), we know it is possible for SEVs to exist for hours, days, weeks, and even years without detection. Without a focused and organized effort to reduce mean time to detection (MTTD), organizations will never be able to quickly detect and resolve these damaging problems. It is important to track and resolve SEVs because they often have significant business consequences. We advocate proactively searching for these issues using the specific methodology and tooling outlined in this book. If the SRE does not improve MTTD, it is unlikely that they will be able to detect and resolve SEV 0s (the highest and worst-case severity possible) within the industry-recommended 15 minutes. Many companies that do not prioritize reducing MTTD will identify SEVs only when customers complain. We encourage organizations to embrace techniques of SEV detection as a means to reduce impact on customers.
In this book, you will learn high-impact methods for reducing MTTD through incident classification and leveling, tooling, monitoring, key performance indicators (KPIs), alerting, observability, and chaos engineering. You also learn how to reduce MTTD for self-healing systems when SEVs occur. By introducing the recommendations in this book, you will be able to classify an SEV and route to an appropriate TL who accepts responsibility for resolution within 2 to 10 minutes.
This report does not cover how to reduce mean time to resolution (MTTR). To learn more about reducing MTTR, refer to the following resources: Site Reliability Engineering, The Site Reliability Workbook, and Seeking SRE (all O’Reilly). Here we explore the following high-impact methods to reduce MTTD for SEVs:
-
Step 0: Incident classification, including SEV descriptions and levels, the SEV timeline, and the TTD timeline
-
Step 1: Organization-wide critical-service monitoring, including key dashboards and KPI metrics emails
-
Step 2: Service ownership and metrics, including measuring TTD by service, service triage, service ownership, building a Service Ownership System, and service alerting
-
Step 3: On-call principles, including the Pareto principle, rotation structure, alert threshold maintenance, and escalation practices
-
Step 4: Chaos engineering, including chaos days and continuous chaos
-
Step 5: Self-healing systems, including when automation incidents occur, monitoring, and metrics for self-healing system automation
-
Step 6: Listening to your people and creating a high-reliability culture
These steps are detailed in the following sections.
Step 0: Incident Classification
Given how often incidents are making public news—for instance, at Delta, the US Treasury, YouTube—it is important to call out the real impact they have on businesses. The expectations of customers for real-time, performant, available, and high-quality product experiences in 2018 is greater than ever before. Let’s begin by looking at how SEV levels are classified so that you can establish your own high-severity incident management program at your company.
SEV Descriptions and Levels
We recommend SREs set a goal within their organization to determine the SEV level of an incident and then triage and route the incident to an appropriate TL. In this book, we set the goal as a five-minute MTTD for critical services. This enables us to have 10 minutes to work on resolution or mitigation for the most critical SEVs (SEV 0s).
As an industry, if we aim to resolve SEV 0s within 15 minutes, we must optimize TTD to ensure that we have more time to work on technical resolution and mitigation.
Table 1-1 describes example SEV levels. We define an availability drop as a rise in 500 errors.
|
SEV level |
Description |
SEV example |
Target resolution time |
Who is notified |
|---|---|---|---|---|
|
SEV 0 |
Catastrophic service impact |
>10% availability drop for >10 minutes |
Resolve within 15 minutes |
Entire company |
|
SEV 1 |
Critical device impact |
>10% availability drop for one to five minutes |
Resolve within eight hours |
Teams working on SEV and CTO |
|
SEV 2 |
High service impact |
<5% availability drop for one to five minutes |
Resolve within 24 hours |
Teams working on SEV |
You can see a more detailed guide on creating SEV Levels in this paper on “How to Establish a High-Severity Incident-Management System”.
SEV roles and responsibilities
Two key roles are critical in creating a successful high-severity incident-management program:
- IM
-
Incident manager on call
- TL
-
Technical lead on call
Roles and responsibilities of the IM
The primary role of the IM is to resolve SEVs in a safe and fast manner. At many companies, this person has the authority to take whatever steps are needed to resolve the incident. A key aspect is having one person to make the judgement calls needed when time is short.
IMs lead and coordinate the SEV team through the SEV life cycle. The SEV life cycle encompasses detection, diagnosis, mitigation, prevention, and closure. The IM role is also commonly referred to as the call leader.
Having only one person in the company responsible as the leader of an SEV results in faster resolution times. Having a chain of command during urgent events enables the entire company to react as quickly as possible. This is measured as MTTR.
Having an IM responsible for an SEV provides many benefits:
-
The IM is focused on time to recovery (TTR) for the SEV.
-
The IM aims to resolve SEV 0s within 15 minutes.
-
Everyone in the company knows who to follow as a top priority.
-
The IM uses their leadership skills to keep the team calm.
-
Engineers working on SEV mitigation can remain focused on the technical work required to recover. They are required to provide only status updates to the IM.
-
The IM keeps the entire company updated on the progress of the SEV.
The IM plays a critical role during these SEV 0s. The entire company is notified and the external status page is updated to notify customers. The IM aims to resolve SEV 0s within 15 minutes. The IM promotes the following principles:
-
Staying calm
-
Working as a team
-
Following the lead of the IM
-
Communicating clearly and concisely
-
Prioritizing focus on the right things at the right time
The IM creates and facilitates any required chat channels, conference calls, video calls, or in-person SEV rooms. They use the most suitable communication methods that enable them to work effectively with everyone actively working on the SEV.
They keep everyone on the same page by creating and updating an SEV timeline during the SEV. The timeline includes what actions are happening and who is responsible. The IM makes sure to identify and raise anything that has changed during the SEV.
IMs have a wide knowledge of services and engineering teams. They have an understanding of all major changes that are happening across all services. They are aware of product launches and of migrations, and of changes to team services and structure. The IM stays calm and collected at all times. They have an ability to focus and drive the entire company toward mitigation and resolution.
The IM rotation team is responsible for supporting the IM. This is usually a team of fewer than 10 engineers across the company. The IM rotation team works together to proactively ensure that the entire company understands how SEVs are managed and categorized. The more effective the entire company is at categorizing and communicating SEVs, the quicker the IM can gauge the priority and impact of SEVs.
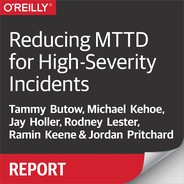
The IM rotation is a small rotation of engineering leaders, with one person on call in this role at any point in time. It is a 24/7 rotation with one primary IM and one secondary IM on call for a week. The secondary is also on call 24/7 and is there to pick up any pages that slip through past the primary. Secondaries are a backup for the primary and need to be available at any time so that the primary can escalate to them if needed. The secondary role is commonly activated in one of two ways. The first activation mode is when a page is not acknowledged by the primary within the set period of time (e.g., one minute), and the page is then automatically sent to the secondary. In the second mode of activation the primary pages the secondary and asks them to assist as a backup for an SEV.
Figure 1-1 shows an example of a five-person rotation.

Figure 1-1. Example of a five-person IM rotation structure
It is useful for the IM rotation to hold a monthly synchronization in which all IMs are allocated time to share feedback, and raise and review action items.
IM training is best conducted in a one-hour face-to-face training session with time for questions. Training involves shadowing and instruction sessions conducted to give IMs an understanding of the following:
-
SEV levels
-
The full life cycle of SEVs
-
Examples of previous SEV 0s that have occurred within your company
-
Access to an IM runbook with communications templates
-
Gamedays
It is vital to train IMs before they do their first rotation because they will be the sole person responsible for leading the entire company toward resolution of the SEV 0. IMs will first shadow as “super primary” before being added as a primary or secondary. If they are added as a super primary, this means that they will be paged the same as the primary.
Roles and responsibilities of the TL
TLs are technical experts from different service areas charged with diagnosing, mitigating, and resolving SEVs as quickly and safely as possible. But they aren’t burdened with keeping engineers calm or keeping management in the loop—that’s the IM’s job. Rather, a TL settles in the trenches and stays laser-focused on technical problem solving, calling up to the IM for help—or to give status updates—only when necessary.
Other engineers respect the TL’s need to focus, but they are ready to jump in and help when called on. The TL works heroically, but not alone!
After an SEV, the TLs work with their service teams to determine its root cause and create action items; for example, fixing a bug or deprecating some legacy system. After any fixes, the TLs lead chaos experiments to ensure the SEV doesn’t recur. These experiments are like integration tests but for your entire application stack.
Over time, this post-SEV practice improves mean time between failures (MTBF) and mean time to prevention (MTTP).
TLs take turns being on call, of course, and this is known as a TL rotation. If your engineering team is small (e.g., five engineers), you’ll create a single rotation that covers all service areas. For a larger engineering team (e.g., 50 engineers), you’ll create one rotation for each service area. How those service areas break down depends on the size of your team.
Suppose that you have 10 engineers. That’s enough for two rotations, given that an ideal rotation has five TLs. (Any more engineers, and no person will be on call often enough to stay sharp; any fewer, and the TLs might burn out.) With two rotations, you need to break down your services into two buckets, as in the following example:
- Rotation 1
-
Infrastructure engineering services: responsible for internal services such as MySQL, Memcache, Amazon S3, Kafka, monitoring, and self-healing software.
- Rotation 2
-
Product engineering services: responsible for customer-facing services such as UI, billing, web apps, desktop apps, and mobile apps.
During any given week, each rotation designates a primary and a secondary TL. At any given moment, however, each rotation has only one acting TL. Letting a single engineer take charge keeps everything moving forward, which improves your MTTD and MTTR.
Figure 1-2 illustrates what your two rotations might look like.
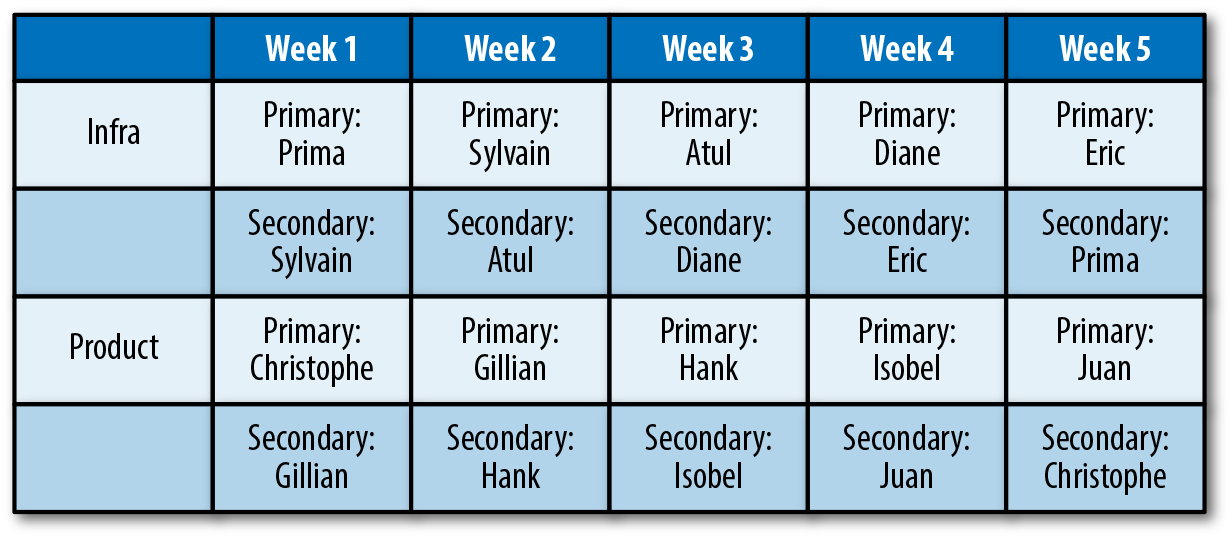
Figure 1-2. Example on-call rotation structure
Notice that each TL serves first as secondary and then as primary the week after. This lets a likely rusty TL warm up as they return for duty.
As your engineering team grows, you’ll add more five-person rotations and redefine your service buckets in whatever way makes sense for your company. For example, if your mobile app is more complex and less stable than other parts of your stack, it might warrant its own TL rotation as your team grows to 15. A different company might give its web app its own rotation.
Because TLs are solely responsible for driving technical resolution of SEVs, new TLs must receive training before their first on-call rotation.
One or more experienced TLs should hold a one-hour, face-to-face training session that covers the following:
-
The basics of SEV management programs
-
The basics of chaos days (view the O’Reilly Velocity Keynote to learn more)
-
Examples of previous SEV 0s at the company, including debugging techniques
-
Mitigation techniques for SEV 0s
After training, add each new TL to the pager rotation for their service area—and test that they actually receive pages. Also test that pages roll over to secondary TLs when the primary doesn’t answer within one minute. TLs will first shadow as super primary before they are added as a primary or secondary. Being super primary means that they will be paged the same as the primary.
Finally, give each TL full access to any monitoring, reliability, networking, and performance tools and dashboards.
The SEV Timeline
As introduced earlier, TTD is the time internal from when the incident started (e.g., the code was introduced in production or the configuration change was made) to the time it was acknowledged by an engineer who could start working on resolution. From our experience, it is possible for SEVs to exist for hours, days, weeks, and even years without detection.
The overall life cycle of an SEV (as shown in Figure 1-3) includes the following:
-
TTD: Time to detection
-
TTR: Time to resolution (mitigation)
-
TTP: Time to prevention
-
TBF: Time between failures
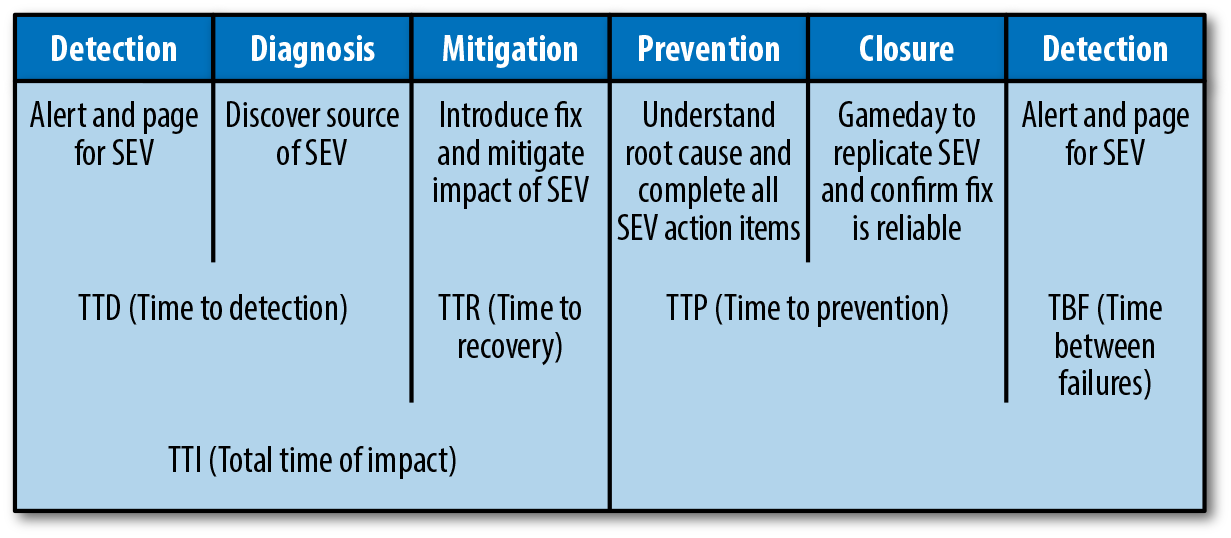
Figure 1-3. The SEV life cycle
The TTD Timeline
The TTD timeline includes SEV detection tooling, determining the SEV level, and routing to a TL who accepts responsibility for resolving the SEV.
The overall life cycle of TTD includes the following phases:
- Start of incident
-
This is when the issue started (e.g., the bug was introduced or the change in query patterns occurred).
- SEV automation tooling
-
Based on our experience, it can take between seconds and years for an incident to be picked up with SEV automation tooling. An SEV undetected by an engineer might lie dormant for years but still cause damage to customers and the business. SEV automation tooling includes the following:
-
Automated paging for a drop in Service-Level Objectives (SLOs)
-
Predictive paging that alerts engineers of impending doom
-
SEV tooling for people within your company to report SEVs
-
Determining the SEV level
After being paged, the IM will determine or confirm the SEV level. Ideally this stage takes a maximum of one minute. The SEV level will then do one of the following:
-
Stay at the original level
-
Be upgraded to a higher level; for example, from SEV 1 to SEV 0
-
Be downgraded; for example, from SEV 0 to SEV 1
An SEV level could change due to the IM realizing that the impact is much worse than originally assessed, or that the SEV has been occurring for a long period of time, or is a false alarm.
Routing to a TL to accept responsibility for SEV resolution
The IM triages and routes to an engineer (TL) who can begin working on a resolution.
Step 1: Organization-Wide Critical-Service Monitoring
Monitoring is a critical requirement on your journey to reducing MTTD for high-severity incidents. Monitoring software enables you to quickly gain insight into your applications and infrastructure.
Critical-Service Dashboard
It would be a major advantage for your company to have one central dashboard that gives your entire company the ability to view the overall health of your key product; this can prove advantageous in saving time detecting SEVs and scoping the extent of the impact. Everyone in your organization will be able to quickly understand if you are below the Service-Level Agreement (SLA), the period of time you have been in this state, and how widespread the issue might be (contained to a single region or service boundary). This dashboard is also used to visualize your ability to meet SLOs that you have set for availability.
Google SRE’s “Four Golden Signals”(O’Reilly) and Tom Wilkie’s RED Method are good baseline standards for what every critical service must have. Service teams should have alerting on each of these KPIs.
Figure 1-4 presents an example of a critical-service dashboard. You can create a dashboard similar to this one by using tools such as Datadog and Grafana.
Figure 1-4. Critical-service dashboard
High-Level Service Dashboards
Ensuring that each service has a high-level service dashboard enables your teams to quickly drill down into the health of their own service and other service teams. Having standardization for these dashboards helps all engineers quickly understand the information. Ideally, these dashboards are simple, easy-to-read dashboards that fit on one screen. It is also useful to organize charts logically in terms of data flow and upstream/downstream dependencies. The following subsection provides an example of a high-level service dashboard.
Key Indicators
The top section of the dashboard in Figure 1-5 is labeled “Key Indicators” to demonstrate the health or lack of health of the particular service in question.
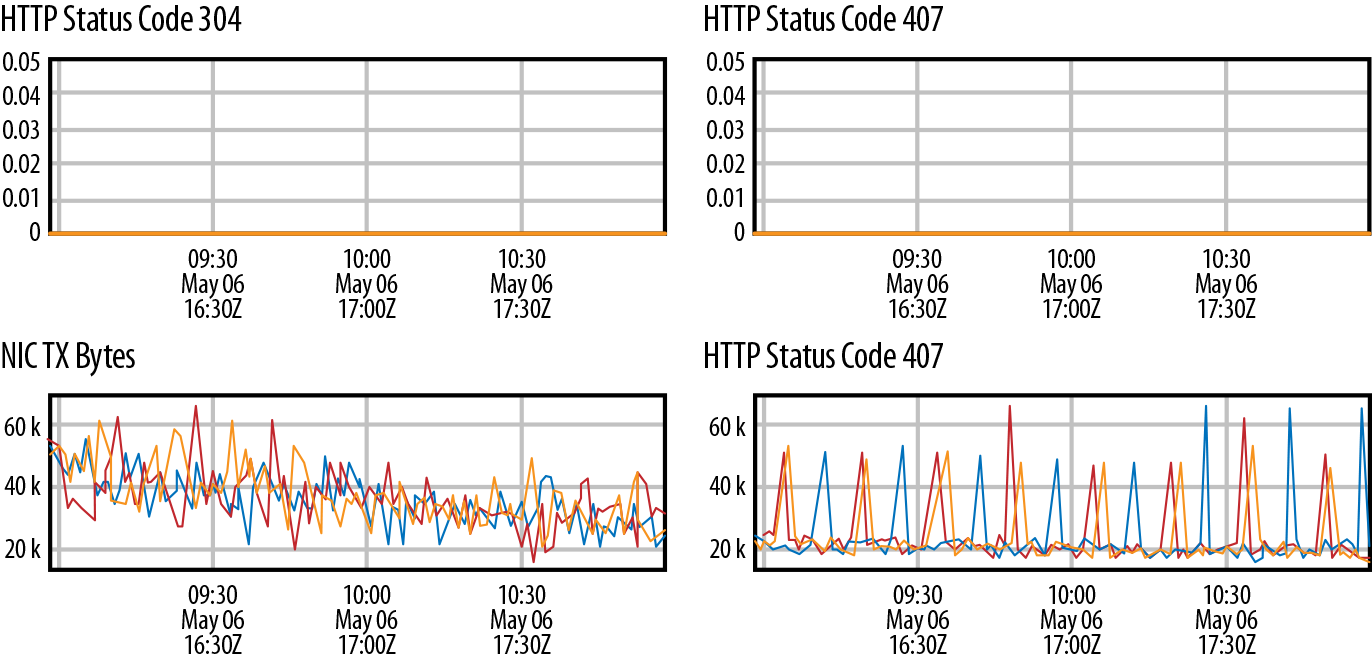
Figure 1-5. Key Indicators dashboard
$Servicename$ Instruments
The next section down on the dashboard includes other metrics and instruments directly measuring the service. We just call this $Servicename$ Instruments; $Servicename$ being a placeholder name for each service. Figure 1-6 shows an example of a Proxy Instruments dashboard.
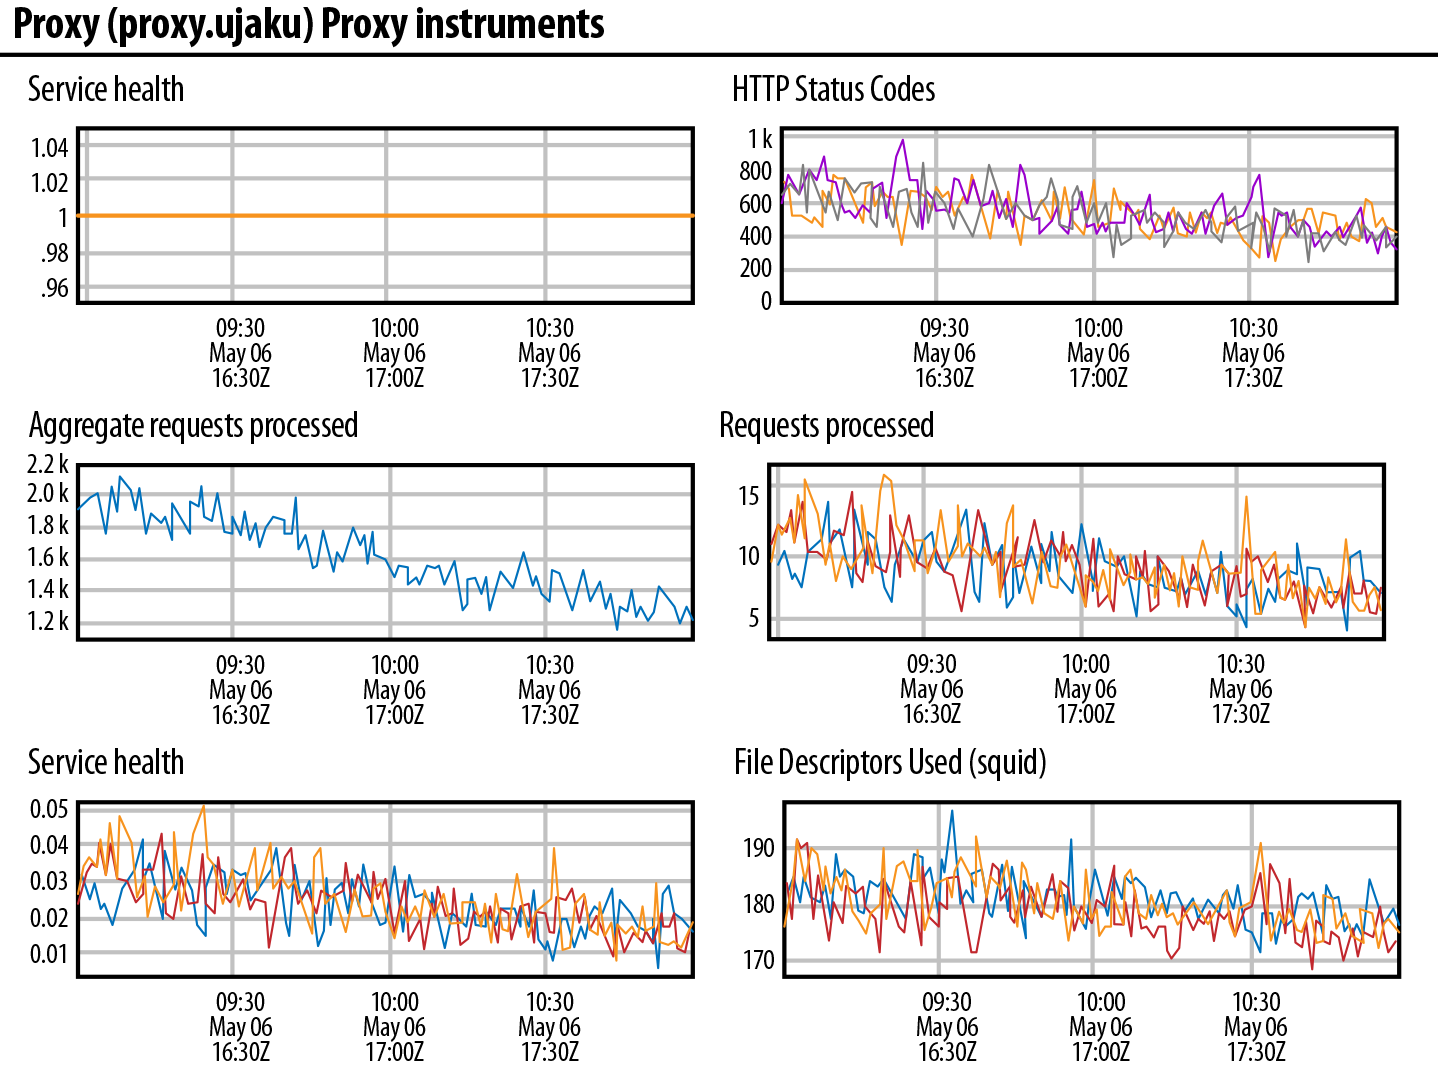
Figure 1-6. Proxy Instruments dashboard
System Services Health
Next, there is System Services Health. These are all the other services required for the infrastructure to be considered “healthy.” These services are: Secure Shell (SSH), Domain Name System (DNS), Puppet is running, Network Time Protocol (NTP), and Lightweight Directory Access Protocol (LDAP). Figure 1-7 shows an example of a System Services Health dashboard.

Figure 1-7. System Services Health dashboard
Host General Health
After that, you should ideally keep base metrics on every host regardless of which services are running on it. This is the Host General Health dashboard. The next few sections focus on a set of metrics we have identified and honed over the years to give us some clear metrics around how the host is performing outside of the operation of the specific services we care about. These measure things like uptime, CPU load, memory usage, I/O latency, and a few key others that we have identified. Recently, we added SSD wear; we found SSDs with wear measuring over a certain amount—as reported by smartctl (specifically, /usr/sbin/smartctl -l ssd $pathtodevice(s))—were prone to fail, so we preempt that by replacing drives when they reach a particular number. Figure 1-8 shows an example of a Host General Health dashboard.

Figure 1-8. Host General Health dashboard
Host Network Health
Next, there is Host Network Health, which comprises just the general network measurements, TX/RX rates, latency, interface errors, frame errors, and packet loss. Figure 1-9 shows an example of a Host Network Health dashboard.
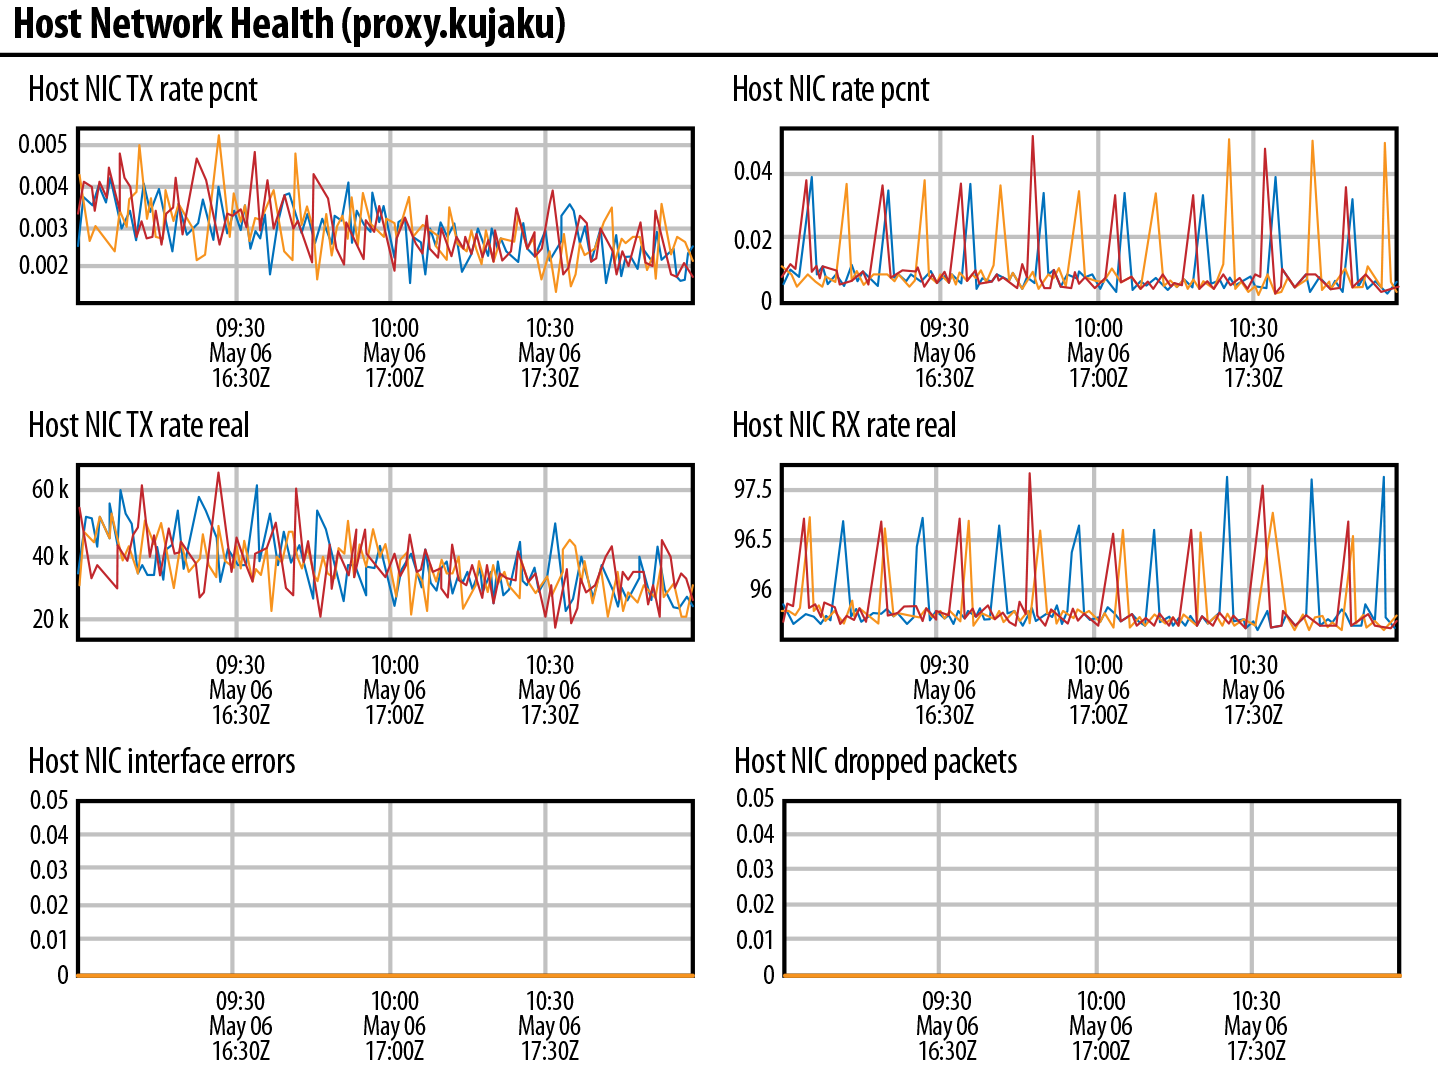
Figure 1-9. Host Network Health dashboard
Critical-Service KPI Metrics Emails
The purpose of KPI metrics emails is to share the good progress and the problems affecting services in an automated way. They also make it easier for people across your company to see patterns and trends.
The audience for these emails would be your executive leadership team members including the CTO and the VP of engineering. Each email should be a brief and easily understood high-level summary, which is also available outside the VPN. Engineering managers and tech leads are also encouraged to subscribe to these emails and respond to them with additional information if metrics are not meeting expectations.
Critical-Service KPI Emails
The monthly email containing rolled-up monthly metrics (as shown in the following example) should be sent at 8 a.m. on the first day of each month. There should also be a daily and hourly email. It is usual to use traffic light colors (red/green) to make the emails easier to read and understand. Color coding also helps engineering teams quickly assess status.
|
Critical systems |
Last month’s SLO |
Previous month’s SLO |
|---|---|---|
|
WWW |
98.00 |
99.99 |
|
API |
98.00 |
99.99 |
|
Client |
99.90 |
99.99 |
|
Services |
Last month’s SLO |
Previous month’s SLO |
|---|---|---|
|
DynamoDB |
99.99 |
99.99 |
|
Hadoop |
99.86 |
99.98 |
|
Memcache |
98.00 |
99.99 |
|
Capacity |
Last month’s host capacity |
Previous month’s host capacity |
|---|---|---|
|
DynamoDB |
74% |
63% |
|
Hadoop |
75% |
60% |
|
Memcache |
79% |
79% |
|
Engagement |
Last month’s metrics |
Previous month’s metrics |
|---|---|---|
|
Pageviews |
1,400,000 |
1,300,000 |
|
Signups |
250,000 |
200,000 |
|
Sessions |
1,000,000 |
900,000 |
Daily Service-Specific KPI Email: A Database Example
A KPI service email should contain rolled-up daily metrics for each critical service—as shown in the following example—and be sent out daily at 8 a.m.
|
Backups |
1 day |
7 days |
28 days |
|---|---|---|---|
|
Mean Full Cycle Time—Long Backup |
|
|
|
|
Mean Full Cycle Time—Short Backup |
|
|
|
|
Successful Backups—Long Backup |
|
|
|
|
Failed Backups—Long Backup |
|
|
|
|
Successful Backups—Short Backup |
|
|
|
|
Failed Backups—Short Backup |
|
|
|
|
Recovery |
|
|
|
|
Mean Recovery Time—Long Backup |
|
|
|
|
Mean Recovery Time—Short Backup |
|
|
|
|
Successful Recovery—Long Backup |
|
|
|
|
Failed Recovery—Long Backup |
|
|
|
|
Mean Recovery Total Time—Long Backup |
|
|
|
|
Mean Recovery Total Time—Short Backup |
|
|
|
|
Availability |
|
|
|
|
Overall Primary Availability |
|
|
|
|
Overall Replica Availability |
|
|
|
|
Overall Proxy Availability |
|
|
|
|
Promotions |
|
|
|
|
Mean Time Promotions |
|
|
|
|
Successful Promotions |
|
|
|
|
Failed Promotions |
|
|
|
|
Mean Time Emergency Promotions |
|
|
|
|
Successful Emergency Promotions |
|
|
|
|
Failed Emergency Promotions |
|
|
|
|
Capacity |
|
|
|
|
Days to 85% Capacity |
|
|
|
|
Per-Region Freepool Capacity |
|
|
|
Step 2: Service Ownership and Metrics
With the rise of microservices, managing services has grown increasingly complex. Companies often have hundreds of microservices, and new services can spin up on a daily basis. This poses new challenges to ensure that reliability and durability/data-consistency goals are met. We now explore how service ownership and metrics can be useful in an environment with a microservice architecture.
The Role of Services in SEVs
An SEV can be isolated to one service, or an SEV might cause a cascading impact across many services.
How to track SEV impact by service
During the detection phase of an SEV, it is critical to quickly detect on which services your team will need to perform mitigation actions.
Service triage
During service triage, you are working to identify the critical service teams that will need to work on the SEV.
You are also identifying impacted services. For example, a critical issue with the API might be causing a problematic impact for the mobile app, but the mobile app team only needs to be notified. It is unlikely that they will need to perform an action.
Service ownership
Before an incident happens, it is useful to have service ownership in place. This usually involves having a system to track services and the teams that own them. Service ownership is an advanced SRE practice. At a minimum, you should aim to at least be able to identify who owns the service and who the on-call is.
A simple example of a service ownership system is having an owners.yaml file in each code repository directory. A more advanced version is having a web application and command-line tool to view services and their owners.
Service ownership is often easier when there are fewer than 15 services. After that it becomes much more complicated; when there are thousands of services, it becomes very difficult to find service owners. Your service ownership system should answer these questions:
-
Which team owns this service?
-
Who is on call for this service?
-
How do I escalate?
-
How do I page this person?
-
Where does this person sit? Are they remote or in the office?
-
Can I call them on the phone during emergencies?
Building a Service Ownership System
Many companies have built their own Service Ownership Systems (SOS). To build one for your own company, follow these steps:
-
Define a list of services and the teams that own them.
-
Build a Responsible, Accountable, Consulted, and Informed (RACI) model that specifically relates to service impacts and changes, making clear the importance of manager accountability.
-
Automate service ownership.
-
As mentioned earlier, build a comprehensive System Services Health dashboard that shows the following SRE “Golden Signals” (as defined by Google and others) for each service:
- Rate
-
Request rate, in number of requests/sec
- Errors
-
Error rate, in number of errors/sec
- Latency
-
Response time, including queue/wait time, in milliseconds
- Saturation
-
How overloaded the resource or system is
- Utilization
-
How busy the resource or system is
There is a convincing argument to be made that ownership of services in an application is the most important aspect of production readiness and creating a culture of high reliability.
SOS can take many forms, but generally speaking, a good SOS will contain the following data points:
-
Service name
-
Single sentence that describes what the service does (this can be the most difficult and time-consuming part of creating a service catalog)
-
Brief technical description of how the service is consumed or accessed
-
Brief description of the immediate impact of disruption or degradation of the service
-
Team responsible for managing the service
-
Manager accountable for the service
-
RACI model for communicating changes to as well as disruptions/degradations of the service
Having centrally defined ownership is key to managing monitoring, self-healing, and escalation of the service. Open source tools like LinkedIn’s oncall allow for teams to define ownership and on-call teams. It is important to have this information defined before the service goes into production.
Service Alerting Configuration
Now that we understand the services within our company, we can accurately configure our alerting tooling to alert by service. A paging and alerting service (e.g., LinkedIn’s Iris) enables you to quickly create services, service teams, schedules, and escalation policies, and add users.
Services
When setting up services within your paging and alerting system it is useful to label them by the software name; for example, DynamoDB and/or cluster name. Here is a list of example services:
-
MySQL
-
MemcacheD
-
S3
-
Lambda
-
Kafka
Service teams
Your service teams should be named as they are known internally within your company. For example, if you have a serverless team, you would add Serverless as a service team. Here is a list of example service teams:
-
Traffic and Edge
-
Databases
-
Messaging
-
Storage
Schedules
When you’re setting up schedules in your paging and alerting system, it’s useful to create rotations six months in advance. This enables engineers to know when they are on call, and assists with logistics such as switching on-call schedules during vacation. Here are some recommendations that you might want to follow:
-
Create 24-hour, 7-day rotations during which one engineer is a primary and one engineer is a secondary.
-
Start schedules on Wednesday at 10 a.m. to enable on-call handoff to occur at 10 a.m. Wednesday.
-
Aim to keep rotations for services under 10 people; 5 or fewer is ideal.
Users
Every engineer who is on call will be added as a user to the paging and alerting platform. Here are some recommendations for doing this:
-
Create an email alias for each user so that they can be paged via email; for example, [email protected].
-
Create a Slack slash command so that each user can be paged via Slack, /page-tammy.
-
Have each engineer responsible for running the on-call handoff for their scheduled rotation.
Step 3: On-Call Principles
SREs have become the new guardians of the internet. They are responsible for making sure your favorite online products and services are highly available and that your data is never lost. The practice of being on call was a major shift in the 2000s, when customers began to expect everything to be up-and-running 24/7.
On-Call Schedules
Creating effective on-call schedules within your alerting software that are visible by your entire engineering team will enable you to reduce MTTD due to increased visibility of who is on call for each service at any time.
It is important to take the time as a team to decide on effective rotations and come to a consensus.
Service teams
Figure 1-10 shows an example of an on-call schedule for a Traffic and Edge team.
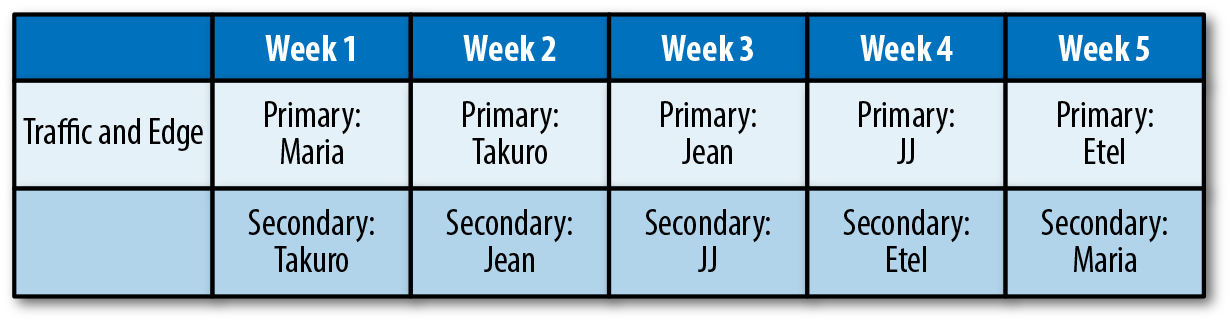
Figure 1-10. An on-call schedule for a Traffic and Edge team
On-Call Alerting
For effective alerting, you need to address two concerns: alerts should be properly configured, and frequently reviewed for applicability.
Configuring alerting
In general terms, paging alerts should be critical alerts only, for which automated remediation is either not an option because of scale or because the complexity of the alert requires intervention by multiple teams.
An SRE who is paged should be able to begin taking action on the alert within a few minutes. You can sharpen up the granularity of your time scale here, but, in general, you don’t want to page someone and have them still researching the issue and triaging the root cause an hour later.
False positives, alert burden, and alert maintenance
The problem of false positives is a persistent one. SRE teams should commit to reviewing alert architecture at least once per quarter and examining in detail the top 10 most frequent alerts to determine whether there is action needed to mitigate the root cause or if alert thresholds need to be tuned.
SRE managers should intervene and mandate some sort of “time out” period on new infrastructure changes or code deployments if the alert volume for critical, pageable alerts exceeds a 1:1 ratio with SREs.
Alert maintenance is a necessary part of the operational management of a service. If alerts fire frequently (especially with little value to the person receiving it), it can create a phenomenon known as alert fatigue. Alert fatigue leads to desensitization, which can lead to longer response times or missed alarms.
Step 4: Chaos Engineering
Chaos engineering is a seris of thoughtfully planned experiments designed to reveal the weaknesses in our systems. To learn more about chaos engineering, you can refer to Chaos Engineering (O’Reilly), a book written by the Netflix Chaos Engineering team (Ali Basiri, Nora Jones, Aaron Biohowiak, Lorin Hochstein, and Casey Rosenthal).
Chaos engineering can help prevent extremely large losses in revenue, reduce maintenance costs, create happier and more engaged engineers, improve on-call training for engineering teams, and improve the SEV (incident) management program for the entire company.
You can use chaos engineering in a safe way to break a system in a way that would trigger a predictive warning alert to fire. For example, you could remove extra capacity and ensure that an alert fires when a capacity threshold his hit (e.g., 85% utilization). We do this to monitor our monitoring; how do we know whether our alerts will fire if we don’t test them?
Following is an outline of this chaos engineering experiment:
Hypothesis: An 85% capacity alert will fire when we remove capacity from our fleet to reach this percentage.
Experiment: Remove 20% capacity to reduce total capacity for a specific service to reach the 85% capacity threshold alert.
The insights from chaos experiments can mean a reduction in incidents, reduction in on-call burden, increased understanding of system failure modes, improved system design, faster MTTD for SEVs, and reduction in repeated SEVs. It is important to ensure that you are practicing chaos engineering in a safe, secure, and simple way to be confident that you are not causing undue harm.
An effective way to start practicing chaos engineering in your company is to run a chaos day. You can learn more about chaos days in Tammy Butow’s O’Reilly Velocity Keynote.
Step 5: Detecting Incidents Caused by Self-Healing Systems
Self-healing systems can also break in unexpected and unpredictable ways. Without adequate testing, these systems are very dangerous and can cause cascading failure and SEV 0s. It is important to ensure that these pathways are tested.
Self-healing systems allow an automated process to attempt a fix of the affected system(s) before a human is required to take action. These systems can be as simple as restarting a stopped process or as complicated as a tree-based branching system. Self-healing systems allow for a fast, predictable response to an alert or set of conditions. This eliminates the requirement for human escalation and intervention and thus faster remediation.
Examples of self-healing systems include Facebook’s FBAR, LinkedIn’s Nurse, Netflix’s Winston, and the publicly available StackStorm. In this book, we focus on how to detect incidents caused by self-healing systems.
As useful as self-healing systems are, they do enable the potential for issues to be hidden (via constant remediation) or missed (because of a lack of escalation). Self-healing systems might only partially remediate issues without notification, leading to higher TTD. If you are using self-healing systems, there should be some form of notification that a workflow was executed as expected. Equally, escalations should be performed if the workflow does not successfully complete.
Similar to “alert maintenance,” self-healing workflows need to have layers of reporting to give visibility to the number of times a particular workflow is executing. Self-healing workflows should be a last line of defense and should not be firing regularly.
An example of self-healing workflows going wrong is a new version of a load-balanced service being deployed that has a memory leak. The service runs out of memory about 10 minutes after the service has been started. The self-healing workflow executes and restarts the service without users noticing issues because the service is load balanced. The problem is, because there is no notification that the workflow is executing, this constant restarting happens for days before anyone notices.
Step 6: Listening to Your People and Creating a High-Reliability Culture
If you are an SRE manager or director, you already have one of the most valuable, most intuitive, most resilient early warning systems in place: your people.
The importance of listening to them cannot be overstated. All organizations that have embraced a culture of high reliability make leadership accountable for regular, meaningful check-ins with their people.
Although survey fatigue is a real problem, it is important that leadership take some kind of survey of their reliability culture at least twice a year, and be able to demonstrate to their teams and to company leadership how they are closing the gap in problem areas.
You can easily adapt and modify this survey to suit your purposes, but, in general, leadership should be focused on these themes to create a high-reliability organization:
- Preoccupation with failure
-
Treating anomalies as symptoms of a problem with the system. The latent organizational weaknesses that contribute to small errors can also contribute to larger problems, so errors are reported promptly and problems can be found and fixed.
- Reluctance to simplify interpretations
-
Taking deliberate steps to comprehensively understand the work environment as well as a specific situation. Personnel are cognizant that the operating environment is very complex, so they look across system boundaries to determine the path of problems (where they started, where they might end up) and value a diversity of experience and opinions.
- Sensitivity to operations
-
High-reliability organizations are continuously sensitive to unexpected changed conditions. Personnel monitor the systems’ safety and security barriers and controls to ensure that they remain in place and operate as intended. Situational awareness is extremely important to high-reliability organizations.
- Commitment to resilience
-
Developing the capability to detect, contain, and recover from errors. Errors will happen, but high-reliability organizations are not paralyzed by them.
- Deference to expertise
-
A willingness to follow a typical communication hierarchy during routine operations but defer to the person with the expertise to solve the problem during upset conditions. During a crisis, decisions are made at the front line, and authority migrates to the person who can solve the problem, regardless of their hierarchical rank.
Conclusion
Working toward reducing MTTD is a critical initiative for every SRE team to undertake. Taking these key actionable steps will help you reduce MTTD for high-severity incidents by ensuring that you have established appropriate incident classification, critical-service monitoring, service ownership and metrics, on-call principles, chaos engineering, and self-healing systems.
Ensuring that your team has a high level of maturity for incident classification and critical-service monitoring is the most effective way to begin reducing MTTD for high-severity incidents.
Further Reading on Reducing MTTD for High-Severity Incidents
We encourage you to explore the following:
-
Algirdas Avizienis, Jean-Claude Laprie, Brian Randell, Carl E. Landwehr (2004). “Basic Concepts and Taxonomy of Dependable and Secure Computing.” IEEE Trans. Dependable Sec. Comput. 1(1): 11–33. [PDF]
-
Dependability and security attributes (availability, reliability, ...)
-
Dependability and security threats: taxonomy of fault, error, failures
-
Means to attain dependability and security: prevention, tolerance, removal, and forecasting
-
-
Kishor S. Trivedi and Andrea Bobbio (2017). Reliability and Availability Engineering: Modeling, Analysis, and Applications. Cambridge University Press.