8. Lost in Translation
In theory, retirement planning is simple. You need money to retire, so you save and invest during your earning years, invest over the long haul, and when you retire, you put on some Bermuda shorts, call a moving company, and head to Phoenix or Florida. But in reality, it’s much more complex. Why? Mainly because there are human emotions involved. There are new desires and changing desires. There are mistakes that are made and there is good fortune. There are changing and unanticipated family situations. All these things, along with inflation, longevity, healthcare, and taxes get in the way of the simple act of creating financial plans for retirement. The result? That simple act becomes more complex, which is why 82% of Americans said they have a better sense of their medical and auto policies than they do their retirement plan.1
But the financial world has a good deal of complexity with or without tackling retirement. Complexity in the financial world can take many shapes. It may be as basic as simple math—adding, subtracting, or applying simple interest. Or it can be much more convoluted. But complexity in the financial world can also be represented by sheer size. The size of a financial problem can become so big that our ability to comprehend it is compromised. We shrug our shoulders, shake our heads, and insist that the subject be changed to something a bit easier to understand, like molecular microbiology, for example.
The numbers that are represented by the deficit our federal government has nurtured over the years are the perfect example of complexity via size. Many people are confused by the numbers thrown around. We have heard numbers such as $1.4 trillion, $12 trillion, and $383 billion. Many of these are used to describe both debt and deficit. The deficit is the difference between what the government takes in, called receipts, and outlays, which is what the government spends, which includes Social Security and Medicare benefits. When there is a deficit, the Treasury must borrow money needed for the government to pay the bills. The government’s accumulated deficits are essentially the government’s debt. The Congressional Budget Office estimated our deficit for 2009 was $1.4 trillion (about 10% of the Gross Domestic Product), but that is not the extent of our “debt.”2 Not by a long shot. According to an article in The Wall Street Journal, as of September 30, 2009, the national debt was almost $12 trillion, and interest on that debt was $383 billion for the year, according to the Treasury Department’s Bureau of the Public Debt. In August 2009, the White House Office of Management and Budget (OMB) estimated total government revenues at about $2 trillion. The revenue estimate included $904 billion from individual income taxes. This means the cost of interest on the debt represented more than 40 cents of every dollar that came in from individual income taxes.3 It’s gotten to the point where I recently saw a bumper sticker that read, “Don’t tell Washington what comes after trillion.” Then I saw another one that read, “Are you better off than you were $4 trillion ago?” The numbers are tossed around in such a cavalier fashion that many people stop discerning between a million, a billion, and a trillion. But the difference is astonishing.
Consider this example: Imagine that I offer to buy you and your significant other a nice weekend in Vegas. How much would you need for a fun-filled weekend there? Would $10,000 do the trick? When I ask that of most people, they indicate that it would. That’s probably enough for first-class airfare, a very nice hotel, a nice dinner, a limo, and even some fun at the tables. Well, if I gave you that $10K in $100 bills, the stack of those bills would be about 1/2” high—not exactly, but a close enough proxy. What if I told you that I would make the same offer to 99 of your best friends? How tall would the $1M stack of $100 bills be to support this generous gift? It would be somewhere around 5 feet tall.
But we are still not tackling the kinds of dollars that are spent today. No; today, our nation’s vocabulary has the word “trillion” popping up a lot more frequently. How high would that pile of money be if it contained $1 trillion of $100 bills? Common responses to that question might be, “30 feet!” or “The height of the Empire State Building!” or “As high as the length of three football fields!” Not even close. Would you believe 789 miles tall? That’s about the height of 144 Mt. Everests! That’s a lot of “Benjamins,” as the kids say. Or look at it this way: If a bunch of free-spending senators laid that trillion-dollar stack down in Washington and started driving west, they’d get to Fort Wayne, Indiana, before they came to the end of the $100 bills. If all these lengths, numbers, and distances sound overly complex to you, it’s probably because you’ve reached the point where you are numbed by numbers. Number numbness is the tendency for a person to be simply overwhelmed by large numbers, such as government cost estimates and projections, or by all the baggage associated with the allusive “number” representing a retiree’s nest egg. And this numbness often leads to apathy and inertia. I have had some advisers tell me that they avoid the conversation of “the magic number” with some clients because, if they hear the actual amount, their eyes roll back in their heads and they give up altogether. The thinking seems to be that it is better to get them moving toward the goal to some degree. For some clients, this is probably true.
Just like a single dollar is pretty easy to understand, so is a single second in time. It’s so quick that it passes fleetingly. Blink your eyes and a second is gone. Blink your eyes 86,400 times in a row and a whole day is gone. So given that knowledge, you might think that a million seconds could go by pretty quickly, and you’d be right. You probably remember what you were doing a million seconds ago because it happened just 13 days in the past. You likely remember where you were, whom you were with, and what you were doing. Your memory of a billion seconds in the past, though, may get a bit foggy. That’s because a billion seconds ago it was the late 1970s and the Bee Gees’ Saturday Night Fever album was topping the charts.4 You may not remember where you were then or who you were with, but you can be pretty sure that your hair was feathered and whatever you were wearing would embarrass you today. By the way, one trillion seconds ago western civilization didn’t yet exist. In fact, civilized society didn’t exist, as Neanderthals roamed the plains of Europe.
A single second, like a single dollar, is small. But when money and time is piled up, it can add up amazingly. That’s a lesson for anyone who’s at all intimidated by the numbers involved in adding up the money needed for retirement. Think of it this way: Every large amount starts as a small amount. Although it may sound too simple, the key to turning that small amount into a larger amount is time and discipline. Understanding the importance of time and discipline is a major component to understanding Retirementology.
The Retirement Brain Game
Number numbness—The tendency for a person to be simply overwhelmed by numbers presented, mainly because the numbers are so big that the person can’t comprehend exactly how big they are.
Bigness bias—Whether it’s inflation or compound interest, people have a tendency to overlook small numbers such as 1% or 2%. However, over time, those numbers become big. So whether people are paying a small percentage per year on their credit card interest or earning small interest on an account, the overall sum that is paid or earned is actually very big.
Hindsight bias—People often believe, after the fact, that some event was predictable and obvious when it was not predictable based on the information they had before the event took place. A person who’s unsure about making an investment might believe, after the investment goes up, that he did have the information ahead of time that told him that the investment would be a positive one.
Number Numbness Multiplied by Three
In their book Why Smart People Make Big Money Mistakes and How to Correct Them, authors Gary Belsky and Thomas Gilovich report the three ways that number numbness can affect long-term financial plans. The first is that you don’t take taxes and inflation into effect. The second is that failure to understand the odds and the role of chance can cause you to make unwise financial decisions. Third, many people have an indifference to small numbers, and that bias can cost them big bucks when it comes to their financial plans over time.
Failing to account for taxes and inflation. Let’s take a look at inflation. Many of you remember the inflation of the late ’70s and early ’80s. It was well into double digits and spawned something called the Misery Index, which combined the unemployment rate at the time with the inflation rate. The result of all this was an economic “malaise” that no one wants to repeat. Measuring inflation then was easy. Anybody who had a loan or wanted to borrow money was reminded of it daily. In December 1978, the prime rate (defined as the base rate on corporate loans posted by at least 75% of the nation’s 30 largest banks) stood at a now unfathomable 11.75%.5 Yet within 2 years, by December 1980, the prime rate had skyrocketed even further to a record 21.5%.6 Increased borrowing costs squeezed the budgets of corporations and individuals, and economic activity was essentially choked off. Rates can also exemplify the problem of failing to account for inflation.
Since 1982, America has embarked on a tremendous economic expansion that would take us through the dot.com bust at the millennium. During that period there was only one recession of note. But one thing that people forget about during that era of general prosperity is that inflation still existed. It may have been 1% or 2% annually, but it was still there. Even at that low level, inflation was doing what it always does: taking away purchasing power from consumers, especially consumers on a fixed income, such as retirees. Because the rate of inflation was relatively low, however, people didn’t pay much attention to it. Instead, they looked at their nominal returns over those years. A person who invested in the stock market on January 29, 1982, when the DJIA was 871.10, didn’t necessarily have 12.5 times more buying power with that money on January 31, 2000, when the Dow was 10,940.53.7 Many dollars that were invested in the stock market in 1982 and stayed there for the following 18 years increased many times in value, at a rate that far outpaced inflation. With the benefit of hindsight, this period looks like the Golden Age of stock investing, a time when investors felt they could wade into the market with great confidence that their principal would return a healthy profit. Today, that mindset seems like a quaint memory of a bygone era exacerbated by a press that seems all too willing to predict the next recession.
The role of odds and chance. Although there is much skill, reason, and understanding involved in making a good investment, these findings reflect how number numbness keeps investors from understanding the odds and role of chance in their investing. There’s nothing any single investor can do about the facts presented here, and it’s not dumb luck that has produced these kinds of returns over time. But the numbers can be intimidating, and a short-term loss can scare an investor away. Such findings as these make a pretty good case for the buy-and-hold strategy of investing, but the stock market is only one part of a retirement planning strategy you could consider. There are any number of other ways you can accumulate a nest egg—all those ways simply have to fall within your risk tolerance and comfort zone.
Such a stance can keep you from succumbing to a mind trick called hindsight bias. “People who experience hindsight bias misapply current hindsight to past foresight,” according to Hersh Shefrin in his book Beyond Greed and Fear. The previously held emotion may not have been terribly strong, but the subsequent experience can reinforce the emotion to the point where you think your premonition was just as strong. If you were making an investment in a commodity such as grain, and a grain investment that year turned out to be lousy because of weather, you may say after the fact that you should have known the weather would not be good for your investment. But no one can predict the weather for an entire growing season, especially when a single storm could negate an otherwise optimal growing season. We had a tremendous snowstorm here in Colorado a couple years ago that swept through in a hurry and delivered several feet of snow. The storm came in so quickly that many ranchers could not get out to their fields to retrieve their cattle and get them under shelter, which resulted in huge financial losses for the ranchers. Odds and chance also play a part in long-term investing.
Finally, there’s the part of number numbness called bigness bias. Think about the reference to inflation I covered a few paragraphs ago. During the late ’70s, inflation was easy to notice because it was in the double digits. From 1982–2000, it was almost impossible to notice because it was often at only 1% or 2% annually. Because investors simply saw the big stock returns during this 18-year-long bull market, they didn’t realize that inflation was actually taking a little bit of the purchasing power out of the dollars they were earning.8 To look at it another way, when something is incrementally small, such as 1% inflation or a 2% annual return on an investment, you tend to overlook it, as it falls into that opaque category we have discussed throughout the book. But small numbers add up to big numbers. For example, hypothetically, if you pay 4% for a loan when you could pay 3%, that 1% can add up to a big number and can make a big difference in one’s retirement plans over time.
Investor Errors of Miscalculation
Numbers are the essence of evaluating outcomes and opportunities in investing, involving time, rate of return, and magnitude of losses and gains. Unfortunately, when you involve more than a couple of variables, people often become confused and make the wrong decision. Our tendency to miscalculate can impact everyday decisions. Are you a basketball fan?
Down by Two, Seconds Remaining, What Play Do You Call?
Let’s say, for example, that in basketball, the odds of making any given two-point shot are about one in two, or 50%. The odds of making any given three-point shot are about one in three, or 33%. So, if you have the ball and just a few ticks left on the clock and your team is down by two points, what play do you call for your team? The vast majority of coaches call for a two-point play in hopes of tying the game and sending it into overtime. The odds of them winning with such a strategy are about one in four, or 25%. This is because victory is dependent upon two consecutive events: making the shot and then winning in overtime, both with 50/50 chances of happening.
Option A—Go for the Win
Shoot the three-point shot
Odds of making: 33%
Option B—Play for Overtime
Shoot the two-point shot
Odds of making: 50%
Win the game in overtime
Odds of winning: 50%
25% chance of tying game AND going on to win in overtime
Pure number crunchers would say the hands-down better play is to shoot the three because it provides an 8% higher chance of victory. Some basketball traditionalists, on the other hand, might argue that you try to extend the game by taking the easier two-point shot and then try to win in overtime. A coach is rarely criticized for following “prevailing wisdom” by going for the tie and overtime. But is it the right call?
It might be tempting to summarize this issue and conclude that the technical analysis tells you to take the three-point shot. Using this logic, one colleague of mine—a well-published behavioral economist—argued vehemently with me that this was the best course of action. However, he never played basketball and seemed to be missing an understanding that “averages” can delude very easily, and some other complex factors are involved in this scenario. For example
• Does your team have, or lack, exceptionally good three-point shooters (as compared to the average)?
• Is the other team particularly good (or poor) at defending the three-point shot?
• Are you playing in front of the home crowd or on the road?
• What’s the timeout situation?
When you consider all the factors that must be processed, interpreted, and used to make a split-second decision, it becomes clear why the guy two rows from the top of the arena does not get a vote in which play is called. It is precisely this complexity, and a coach’s ability to sort through the noise and make the decision that gives his team the win, that determines his success or failure, and ultimately his career.
When it comes to our financial playbook, the situation is eerily similar. We receive many inputs from number crunchers and behavioral experts alike. At the highest levels, we may understand the rules of thumb when it comes to how much we need to plan for retirement, and perhaps even how our personal biases tend to discourage the behaviors necessary for success. However, that understanding alone is overly simplistic and disregards a host of complex and intertwined variables. For example
• How much can you afford to take from your portfolio each year in retirement?
• Will you need to make adjustments to the income you take to account for inflation?
• How will changes in tax rates impact your retirement plans and what can you do to insulate yourself from uncertainty?
• How can you resist temptation to chase market performance and hide from market rallies?
• What options are available to capitalize on your beliefs of where the economy, markets, and tax rates are headed?
Fortunately, like the team owner who employs a highly qualified coach, you have the opportunity to work with a highly qualified adviser who can process the variety of inputs and help keep you on the right path to your financial goals. Let’s consider another example: taxi drivers.
A lot of taxi drivers make a serious monetary miscalculation when they quit working after attaining a given daily goal. For example, they might go home after they have earned $200. Predetermining the amount of money they intend to earn in a day is a benchmarking mistake, as each day presents different variables that can make it a good day or a bad day for a cab driver. The result is that they end up working much shorter hours on the very lucrative rainy days, when everyone is looking for a cab, and giving up the opportunity to earn much more money. Conversely, when a cabbie works much longer hours on sunny days when cabs are plentiful, he gives up the opportunity to do something that may be more profitable or enjoyable than trying to meet the $200 threshold he’s set for himself driving the cab. “Opportunity costs,” according to Daniel Kahneman, Amos Tversky and Richard Thaler, “typically receive much less weight than out-of-pocket costs.”9 It’s conceivable that if the cab driver were to maximize the opportunity to earn money when the weather was bad, he’d easily earn an average of $200 a day.
When investors try to calculate the returns on their portfolios, they often don’t bother to use calculators. Instead, they will eyeball the returns or rely on their memories. And when they do, they often make the wrong decisions.
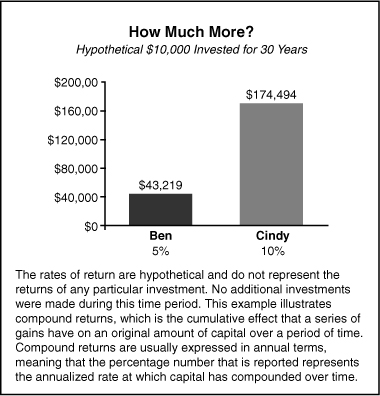
Consider this hypothetical example: Cindy and Ben both make a one-time investment of $10,000 and let it ride for 30 years. Cindy earns 10% on her money, and Ben earns 5%. How much more will Cindy earn over the 30 years than Ben does?
A. 5% more
B. Twice as much more
C. 30% more
D. Four times more
Many people quickly assume that Cindy’s investment will earn twice as much as Ben’s will. After all, 10% is twice as much as 5%. This error is particularly eye-opening because, when you look at the actual numbers, you can see that the answer is D—Cindy would actually earn over four times as much as Ben in 30 years (see Figure 8.1).
Figure 8.1 What difference does 5% really make?
The Most Numbing Number of All
We hear a lot about “our number” for retirement, the amount we need to comfortably retire. Truth is that nobody really knows what that number is. There are too many variables and complexities. As Americans live longer, the financial services industry is switching the emphasis of its messaging from accumulating assets to making existing assets last. Converting assets into income that can last for the rest of our lives is a complex process and involves a long list of issues, including longevity, inflation, liquidity, Social Security benefits, guarantees, market performance possibilities, and healthcare. A typical question is, “How much can I spend without running out of money?”
Unfortunately, the most common method among Boomers for determining the amount of money needed for retirement is...“guessing.” Few have tried to systematically figure out how much money they will need to accumulate by the time they retire. And not one person in our focus groups had a good sense of how much money they will need to have by the time they retire.
There are any number of ways that advisers calculate retirement income, including the Monte Carlo Simulation, which is a financial planning tool that is supposed to account for hundreds of thousands of potential market scenarios, guided by assumptions about inflation, volatility, and other parameters.10 But no formula can help you predict the future, including the Monte Carlo Simulation. There is no set percentage of a retirement nest egg that is proper if you don’t want to outlive your money. Every person’s situation (health, expenses, and desires) is different, but generally a 4% annual withdrawal is considered a reasonable amount. Although a 4% withdrawal rate doesn’t provide any guarantees, it is clear that rates above that level can significantly increase the risk of running out of money. Sound income planning is needed to achieve an income base that can cover essential expenses while providing access to other liquid assets to cover discretionary spending. According to a 2009 consumer study, after the Meltdown of 2008, Americans are now placing a premium on preserving principal, and 80% of those surveyed report they are now more concerned with guarantees and stability than they are with returns as they head toward retirement.11
Improve Your Retirementology IQ
When it comes to your financial plans for retirement, especially in a post-meltdown world, complexity is the order of the day. No longer can you simply find an investment that has a good track record, stuff your money in there, and call it a solid investment. On top of that, an equity investment worth a lot of money does not necessarily represent your retirement nest egg. Chances are that your house is worth more than it was when you bought it, in spite of the meltdown, and you may have other assets. To be ready to retire, however, you’re going to have to look at these assets in another way. Selling assets results in tax penalties, many of which can be avoided. A desire to leave something to your family or to a charity can be compromised by tax considerations as well. A major key to an enjoyable retirement is consistent income that pays for the things that are important to you. First step: Develop an income strategy.
Develop an Income Strategy
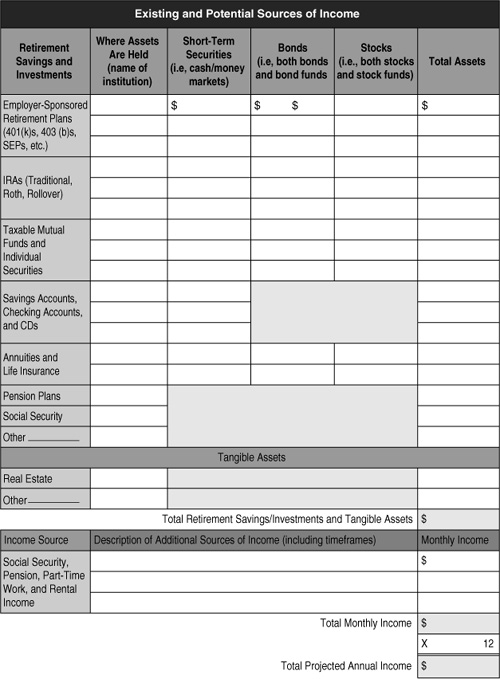
As Yogi Berra said, “When you come to the fork in the road, take it.” And as you rethink the complexity of retirement, you may be asking yourself, “I’ve come to the fork in the road. I’ve taken it. Where do I go from here?” Before you take a step in any direction, develop an income strategy. The questionnaire in Figure 8.2 identifies key areas that are specific to your needs and can help you anticipate and calculate retirement expenses.
Figure 8.2a Determining your retirement expenses.

Figure 8.2b Determining your sources of income.
Turn Piles into Flows
Accumulating assets is only the first part of retirement planning. The next, perhaps more important, step is to determine how to convert those assets into income that can last you the rest of your life. So how do you turn a pile of assets into a flow of income? Here are five steps to consider:
1. Identify the challenges you can’t control and those you can directly impact.
2. Learn the importance of a reasonable withdrawal rate.
3. Consider creating a plan that provides a lifetime stream of income.
4. Complete the previous profile questionnaire.
5. Work with a holistic adviser to custom design a portfolio suited to your needs.
Work with a Holistic Adviser
No one knows everything, whether the subject is as inconsequential as tiddlywinks or as important as retirement planning. However, a good adviser understands how to help you build a potential solution for retirement, and when you’re ready to retire, a holistic adviser understands this more complicated distribution phase. As you approach retirement, questions become very complex: How long will you have to work? How much will you need? How much will you need to fund your retirement? By using an advisory approach that focuses on financial solutions rather than on specific investment products, a holistic adviser can develop sound income strategies to help you through your retirement years.
YOUR ADVISER CAN HELP YOU WITH THE
EMOTIONS AND COMPLEXITY THAT MUDDY
THE RETIREMENT WATERS.
Endnotes
1 Producers Web.com, “Hartford survey finds that few understand retirement benefits,” September 10, 2009.
2 Congressional Budget Office, “Federal Budget Deficit Totals $1.4 Trillion in Fiscal Year 2009,” November 6, 2009.
3 The Wall Street Journal, “Taking the National Debt Seriously,” October 11, 2009.
4 Top 40-charts.com, “Disco Fever with the Bee Gees,” 2009.
5 Federal Reserve, “Bank Prime Loan Rate Changes: Historical Dates of Changes and Rates,” December 2008.
6 Federal Reserve, “Bank Prime Loan Rate Changes: Historical Dates of Changes and Rates,” December 2008.
7 Yahoo! Finance, Dow Jones Industrial Average (^DJI): Historical Prices, Dec. 25, 1981–Feb. 5, 1982 and Dec. 25, 1999–Feb. 5, 2000.
8 CNN Money, “Don’t Expect another bull market,” March 3, 2008.
9 Hersh Shefrin, Beyond Greed and Fear, Oxford University Press, 2000, p. 215.
10 The Wall Street Journal, “Odds-On Imperfection: Monte Carlo Simulation,” May 2, 2009.
11 MetLife, “The 2009 MetLife Study of the American Dream: Rebooting the American Dream. Shifted. Altered. Not Deleted.,” study conducted from January 7–16, 2009.