
What we're going to do here is look at the relative percentage of product categories that are sold in store and online. If you noticed we have an OnlineOrderFlag column in our dataset. A product is either sold in store or online.
To add data to the chart, click in the chart area to display the Chart Data dialog box.
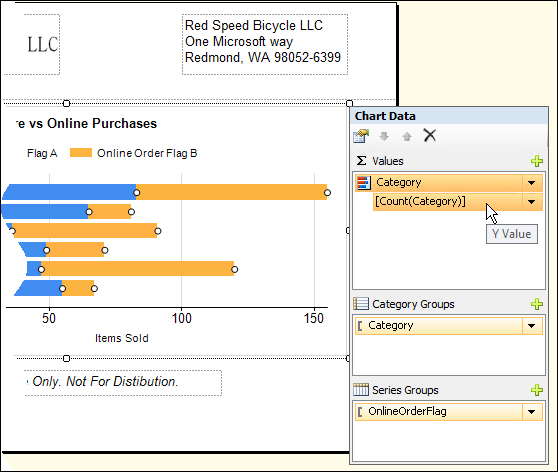
In the previous illustration, we put the Category field of our dataset as our chart data value. The value aggregate [Count(Category)] just below that indicates that we're doing a count operation on that field.
We can do other aggregate functions such as Average, Sum, Max, Min, and other aggregates. Choose any function according to your aggregate requirements.
We're using the OnlineOrderFlag as the series for this chart.
Let's preview our chart with the supplied data:
