
Lesson 5
Validating and Debugging Your Code
What You’ll Learn in This Lesson:
 How to validate your HTML and CSS
- How to use Developer Tools to debug HTML and CSS
- How to use the JavaScript Console to debug JavaScript
It doesn’t matter if you’re a beginner or a seasoned expert—bugs happen. Bugs are a fact of life for developers of all skill levels, and we would even venture to say that if your code doesn’t contain errors at some point during its creation, then you’re just not trying hard enough. So don’t worry about the bugs; just worry about identifying and fixing them before clients or customers experience their side effects.
In this lesson, you’ll learn about how to validate and debug your HTML and CSS as you develop it, as well as how to use some handy tools built directly into your web browser to identify and debug issues with your JavaScript.
Validating Your Web Content
In the first lesson of this series, I discussed ways to test the web pages you create; one very important way to test your pages is to validate them. Think of it this way: It’s one thing to design and draw a beautiful set of house plans, but it’s quite another for an architect to stamp it as a safe structure suitable for construction. Validating your web pages is a similar process; in this case, however, the architect is a web-based application, not a person.
In brief, validation is the process of testing your pages with a special application that searches for errors and makes sure the pages adhere to the current HTML and CSS standards. Validation is simple. In fact, the standards body responsible for developing web standards, the World Wide Web Consortium (W3C), offers an online validation tool you can use, at https://validator.w3.org. Figure 5.1 shows the options for using the W3C Markup Validation Service.
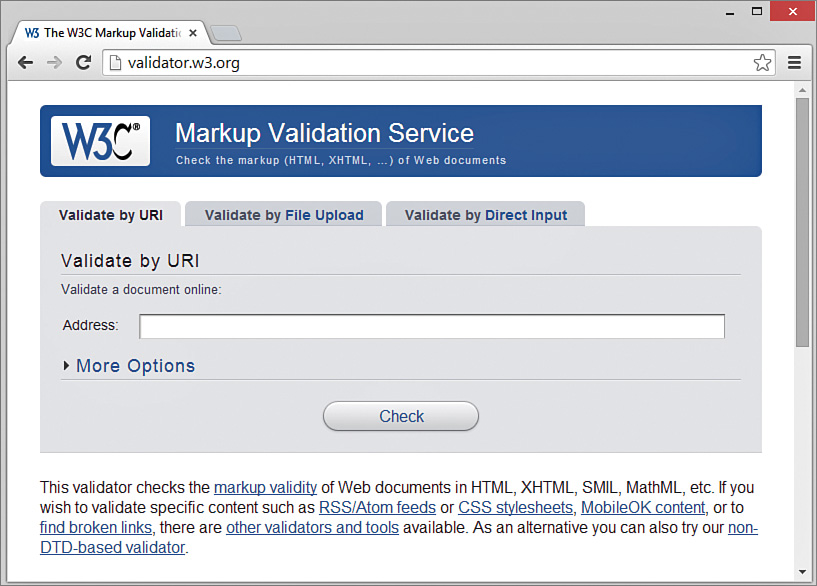
If you’ve already published a page online, you can use the Validate by URI tab. Use the Validate by File Upload tab to validate files stored on your local computer file system. The Validate by Direct Input tab enables you to paste the contents of a file from your text editor. If all goes well, your page will get a passing report, like the one shown in Figure 5.2, which validates a code listing from Lesson 2, “Structuring an HTML Document.”

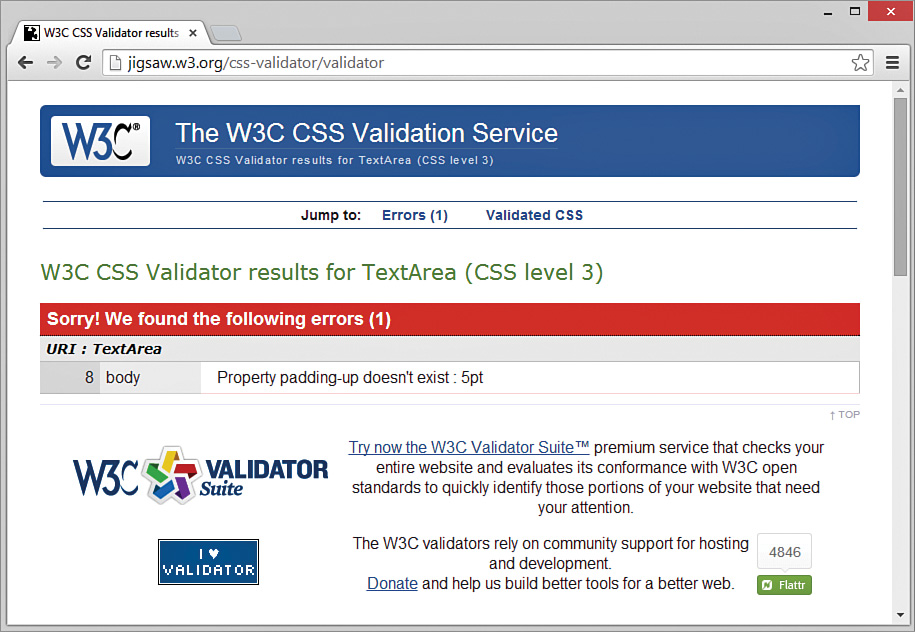
The W3C also provides a tool to validate CSS; visit https://jigsaw.w3.org/css-validator/ and enter a URL or upload a file using the options provided. If the W3C Markup or CSS Validation Service encounters an error, it provides specific details (including the line numbers of the offending code). Figure 5.3 shows an example of an error report; in this instance we have purposely used the CSS property padding-up—a property that does not exist—instead of padding-top.
Using basic validation services is a great way to hunt down problems and rid your HTML and CSS of invalid code, such as incorrectly named CSS properties and mismatched HTML tags. Validation not only informs you when your pages are constructed properly but also assists you in finding and fixing problems in the code before you publish pages for the world to see.
Debugging HTML and CSS Using Developer Tools
You can extend your debugging efforts beyond basic validation by using more advanced tools that are built into most major browsers. Figures 5.4, 5.5, and 5.6 show what some of the major browsers look like with Developer Tools turned on; in each figure you’ll notice some consistencies in the names and functionalities of certain tools.
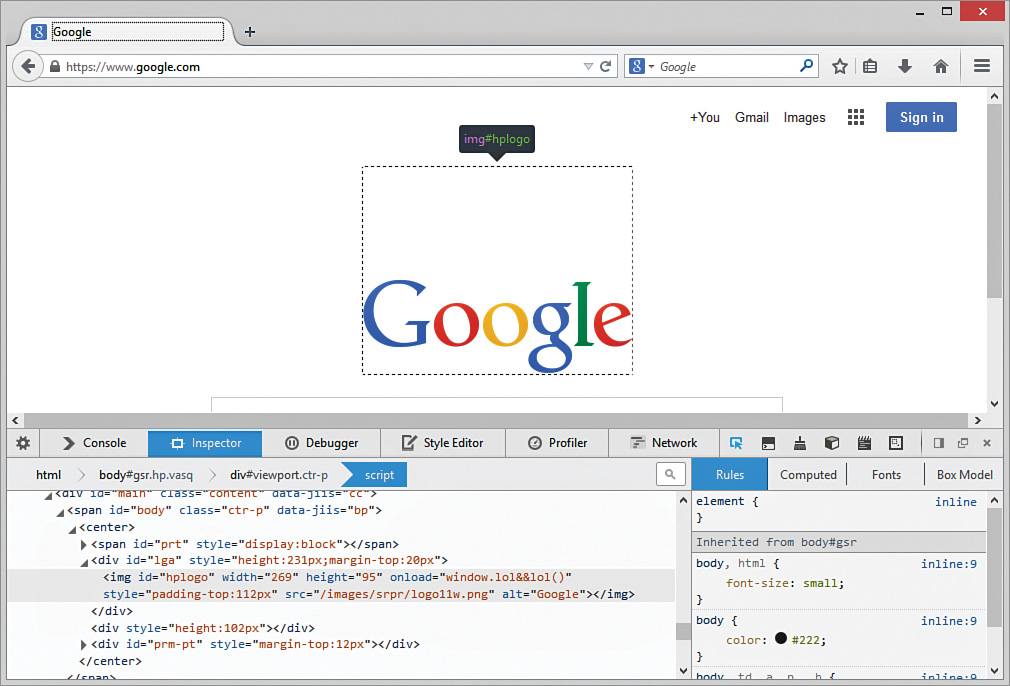
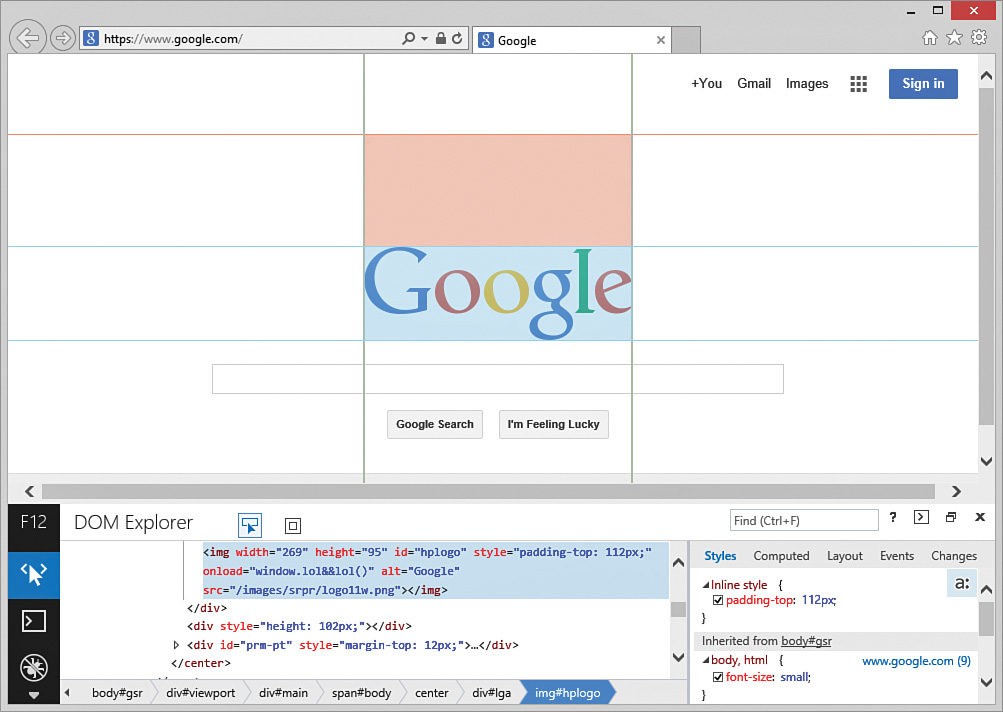
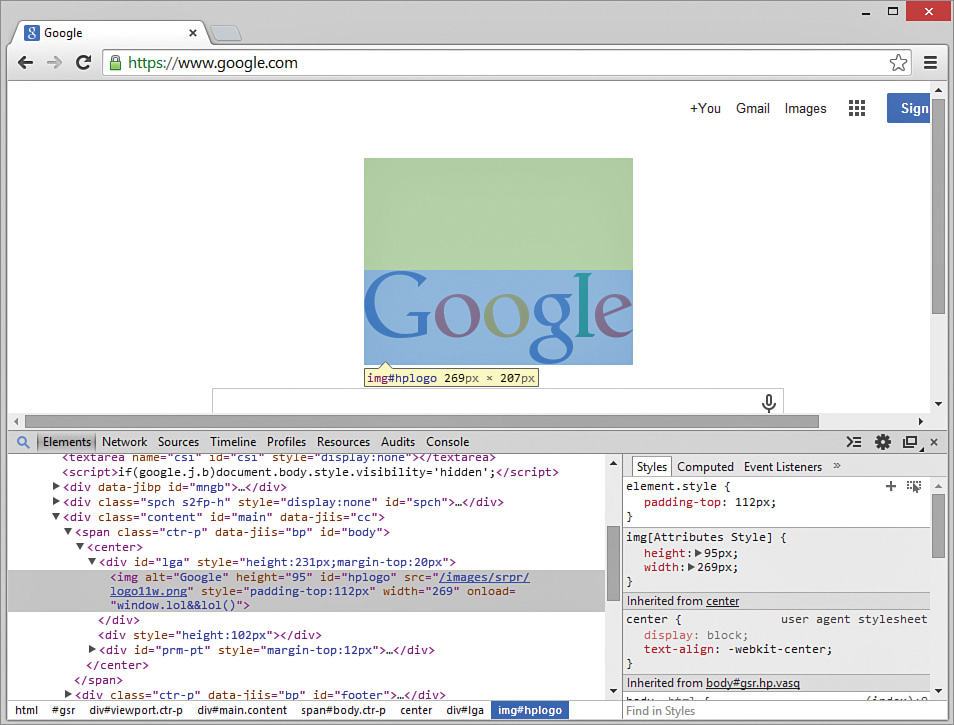
Although the examples we’ll go through in this section use the Chrome Developer Tools, you can see similarities in all the Developer Tools shown previously (and in other browsers, such as Safari). In this specific case, the ability to inspect an element is present in all three sets of tools. When you are selecting an element on the screen with your mouse, the additional window panels in Developer Tools show the exact HTML used to render that element, as well as the style rules currently applied to that element.
This functionality of the inspector is quite useful because it provides a visual way to see the relationship between the node in the DOM tree and the rendered web page; in addition, note the use of breadcrumbs in each set of tools, which shows the hierarchy of nodes from the root html node down to the img node (with the ID value of #hplogo). This use of breadcrumbs serves to further assist your understanding of where a rendered visual element appears within the DOM (and not just on your screen).
The next few sections take you through some practical applications of using these tools.
Debugging HTML Using the Inspector
To illustrate how to use the inspector to debug HTML, consider the code in Listing 5.1, which is just a basic HTML document containing a list of movies, where the word “Favorite” in the heading is supposed to be italic. However, if you look at the rendered version in Figure 5.7, you’ll see some problems: Everything is italic, and there is no bullet in front of the first list item. These problems are caused by just two characters in all the text.
Listing 5.1 A Simple HTML Document with Some HTML Syntax Errors Illustrated in Figure 5.7

<!doctype html>
<html lang="en">
<head>
<meta charset="utf-8">
<title>Favorite Movies</title>
</head>
<body>
<h1><i>Favorite<i> Movies</h1>
<ul>
<ll>Lord of the Rings</li>
<li>Harry Potter</li>
<li>Narnia</li>
<li>Hot Lead and Cold Feet</li>
</ul>
</body>
</html>
Follow along with these steps to find and fix the HTML syntax problems using the inspector in Developer Tools:
Add the code in Listing 5.1 to a new file, save the document, and then open it in your favorite modern browser (Chrome, Firefox, Safari, or Edge). You can keep the document on your local machine or put it on your web server; it doesn’t matter for this example, as long as you can open the file in your web browser.
Right-click the screen and choose Inspect Element. You should see something like what’s shown in Figure 5.8, with the Elements tab preselected.
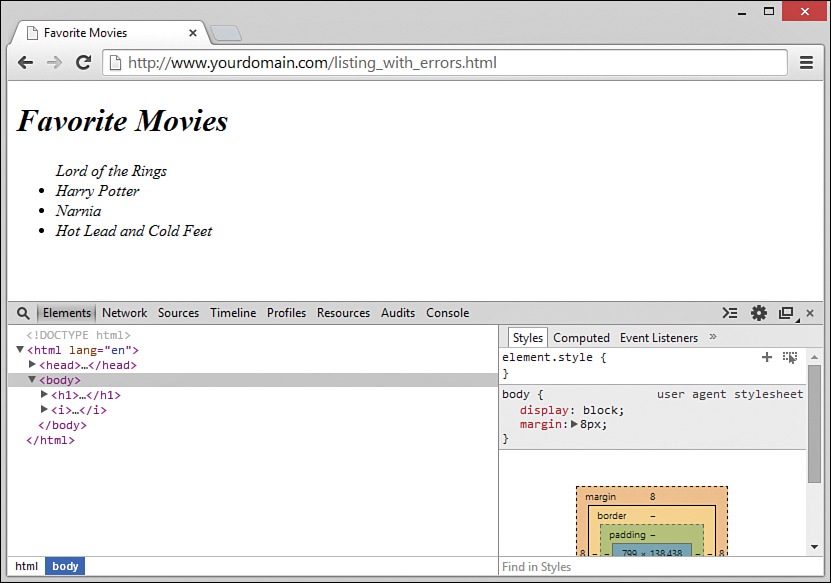
Figure 5.8 The Elements tab is selected by default. Click on the arrows in the Elements panel to expand the
<h1>tag, as shown in Figure 5.9. Notice there’s an<i>element under the<h1>element, and there is also another<i></i>tag pair. That isn’t right: You remember (and can see in your source file) that you didn’t put<i>elements all over your code, so why do they appear? Well, if you look closely at the Elements panel and then the source code, you will notice that there is a missing/that would make the second instance of the<i>tag the closing</i>tag that you want. This means the browser is rendering (and the inspector is showing) what appear to be<i></i>elements around every single element in your code because the first<i>element was never closed; the rendering engine is interpreting that all of these phantom<i>elements are present.
Figure 5.9 This HTML inspector shows more <i>elements in the DOM than are in your source code.In your source file, change the second
<i>tag to a closing</i>tag and save the document. Put it on your web server if that’s where you originally placed it.Refresh the document in the browser. Notice that, as shown in Figure 5.10, the word “Favorite” is now italic, as it should be, and all the phantom
<i>elements are gone from the inspector; however, the bullet point is still missing from the first list item in the browser’s display.
Figure 5.10 This web page now has only one problem: no bullet point on the first list item. Go back to the Elements panel and expand the
<ul>element and then the<ll>, as shown in Figure 5.11. Notice that instead of a set of four appropriately opened and closed<li>elements under the<ul>element, there is an open<ll>tag followed by three<li>elements within it, and then a closing</li>tag. Although we haven’t covered the HTML list item tags yet (we do that in the next lesson), you can probably deduce that because the three lines with opening and closing<li>tags show bullets, and in the source code the<ll>element is closed by an</li>tag, the opening tag should be an<li>tag.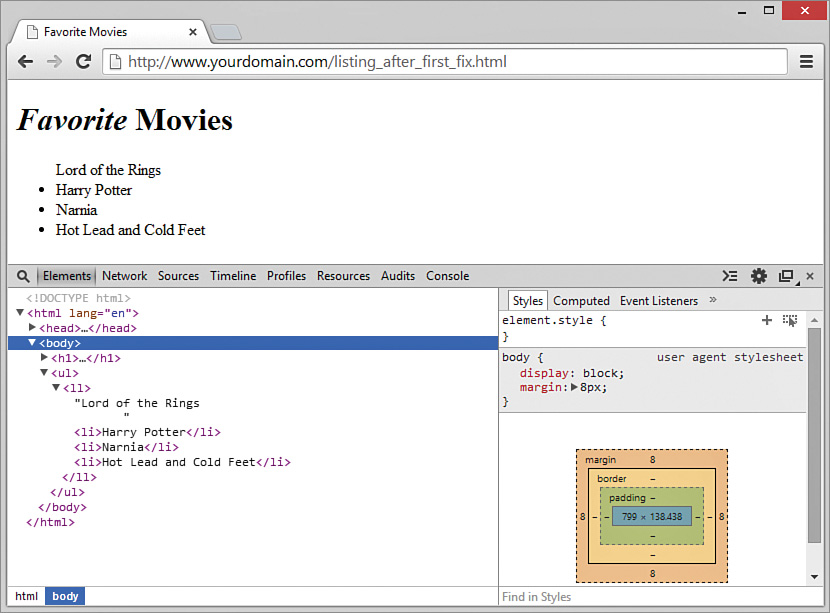
Figure 5.11 Viewing the DOM reveals that the browser sees an <ll>tag under the<ul>tag, not a set of<li>tags.In your source file, change the
<ll>tag to a<li>tag and save the document. Put it on your web server if that’s where you originally placed it.Reload the web page in the browser. It is now displayed properly, as shown in Figure 5.12.

Although going through all the steps as you just did shows you some ways in which the inspector can be used to help spot issues, you might wonder just how much more efficient and helpful that process actually is compared to just using a validator. After all, the issues seen earlier were purely validation errors and would have easily been caught by using the W3C Validator you learned about previously. Figure 5.13 shows some of the validation errors present in the original listing.

Note
When you use a validator, it’s best to review the problems in the order in which they appear. Often, fixing one error will cause a lot of the following errors listed to disappear. For example, fixing the first “Unclosed element i” error in Figure 5.13 will fix the second one as well. It will also fix the “End tag h1 seen…” error. It is often a good idea to fix one error and revalidate to see what happens.
It’s true that a validator will more quickly identify pure syntax issues and that using the inspector requires you to have the knowledge and experience to see the issue straightaway if it’s presented in a different context rather than the raw source code. We recommend that beginners run their code through a validator first, but seeing alternative views of the DOM rendering is quite useful for an ongoing learning process.
Debugging CSS Using the Inspector
Everything you just learned about debugging HTML with the inspector is also true when it comes to CSS: You can use Developer Tools to uncover issues with style definitions and inheritance. These built-in tools become especially useful when you are working with more advanced development, such as when you are using JavaScript to modify the CSS of particular elements beyond their original state in the source code, but they can still be useful in the beginning stages of your development.
The steps in this section go through a brief example of using the inspector when working with CSS—specifically, some ill-formed yet valid CSS, as shown in Listing 5.2. Although you’re encountering this lesson (and therefore these examples) very early in your development process, we are quite certain that within a few lessons, you’ll remember the steps you’ve learned here and will be using Developer Tools to enhance your debugging and development throughout the rest of the course.
Listing 5.2 Valid HTML and CSS That Doesn’t Display Nicely
<!doctype html>
<html lang="en">
<head>
<meta charset="utf-8">
<style>
#container {
margin: 30px;
padding: 5px;
width: 300px;
}
#tabs {
padding: 0px;
width: 50px;
}
#content {
border: 1px solid #000000;
height: 100px;
width: 300px;
clear: both;
}
span {
margin: 5px;
width: 100px;
background-color: #C0C0C0;
font-weight: bold;
border-color: #C0C0C0;
border: 1px solid #000000;
border-radius: 5px 5px 0px 0px;
padding: 3px;
float: left;
text-align: center;
}
span:hover {
background-color: #3030FF;
color: #FFFFFF;
cursor: pointer;
}
p {
font-weight: bold;
text-align: center;
}
</style>
<title>Sample Page</title>
</head>
<body>
<div id="container">
<div id="tabs">
<span>Name/Title</span>
<span>Contact Info</span>
<span>Biography</span>
</div>
<div id="content">
<p>Jimbo Jones</p>
<p>Rabble-Rouser</p>
</div>
</div>
</body>
</html>
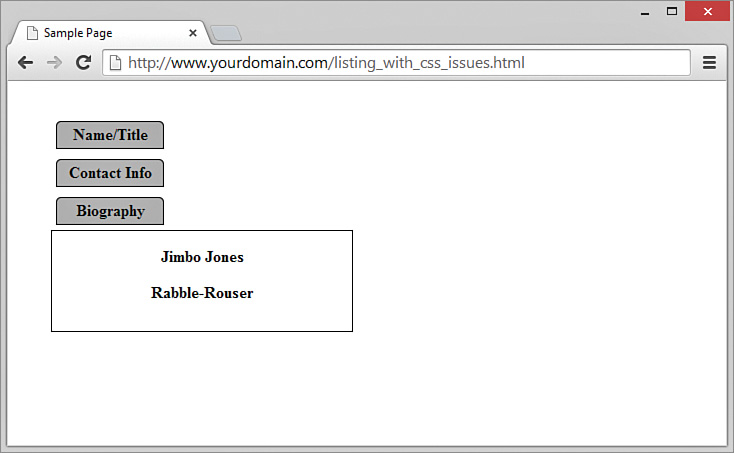
If you run this HTML and CSS through a validator, it will produce no errors because it is valid HTML and CSS. However, as you can see in Figure 5.14, it’s just not right. The tabs are supposed to align across the top of the box that contains text. If we could get past this initial layout issue, a user would be able to click on the tabs, and the contents in the box would change. But we can’t move forward and make that happen until this initial display works as we intend it to work. This is a classic example of a debugging problem in HTML and CSS—it’s not wrong (invalid), but it just isn’t right (displaying the way we want it to).
Follow along with these steps to uncover and fix some of the issues using the inspector:
Add the code in Listing 5.2 to a new file, save the document, and then open it in your web browser. You can keep the document on your local machine or put it on your web server; it doesn’t matter for this example, as long as you can open the file in your web browser.
Right-click the page and choose Inspect Element to open Developer Tools.
Click on the arrows in the Elements panel to expand the
<div>element with the ID"container"and then the<div>element with the ID"tabs". Click on the<div>element with the ID"tabs"so that it is highlighted on your screen, as shown in Figure 5.15. The width of this particular<div>will be shown; in this case, it is 50 pixels wide. This should lead you to wonder if the width of this particular<div>, which is less than the width of any of the<span>elements within it (click on one to see that they are 100 pixels wide)—let alone all three of them—is causing an issue with your layout.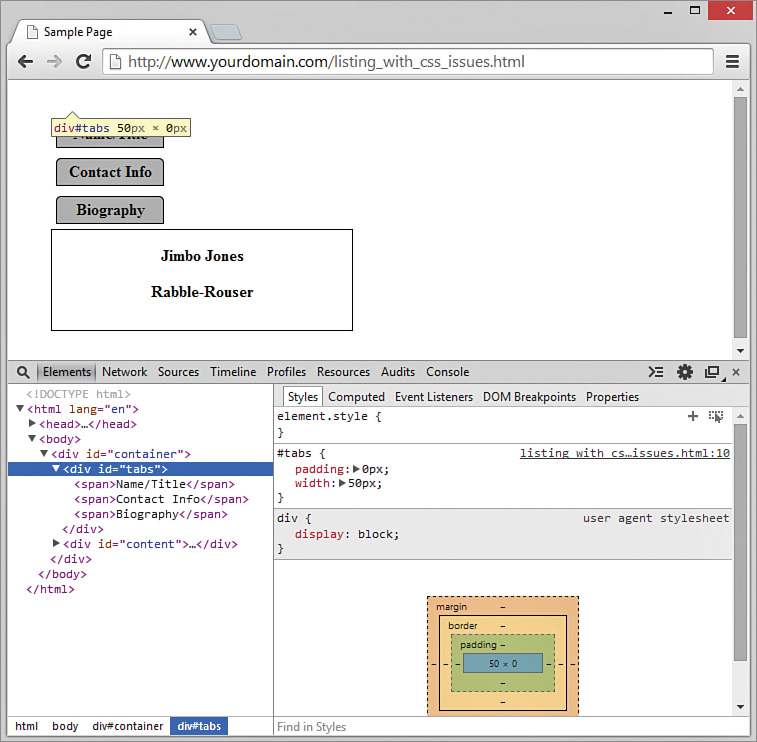
Figure 5.15 The selected <div>element is only 50 pixels wide.Following your instincts from the preceding step, click on the
<div>element with the ID"container"so that it is highlighted on your screen and so that the style is given focus in the style panel. Note that the width of this particular<div>element is 300 pixels.In the Elements panel, again click on the
<div>element with the ID"tabs"so that its styles are in focus in the style panel. Within the style panel, double-click on thewidthvalue so that the field becomes editable and change that value to be300px, as shown in Figure 5.16.

Without making any changes to the underlying source code, either locally or on your web server, you can use the inspector as a sort of editor to review possible changes to HTML and CSS. Although the code in this example is still far from looking “good,” you can continue to make changes on your own and see how the display reacts. You might have better results after working through later lessons, but even without detailed knowledge of alignment, margins, and padding, you can experience a sort of trial-and-error debugging without having to commit changes in your code.
Note
You can use the inspector within Developer Tools for more than just your own code. You can turn on Developer Tools and look at the source code of any page and get a sense of how the page is constructed—and you can change HTML and CSS values to see how these changes affect the display, just as you did here.
Are you wondering why the three 100-pixel-wide tabs don’t fit in a 300-pixel-wide container? It has to do with the CSS box model. You’ll learn more about that in Lesson 10, “Understanding the CSS Box Model and Positioning.”
Debugging JavaScript Using Developer Tools
Developer Tools within most major browsers can help you debug your JavaScript, from catching basic syntax errors in the Console to working through advanced debugging steps using the Sources panel and all that it contains. As we go through the tools in this section, we’ll use the code in Listing 5.3.
Listing 5.3 A Simple HTML Document with a Few Different JavaScript Errors
<!doctype html>
<html lang="en">
<head>
<meta charset="utf-8">
<title>Sample Page</title>
<script src="http://code.jquery.com/jquery-latest.min.js"></script>
<script>
function incCount(){
var count = 0;
count += 1;
return count;
}
function countIt(){
$("#counter").html(incCount);
}
</script>
<style>
button {
background-color: #0066AA;
color: #FFFFFF;
font-weight: bold;
border: 2px solid, #C0C0C0;
width: 100px;
}
</style>
</head>
<body>
<button onclick="countit()">Click Me</button>
<div id="counter"></div>
</body>
</html>
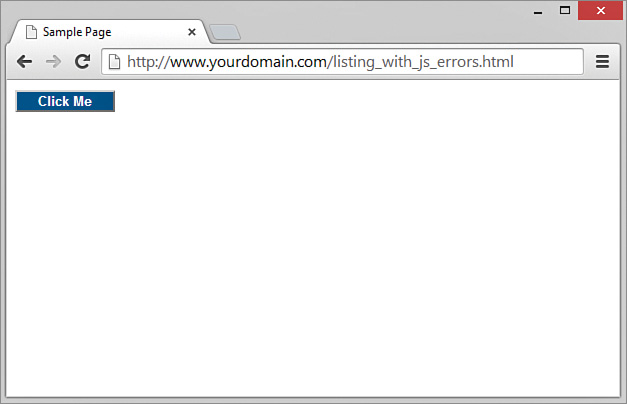
If you add the code in Listing 5.3 to a new file, save the document, and then open it in a web browser from either your local machine or your server, you’ll see the completely unassuming little button shown in Figure 5.17.
However, if you follow along with these steps, you’ll soon uncover issues with this code by using the Console:
Right-click on the web page and choose Inspect Element.
Switch to the Console panel by clicking the Console tab in Developer Tools.
Click the Click Me button that has been rendered by the browser. You should see an error like the one shown in Figure 5.18, which indicates there is an error in the code.
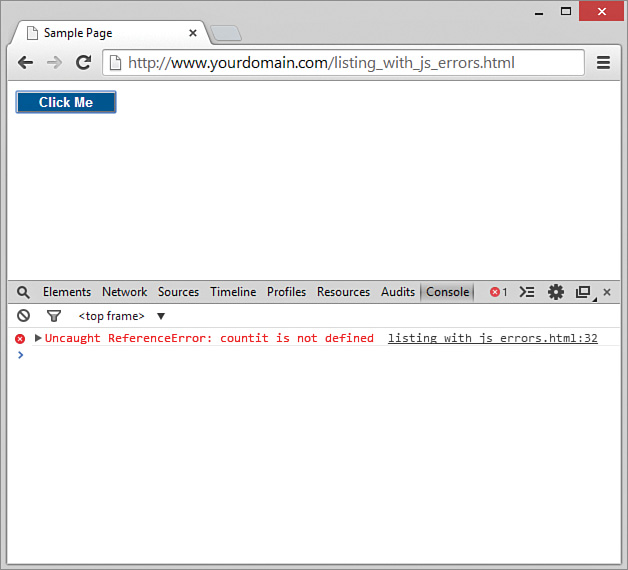
Figure 5.18 The Console shows where there is a syntax error in the code. Click on the link that will take you to the precise line in the file that contains the error (in this instance, the link is
listing_with_js_errors.html:32), and you see that the JavaScript function being called iscountit(), whereas the function was originally defined in line 15 ascountIt(). As you learned in the preceding lesson, JavaScript is case sensitive.
If you correct the underlying source file by using countIt() in line 32 instead of countit() and then reload the document and click the Click Me button, you will no longer see an error in the Console. However, as you’ll soon see, there are more issues with this document.
In the <head> section of the document is a link to a JavaScript library (jQuery, actually) that is stored externally, as well as some JavaScript code that defines two functions. The <body> section includes a <button> tag with an onclick event to invoke the countIt() JavaScript function, as well as a <div> element that is used to display the string containing the current count of the number of times the button has been clicked. That’s all fine and dandy, except that if you actually click the Click Me button more than once, the number will not increase past 1, and no error will be present in the Console. This situation calls for more advanced debugging.
Note
Always do more than one test on your web pages. In the JavaScript in Listing 5.3, fixing the first error makes the page appear to work. But if you click the button only one time, you’ll never realize that there is a problem on subsequent clicks. Whenever you deal with interaction on your web pages, you should test at least three times in each browser/device on which you want your pages to work.
Taking a Closer Look at the Sources Panel
The Sources panel (Debug panel in Firefox and Debugger in Safari) contains a set of tools that enable you to pause, resume, and step through code that is loaded in the web browser. By setting breakpoints, you can watch individual sections of your code execute, which is especially helpful when you are trying to track down issues that are unrelated to basic syntax (which the Console will helpfully display without intervention on your part).
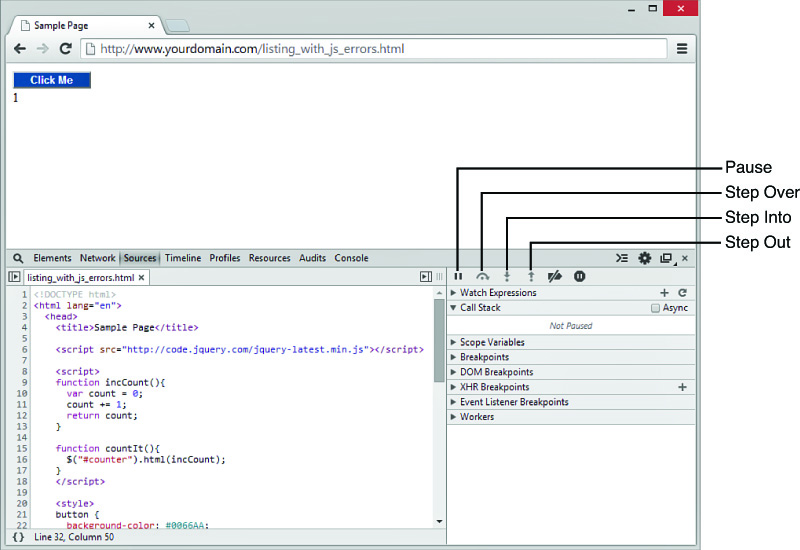
With the code in Listing 5.3 loaded into your browser and Developer Tools enabled, click on the Sources tab to see the Sources panel and its related tools. It should look something like what’s shown in Figure 5.19.
Note
For a thorough understanding of all the icons in the Sources panel, see https://developers.google.com/web/tools/chrome-devtools/. There are similar pages for Firefox (https://developer.mozilla.org/en-US/docs/Tools/Debugger), Safari (https://developer.apple.com/safari/tools/), and Edge (https://docs.microsoft.com/en-us/microsoft-edge/devtools-guide/debugger).
To debug the script, we’ll focus on setting breakpoints and stepping through the code using the tools highlighted in Figure 5.19. But first, some explanations of terms:
- Breakpoints—Breakpoints enable you to specify where you would like to stop the JavaScript from executing. When you set a breakpoint, the browser stops executing and breaks into the debugger before it executes that line of code. This enables you to see the state of the code at that specific point. You set a breakpoint by clicking on a line number in the code listing, and you remove a breakpoint by clicking the line number again; breakpoints are indicated by a highlighted blue arrow icon. The Breakpoints tab shows a list of breakpoints that have been set. You can disable a breakpoint by unchecking the check box next to it.
- Step Over—When you click the Step Over icon, the code advances one line. If the line of code is to execute another function, that function is executed, and you are taken to the next line of code in the current function. If a breakpoint is encountered when stepping over a function, the browser stops executing at that location in the script.
- Step Into—When you click the Step Into icon, the code advances one line. If the line of code is to execute another function, you are taken to the first line of code in that function.
- Step Out—When you click the Step Out icon, the current function finishes executing, and you are taken to the next line of code in the calling function.
Now, let’s start debugging the script in Listing 5.3 and see why it won’t advance the count past 1:
Set a breakpoint on line 10 by clicking to the left of the line number. A blue arrow should appear, as shown in Figure 5.20. Also note that the Scope Variables section of the rightmost pane is open. We’ve opened this so we can watch how the value of
countchanges as the script moves forward. After all, it’s this value that is the problem, since it’s not changing after the first click.
Figure 5.20 A breakpoint is set on line 10 of the script. Now click the button on the web page. You should see a yellow arrow appear in the body of the web page, indicating that the script is paused in the debugger, and line 10 in the code listing will be highlighted. In the script, line 11 is the first line of the
incCount()function; theincCount()function is supposed to determine the value of the counter string, represented by the variablecount. In the Scope Variables area, you should see that the value ofcountis currently undefined.Click the Step Over icon. In the Scope Variables area, you should see the value of
countgo to0because the value has been defined with a starting number of0.Click the Step Over icon again. Now the value of
countis1, as expected, changed by thecount += 1;line, which says “take the current value ofcountand increment it by one.”Click the Step Out icon four times to step out of this function and the jQuery functions in between. Notice that the value on the web page has gone to
1.Click the Continue or Resume icon (the Pause icon will change to a Continue icon or Resume in Firefox as soon as the script is started) to allow the script to complete. So far, so good.
Click the button in the web page again. The debugger should activate again and be stopped in the same location as in step 2. Notice that the value of
countis undefined again, when common sense (but not our code) says it should be1.Click the Step Over icon;
countchanges to0. Click Step Over again, andcountchanges to1. As the button is clicked,countis reset to undefined, set to0, and then incremented to1. This is not the desired behavior.To fix the problem, return to the source code and switch lines 10 and 11 so that the definition of
counthappens before the definition of the function that uses it (incCount()). This change defines the variablecountand sets the value only once when the script is loaded and before the function is defined.
If you load the newly debugged file, you’ll find that the counter increments as expected. You may need to remove the breakpoint if it isn’t removed automatically. Listing 5.4 shows the corrected JavaScript.
Listing 5.4 Corrected Script
var count = 0;
function incCount(){
count += 1;
return count;
}
function countIt(){
$("#counter").html(incCount);
}
This section has provided a basic example that is simple enough to easily follow and that helps you get used to how the debugger works. Keep in mind these basic steps to set breakpoints and watch the variables as you step through the code.
Summary
In this lesson you learned various ways to validate and debug issues in your HTML, CSS, and JavaScript. You learned how to use the inspector within Developer Tools in your browser to see the HTML elements and CSS styles and properties that the browser has rendered while loading a web page. In addition, you learned the basics of reviewing JavaScript syntax errors in the Console and setting breakpoints and systematically stepping through the code to debug more complex problems.
The methods you learned in this lesson will be very helpful to you as you finish this course, not to mention in future projects, because they will save a lot of time and frustration with simple validation and syntax errors that always seem to creep into code, no matter how experienced you are.
Q&A
Q. I’ve seen web pages that don’t have a <!doctype> tag at the beginning, yet they look just fine. How is that possible?
A. Many web browsers forgive you if you forget to include the <!doctype> tag and display the page anyway by using their best guess as to which standard to follow. However, it’s a good idea to include a proper <!doctype> tag not only because you want your pages to be bona fide valid HTML pages that conform to the latest web standards but also because if you don’t, and the browser applies a default standard that doesn’t include the tags you’ve used in the code, the display will look incorrect.
Q. Developer Tools seems really rich. What else can I debug with these tools?
A. You’re right: There are a lot of elements of Developer Tools in Chrome that aren’t covered here, and there are also many idiosyncrasies of the other major browsers’ implementations of Developer Tools. In general, you can use Developer Tools to debug values stored in cookies, the status of external resources used by your script (whether they are found/not found, whether they are slow to load, and so on), and the amount of memory used by the page and its scripts, among other things.
Workshop
The Workshop contains quiz questions and exercises to help you solidify your understanding of the material covered.
Quiz
1. Using Chrome Developer Tools, how would you find the current value of the background-color CSS property for a specific <div> tag in a document?
2. Using a debugger, how do you stop code execution on a specific line of code?
3. Which section of Chrome Developer Tools enables you to see the value of a variable as a script is stepped through?
4. What web languages can you validate with a W3C validator?
5. What browsers have Developer Tools?
6. What is a way to debug broken HTML code?
7. When is using the Developer Tools inspector particularly useful?
8. What happens when you change a style value (or add a style rule) in the CSS inspector?
9. What does the Step Over command do in a web page debugger?
10. How do you set a breakpoint in Developer Tools?
Note
Just a reminder for those of you reading these words in the print or e-book edition of this book: If you go to www.informit.com/register and register this book (using ISBN 9780672338083), you can receive free access to an online Web Edition that not only contains the complete text of this book but also features an interactive version of this quiz.
Answers
1. Click on the Elements tab to open the Elements panel and then select the specific <div> you’re interested in. The current style values will appear in the rightmost panel.
2. You can stop script execution on a particular line by setting a breakpoint. This is true with most debugging tools and is not specific to Chrome Developer Tools.
3. The Scope Variables section of the Sources panel enables you to see the values of variables used in a script.
4. This lesson mentions an HTML validator and a CSS validator from the W3C. The W3C also offers other validation services, such as link checking, RSS and Atom feed checking, and even mobile content checking.
5. Nearly every modern desktop browser has some form of Developer Tools built in. This lesson mentions tools in Chrome, Firefox, Safari, and Internet Explorer. There are also developer tools in Edge and Opera.
6. You can use an HTML validator to find the error or use Developer Tools in a browser to view the code. Or you can go through your HTML line-by-line.
7. The inspector in Developer Tools is particularly useful when you’re working with JavaScript that modifies CSS beyond the original state in the HTML.
8. The web page will change to reflect the new CSS rule, but that rule will not be applied outside the current page. If you do not add the changes to the CSS file, they will not be applied permanently to the web page.
9. The Step Over command advances the JavaScript code one line.
10. To set a breakpoint, click on the line number where you want the breakpoint. A blue arrow then appears on that line and sets the breakpoint. To turn it off, click the line number again. To disable it temporarily, uncheck the check box next to the breakpoint in the Breakpoints tab.
Exercises
 Continue debugging Listing 5.2 until the elements line up in ways that look appealing to you. Since you haven’t explicitly learned these skills yet, we’ll give you a hint: Try modifying values for widths and values for padding in the CSS.
- Use Console logging to output specific strings at different points throughout your script. You can log to the Console by inserting code like the following in your JavaScript and then review these strings in the Console panel as the script executes:
console.log("Some string.");