
Logging is a challenge for two reasons: volume and aggregation. Let’s take a large website as an example. In Chapter 6, “Static Content Serving for Speed and Glory,” we had a goal to serve 11,750 requests per second at 70% capacity. To handle 11,750 requests per second at 70% we need an actual capacity of 16,786 requests per second, so we will round up and assume that our logging system must handle journaling and analyzing 17,000 log lines per second. Although this is peak traffic during our peak time (constituting 15% of the day’s traffic), this still winds up being 360 million log events per day. That is quite a few log messages to write. Additionally, no single source is generating these events; they are streaming in from at least 20 different web servers.
If you compare the logs from your web server, database server, switch, workstation, and even your mobile phone, you will find one thing in common: time stamps. Every logging event occurred at a particular point in time, and knowing when it occurred is fundamental to its usefulness. This may seem obvious, but the importance of it is multi-faceted, and the classic “solution” to the problem may not be sufficient to solve the larger problem at hand.
Knowing when a logging event occurred allows us to quantize information for general consumption. A typical example of this is a report detailing the quantity of web request services broken out by HTTP code on 1-hour intervals, 30-minute intervals, and 5-minute intervals. This type of report is common because it is useful for determining overall traffic trends. Although this type of reporting requires all log events to have time stamps, the relative accuracy of those time stamps does not affect the outcome of the report. In other words, a time skew of 5, 10, or even 30 seconds across the web servers would not dramatically skew the results of such a report where the time granularity of the report is significantly larger than the time skew on machines.
Let’s look at a misconfiguration in this situation. Perhaps a single machine is not configured to observe daylight savings time, but the others are. This would clearly damage the report, but how much? From a signal analysis perspective it would be as if the signal had 5% loss and an echo with one-hour latency with around 5.3% signal strength. This type of mild signal “damage” is easy for a human to tune out and otherwise compensate for. It does not give a perfect representation of what is going on at any given time, but the ability to understand overall trends is not compromised.
This may lead us to believe that, although time stamps are crucial, their accuracy is highly overrated. This might be true in the specific case of quantized reports; however, there are other uses for log events where the relative accuracy of time stamps is paramount—enter the land of distributed system troubleshooting.
By definition, troubleshooting occurs only when there is trouble. Trouble in a deterministic system is simple cause and effect. The cause is your problem, and the effect is the trouble. On a single system, troubleshooting is at its most basic. You are looking for an event on the system that induced failure directly or destabilized the environment in a fashion that allowed a failure to be noticed. All the components playing a part are running on a single system, with a single clock, and thus all logs generated are written “in order” and allude to a cause and effect stream of occurrences.
Because this book is all about scalable systems, we don’t deal much with how to solve problems that involve a single machine. When troubleshooting problems whose ill effects are the product of a set of actions that occur across a cluster of machines, we have a troubleshooting environment that is far from “basic.”
For example, let’s look at a flow through our website that results in the purchase of a paid service subscription. If we are alerted to the fact that the arrival-to-conversion rate has dropped by some non-nominal amount, we must look for a cause for that effect. To effectively troubleshoot this problem, we must have a view into each purchasing “session” and all the events that happen during that session. We must have them all in the order they occurred to be relevant to our troubleshooting task. In this situation, it is imperative that we log all events that happen—clusterwide—in an order that represents their relative transactional timing. In other words, events that comprise a “transaction” must be logged in the order they were executed. This is a difficult problem.
Before we discuss a powerful solution that provides the underlying mechanics to solve the previously proposed problems, we will visit a few of the traditional logging approaches. We will discuss their strong and weak points, and attempt to demonstrate their inadequacies in large mission-critical environments.
Perhaps the oldest trick in the book when managing the logging of a multinode cluster is the simple aggregation of their local logs.
This configuration of log storage and eventual aggregation (shown in Figure 9.1) is probably the most commonly deployed architecture. In this configuration, web servers (or other log-producing application servers) write their logs to disk in a standard way. Periodically, a dedicated log management server connects to each log-producing server and “pulls” the logs. This typically happens on multihour or daily intervals. Although this configuration is simple and well tested, it leaves a bit to be desired.

The first major problem is that when a server crashes, we possibly could have a large segment of logs (those journaled between the last fetch and the time of the crash) that are unavailable for analysis and incorporation. When the server returns to service, a decision must be made to dispose of the logs, archive the logs, or even go so far as pull the logs and retroactively incorporate the data found into the statistics for the time period in question. This has serious implications because the data is important and by incorporating it into historic data, previously calculated statistics and summarizations will be altered. It isn’t intuitive (and I argue it is entirely unacceptable) to have statistics for a past period of time change.
Another serious shortcoming of this methodology is the lack of real-time exposure to the data. It is impossible to do passive, real-time analysis on logs because the aggregated data on which you can perform analysis is stale (and possibly incomplete). Real-time analysis is often not considered in architectures because the configuration simply does not afford the opportunity to perform it. As we will see later, real-time access to log data can offer tremendous benefits to systems engineering tasks, as well as enhance business knowledge.
The main disadvantages of batch aggregation revolve around the fact that there is significant latency. This can be addressed simply by pushing logs from the web servers in real-time. One such “push” implementation is logging via Syslog.
If you reconfigure your applications to write logs by the Syslog API, you can configure Syslog to use a foreign log host. In this configuration (shown in Figure 9.2), logs are effectively written in real-time to the log aggregation host.

One serious shortcoming of a naive Syslog implementation is that Syslog uses UDP as a transport protocol. UDP is unreliable, and logging should be reliable—so we have a fundamental mismatch. Conveniently, logging in real-time in unicast is a paradigm not tied to a specific implementation. Syslog-NG is a Syslog replacement that will use TCP to reliably log to a remote log host. mod_log_mysql is an Apache module that will insert Apache logs directly into a MySQL database. Both of these approaches follow this basic paradigm.
This technique eliminates the major disadvantage of periodic aggregation. We can now look at the log files on our aggregation host and watch them grow in real-time. This also means that by processing the new data added to log files, we can calculate real-time metrics and monitor for anomalies—this is powerful!
Additionally, if we want to add a second logging host for redundancy, it will require reconfiguration of each log publishing server—because it is a “push” technology, the servers must know where to push. This is a legitimate approach, but because more advanced and flexible techniques exist, we won’t dig into implementing this.
Due to the inherent difficulty of configuring both batch aggregation and push-style uni-cast aggregation, the concept of passive sniffing aggregation was conceived. Using this approach, we “monitor” the network to see what web traffic (or other protocol) is actually transiting, and we manufacture logs based on what we see. This technique compensates for needing to reconfigure web servers when the logging host changes and allows for a secondary failover instance to be run with no significant modification of network topology or reconfiguration of servers.
The beauty of this implementation is that you will manufacture logs for all the traffic you see, not just what hits the web servers you intended. In other words, it is more “Big Brother” in its nature. It uses the same tried-and-true techniques that exist in network intrusion detection systems. In a simple sense, the technique is similar to the traditional promiscuous network sniffing provided by tools such as tcpdump, snoop, ethereal, and snort. The log aggregator is designed to be able to passively reconstruct the protocol streams (which can be rather expensive in high throughput environments) so that it can introspect the stream and generate a standard-looking log for traffic seen on that protocol (for example, an Apache common log format file). I welcome you to pause at this point to ponder why this solution is imperfect.
In Figure 9.3, we see that the passive log aggregation unit is placed in front of the architecture so that it can witness all client-originating traffic. Although it can be deployed in other parts of the network, this is the best position to attempt to reproduce the logs we would expect from our batched aggregation and/or unicast push aggregation.

This approach is inadequate in several ways, however. First, it requires a network topology where a single point can monitor all incoming network traffic—effectively, one egress point. The larger your network, the less likely your topology will be conducive to this restriction. Not only does your topology have to lend itself to this approach, by implementing this, you add some inflexibility to the architecture. For instance, referring back to Chapter 6, we have several web serving clusters serving traffic from around the world, and, as such, there is no single egress point that we could monitor to “catch” all the web requests for logging. This becomes a matter of the technology fitting well into your architecture, and, often, these issues aren’t showstoppers.
What else is wrong? Many protocols are specifically designed to prevent passive listening. HTTP over Secure Socket Layer (SSL) is one such protocol. SSL traffic is designed to be secure from eavesdropping and injections (man-in-the-middle attacks). As such, there is no good way that a passive log aggregator can determine the data payload of the HTTP sessions performed over SSL. A security expert can argue that if the passive listener has access to the secure key used by the web server (which would be simple in this case), you could effectively eavesdrop. However, there is no way to efficiently eavesdrop, and we are talking about scalable systems here. This shortcoming is a showstopping obstacle in almost every production architecture.
Let’s think about what would happen if we tried to passively decrypt SSL sessions and reconstruct the payload and log the traffic. What happens when we don’t have enough horsepower to get the job done? In any networked system, when too much is going on, you start dropping packets. As these packets are not destined to the aggregator, it cannot request a retransmission. (It would cause the TCP/IP session to break.) If the packets are dropped, there is no way to reconstruct the session, and you end up discarding the incomplete session and with it the logs that should have been generated. There will be countless “legitimate” TCP/IP sessions that will not be complete enough to log (for example, when a client disconnects or there is a sustained routing issue). As such, these passive aggregators typically log no errors, or if they do, they are mixed in with countless “errors” that don’t represent an error due to resource saturation induced packet loss. Basically, you’ll be losing logs without knowing it. Although this is an almost certainty if you were to attempt to tackle SSL traffic, you could also just be logging HTTP and somehow saturate your resources and lose logs and not really now it.
The bottom line here is that if your logs are vital to your business, this type of solution is prone to problems and generally a bad idea.
We want a few simple things to make our logs more reliable and the data inside them work for us on an operational level. When something goes wrong, we all turn to logs to attempt to backtrack from the symptom to the cause. If the cause is in the logs, why should we have to look for it? Why not simply be told about it?
From a reliability standpoint, we want our logs—all of them. If a server crashes, we need to know what transpired up to the point of failure. It is much less useful to bring the machine back online (if possible) at a later point and attempt to retrieve and integrate the old as-of-yet unseen logs. Additionally, if our logs are important, we may want to write them to more than one location at a time—redundant logging servers.
Making logs work for your architecture on an operational level is something you may have never thought of, but you should. Logs hold invaluable data about events that have immediately transpired, and, in a simple way, they can provide a great deal of evidence that something has gone wrong. By aggregating logs in real-time, we can analyze them to determine whether they meet our expectations. Some common expectations that can be transformed into monitors are an upper bound on 500 errors from the servers (perhaps 0), an upper bound on 404 errors, an expected number of requests served per second either in raw numbers or a reasonable proximity to some historical trend. The goal is to construct business-level monitors that can trigger in real-time rather than the typical approach of looking at 24-hour statistical roll-ups and realizing problems exist after they have already had a significant impact on your business.
Although the real-time delivery of logs is a critical requirement not found in other logging methodologies, there are other advantages to be had. Particularly, an efficient substrate for multiple log subscribers is key to the overall usability of the solution. This means that if we are going to start using our logs in an operational sense and have fault tolerant log journaling in place, we will have many different processes subscribing to the log stream. This may not sound like a big deal, but logging incurs a not-insignificant cost. Writing logs to multiple locations can increase that cost linearly unless the right approach is taken. Here we want reliable multicast.
We need to be able to allow many subscribers to the log streams without the potential of bringing the system to its knees. A reliable protocol that uses IP multicast will allow us to scale up the number of subscribers without scaling up the network infrastructure to support it. Spread is one such tool that provides reliable messaging over IP multicast.
In traditional logging configurations, the server software and roles involved are somewhat minimal. It is expensive to juggle logs and, as such, servers tend to have multiple roles so there are as few moving parts as possible. Alongside your cluster of web servers, you’ll see one “logging server” that is responsible for a great many things: collection, archival, analysis, and so on.
In a configuration where logs are published and subscriptions are inexpensive, the opportunity for delegating responsibility and adding redundancy increases as the challenge decreases. This makes our current tasks easier and affords us the opportunity to be innovative with our logs, which we will discuss in Chapter 10, “The Right Tool for the Job.”
The previously discussed logging architectures change shape and form as depicted in Figure 9.4.

First, let’s get some nomenclature in place so that we are all talking about the same thing. The word cluster is too generic, and in this case it is ambiguous. Instead we will refer to the servers according to their roles:
-
Web servers—Servers responsible for serving web pages and publishing logs or the operations that they perform.
-
Log servers—Servers responsible for journaling (to permanent storage) logs of the events published by web servers. They are responsible for abiding by the retention and archival policies the business dictates for this data.
-
Log monitors—Servers that subscribe to the log stream and perform some form of analysis on the stream. These monitors feed back into the overall enterprise monitoring solution implemented for the architecture and supply passive metrics and alerts to be acted on appropriately.
-
Casual monitors—Servers that subscribe to the log stream occasionally but serve no core infrastructure purpose. Subscribers of this fashion would typically be systems administrators attempting to troubleshoot a problem or developers attempting to retrieve logs (errors and access) during development, staging, and occasionally production.
In systems administrator terms, think of the web servers as the system, the log servers as sar or some system accounting and auditing service, the log monitors as SNMP and SNMP traps, and the casual monitors as tools such as top, vmstat, iostat, ps, and so on. All these services and tools are vital to running a healthy system—now you have something comparable for web logs.
The irony is that when someone asks a systems admin what is going on or what happened at a certain point in time on his system, he can answer the question quickly and easily. Typically, no such answer can be had quickly or easily in large web environments. It is imperative that we rectify this situation.
By separating the roles, we allow them to be fulfilled by different servers. This has the obvious advantage of allowing each server to have separately defined uptime requirements, service levels, mission criticality, and management responsibility.
Building such a beast may sound intimidating, but in truth it is actually much simpler and more elegant than the traditional logging approaches. You only need to put in place three components: a mechanism for publication, a subscriber that can satisfy on-disk log aggregation needs, and a substrate over which they will operate.
We’ve already discussed Spread briefly in previous chapters, and we will put it to good use again here. Spread is a fast and efficient messaging bus that can provide exactly the publish/subscribe substrate we are looking for to solve the problem at hand.
We will install Spread on each web server, log host, and monitor server in our architecture; launch it; and verify that it works. This is the first step of using any underlying framework, networking system, or messaging substrate. Because several chapters in this book refer to using Spread, the configuration and installation is described in detail in Appendix A, “Spread.”
Before we jump into how to publish logs into a substrate on which no one will be listening, it seems reasonable to first tackle the issue of journaling said logs to storage. You might think that the tool to accomplish such a task would be simple because it is responsible only for reading such messages from Spread and writing those messages to disk. If you thought that, you were right; the tool is brain-dead simple, and it is called spreadlogd.
spreadlogd, is a simple C program that utilizes the Spread C API to connect to Spread, subscribe to a predefined set of groups, and journal the messages it reads from those groups to a set of files. It is amazingly simple.
Listing 9.1. spreadlogd.conf—A Simple spreadlogd Configuration
Buffer = 65535
Spread 4803 {
Group logdomain1 {
File = /data/logs/logdomain1/debug_log
}
Group logdomain2 {
File = /data/logs/logdomain2/common_log
RewriteTimestamp = CommonLogFormat
}
}
The sample configuration detailed in Listing 9.1 and presented in diagram form in Figure 9.4 is short and simple. Effectively, we’d like to read messages up to 64 kilobytes in length from the Spread daemon listening on port 4803. We want to subscribe to the groups named logdomain1 and logdomain2 and write them to the files /data/logs/logdomain1/debug_log and /data/logs/logdomain2/common_log, respectively. As an extra, added feature we want the spreadlogd instance to recognize the logs it reads from logdomain2 as Apache common log format, find the time stamp therein, and rewrite it with the current local time stamp on the machine. spreadlogd is a simple program and as such is reliable and fast.
You can test the operation now (after running spreadlogd on your logging host) by running spuser (a tool that comes with Spread) from any machine in your cluster (logger, monitor, or web server). The following output presents a spuser publishing session:
# /opt/spread/bin/spuser -s 4803
Spread library version is 3.17.3
User: connected to 4803 with private group #user#admin-va-1
==========
User Menu:
----------
j <group> -- join a group
l <group> -- leave a group
s <group> -- send a message
b <group> -- send a burst of messages
r -- receive a message (stuck)
p -- poll for a message
e -- enable asynchonous read (default)
d -- disable asynchronous read
q -- quit
User> s logdomain1
enter message: This is a test message. Walla walla bing bang.
User> q
Bye.
We should see that log line immediately (sub second) appear in the /data/logs/logdomain1/debug_log on our logging server. If we are running two logging servers, it will appear in both places, and if we were running spuser on another machine subscribed to the logdaemon1 group (j logdaemon1), we would also see it appear on our spuser console. It’s like magic.
Now, we have something in place to write the logs published to our groups to disk and thus it is safe to explore methods to actually publishing them.
Before I jump into explaining how to configure Apache to log web logs through our new Spread infrastructure, I’d like to rant a bit about the danger of inertia.
Spread has a C, Perl, Python, PHP, Ruby, Java, and OCaml API—just for starters. It is trivial to write support into any application to publish messages into Spread. Although there is no good reason to fear code modification, it is a common fear nonetheless. Ironically, most systems engineers and developers are comfortable using a modification (patch) written by someone else. I suppose it is a lack of self-confidence or a misplaced faith in the long-term support interests the author has for the changeset. Whatever it is, I suggest we get past that—it hinders thinking out of the box and causes the wrong technologies to be used despite the simplicity of adopting new ones.
A specific example of this is that a few large enterprises I’ve worked with simply would not consider this logging option, despite the advantages it offered, because it didn’t expose a log4j (a popular Java logging specification) implementation. They did not want to invest in the effort to switch from log4j to something new. If you don’t know what log4j is, you should be confused by now. log4j is an API more than anything else, and below that API there is an implementation that knows how to write to a disk, or to JMS, or to a database, and so on. There is no good reason why some engineer couldn’t spend an hour building a log4j implementation that published to Spread. The fear of new technology was irrational in this case, and the company was prepared to forfeit an extreme advantage due to its fear of having to write code. This is ridiculous—end of rant.
mod_log_spread, available at http://www.backhand.org/, is a version of mod_log_config (a core Apache module for logging) that has been patched to allow publishing logs to a Spread daemon; as such, you have all the features of mod_log_config. mod_log_config allows you to specify the log destination as the path to a file to which it will append or, alternatively, a program to which it will pipe the logs—this is accomplished by preceding the name of the program with a | character as is conventional on UNIX systems. To this, mod_log_spread adds the capability to publish to a group by specifying the log destination as the group name prepended by a $ character. In our case, instead of specifying the target of the CustomLog statement as a path to a local file or a pipe to Apache’s rotatelogs program, we specify $logdomain2. This can be seen in the following httpd.conf excerpt:
LoadModule log_spread_module libexec/mod_log_spread.so
AddModule mod_log_spread.c
SpreadDaemon 4803
CommonLog $logdomain2
The preceding configuration loads the mod_log_spread module into Apache (1.3), configures it to talk to Spread locally on port 4803 (actually through /tmp/4803 on UNIX), and writes logs in Common Log Format (CLF) to the Spread group logdomain2. Start up your server with that, and you should immediately see log lines (in CLF) written as prescribed by your spreadlogd configuration whenever a page is loaded.
You may not realize it, but you’ve just created a monster. You have just instrumented your web architecture for performance assessment, debugging, monitoring, and auditing—and it was really easy.
Now, you can take my word for it that this stuff is cool, but we will present a few examples of things we can now see that were painful, if not impossible, in a previous logging architecture (whatever it may have been).
The most obvious is that you now have one or more log hosts running spreadlogd journaling your logs to disk. This isn’t very glamorous, so instead of staring at those for a long time (but by all means, do so if it makes you happy), we’ll spend the next few sections looking at live streams.
First, let’s look at a stream going by. In previous examples we used the group logdomain2, so we should be able to connect to Spread using its cantankerous command-line tool spuser and see some logs. The following output presents a spuser real-time observation session:
# /opt/spread/bin/spuser -s 4803
Spread library version is 3.17.3
User: connected to 4803 with private group #user#admin-va-1
==========
User Menu:
----------
j <group> -- join a group
l <group> -- leave a group
s <group> -- send a message
b <group> -- send a burst of messages
r -- receive a message (stuck)
p -- poll for a message
e -- enable asynchonous read (default)
d -- disable asynchronous read
q -- quit
User> j logdomain2
============================
Received REGULAR membership for group lethargy with 2 members,
where I am member 1:
#sld-05988#gollum
#user#admin-va-1
grp id is 182571332 1118158447 4
Due to the JOIN of #user#admin-va-1
User>
============================
received RELIABLE message from #ap26194#www-va-2, of type 1,
(endian 0) to 1 groups
(216 bytes): 85.192.40.13 - - [12/Aug/2005:15:21:30 -0400]
"GET /~jesus/archives/29-isaexec-and-magical-builds.html HTTP/1.0"
200 12502 "http://order-carisoprodol.9k.com" "Mozilla/4.0
(compatible; MSIE 6.0; Windows NT 5.1; SV1)"
User>
============================
received RELIABLE message from #ap26590#www-va-1, of type 1,
(endian 0) to 1 groups
(210 bytes): 85.192.40.13 - - [12/Aug/2005:15:21:36 -0400]
"GET /~jesus/archives/29-isaexec-and-magical-builds.html HTTP/1.0"
200 12502 "http://order-cialis.9k.com" "Mozilla/4.0 (compatible;
MSIE 6.0; Windows NT 5.1; SV1)"
User>
============================
received RELIABLE message from #ap26196#www-va-3, of type 1,
(endian 0) to 1 groups
(202 bytes): 216.86.156.205 - - [12/Aug/2005:15:21:40 -0400]
"GET /~jesus/archives/1970/01.html HTTP/1.1" 200 12493
"http://buy---adipex.at.tut.by" "Mozilla/4.0 (compatible;
MSIE 6.0; Windows NT 5.1; en) Opera 8.0"
User>
============================
received RELIABLE message from #ap26192#www-va-2, of type 1,
(endian 0) to 1 groups
(209 bytes): 85.192.40.13 - - [12/Aug/2005:15:21:47 -0400]
"GET /~jesus/archives/29-isaexec-and-magical-builds.html HTTP/1.0"
200 12502 "http://1st-levitra.9k.com" "Mozilla/4.0 (compatible;
MSIE 6.0; Windows NT 5.1; SV1)"
User>
Bye.
The first message is one indicating a group membership change. The new users are #sld-05988#gollum and #user#admin-va-1. Well, we’re logged in to admin-va-1, so we are the #user#admin-va-1, and on the machine named gollum we are running a spreadlogd daemon (gollum is running Linux):
# ssh gollum "ps auxwww | awk '/spreadlogd/{print "'$2" "$11'";}'"
5988 /usr/local/sbin/spreadlogd
Lo and behold! A spreadlogd process is running at process ID 5988, hence the private member name #sld-05988#gollum. I no longer feel alone.
Now, what are all those other lines? Well, aside from the Apache log line that we see, we have some other useful information:
-
RELIABLEis a word describing the semantics with which the message was published;mod_log_spreadusesRELIABLEmessaging by default. -
from #ap26192#www-va-2indicates the sender of the message, which is informative. It means that the Apache child at process ID 26192 on the machine www-va-2 just serviced the request and sent us that log line. -
type 1is an advanced Spread internal that can be ignored. -
endian 0is used to indicate whether the sending machine has a different byte ordering than the local Spread daemon to which we connected. -
to 1 groupsindicates the cardinality of groups to which this message was sent.mod_log_spreadonly sends individual messages to a single group.
The rest of the message is the Apache Common Log Format line and shows us more interesting things. These hits happen to be against my personal blog, and we can see that they are all coming from the same IP address from different referrers all within a few seconds of one another. This is suspect. Why would someone be coming to my site four times (this is just a small clip of time, there are actually thousands of these) all from different places?
Well, blogs (at least mine) track the referrers and list the top referrers in a side bar on the page. So if you refer to my blog many times from a particular URL, you may get some exposure under the top referrers section. Looking at these URLs, this person clearly isn’t interested in the information on my blog. He just wants his prescription drug website link on my page. I don’t like this guy already.
I could write a script that listens to this Spread group to check for IP addresses that contain three non-blank, differing URL referrers within 60 seconds and add them to a suppression list that my blog would use to eliminate “the bad guys” from my top referrers. Just a thought.
A demonstration on my blog doesn’t expose the challenges involved with doing real-time assessments on large sites. In those environments, the logs stream by so fast that automated tools are absolutely required to perform any useful analysis—unless something is catastrophically broken.
From the administrative point of view (systems, network, database), real-time monitoring is the capability to understand what is happening over some period of time. Specifically, it is the capability to correlate clearly realized effects with clearly reported occurrences. On the systems administration side, there are some age-old tools that allow administrators to understand system metrics in real-time. Two such tools are iostat and vmstat. These tools allow you to understand disk I/O activity, service times, virtual memory, and scheduling-related activity in near real-time. It is far out of the scope of this book to talk about how you would go about interpreting the output of such tools, but we can use them to draw a parallel into clustered systems.
Where are the tools that tell us what is going on in real-time in our web cluster? iostat and vmstat are fundamentally important to monitoring and troubleshooting problems on production systems. They allow administrators to quickly pinpoint bottlenecks or points of resource contention. As such, they are available on every modern system. When you install your Apache web cluster, where are the analogous tools? Absent.
If you install a load-balancing device in front of your cluster, often that system will provide real-time metrics—at least those that it uses to make its load-balancing decisions. As we have learned, these load-balancing devices are not always the right tools for the job, so there must be another way to ascertain these vital metrics in real-time. Additionally, there very well may be metrics related to your web application that should be monitored, and because these load-balancing devices operate above the web application, there is no feasible way they could report application specific metrics. Listing 9.2 shows an example of a real-time web traffic monitor.
Listing 9.2. wwwstat—A Real-time Web Traffic Monitor
1: #!/usr/bin/perl
2:
3: use strict;
4: use Spread;
5: use Getopt::Long;
6: use Time::HiRes qw/tv_interval gettimeofday/;
7:
8: # return the maximum of two inputs
9: sub max { my($a,$b) = @_; ($a>$b)?$a:$b; }
10:
11: use vars qw /$daemon @group $interval $last $quit $banner $rows_since_banner
12: %servers %hits %statuses/;
13:
14: GetOptions("d=s" = > $daemon,
15: "g=s" = > @group,
16: "i=i" = > $interval);
17:
18: $interval ||= 1;
19: my ($m, $g) = Spread::connect( { spread_name = > "$daemon",
20: private_name = > "tt_$$" } );
21: die "Could not connect to Spread at $daemon" unless $m;
22: die "Could not join group" unless(grep {Spread::join($m, $_)} @group);
23:
24: sub pretty_hits {
25: my ($servers, $statuses, $hitcnt, $banner) = @_;
26: my @slist = sort keys %$servers;
27: my @stlist = sort { $a < = > $b } keys %$statuses;
28: my $minw = scalar(@stlist) * 4 - 1;
29:
30: # If we were asked to print a banner or it has been over 19 rows
31: if($banner || $rows_since_banner > 19) {
32: # print out server names
33: foreach (@slist) {
34: printf "%".max($minw, length($_))."s ", $_;
35: }
36: print "
";
37: foreach (@slist) {
38: # print out status codes
39: my $str;
40: foreach my $st (@stlist) { $str .= sprintf("%3d ", $st); }
41: $str =~ s/s*$//;
42: printf "%".max($minw, length($_))."s ", $str;
43: }
44: print "
" . ('-' x 72) . "
";
45: $rows_since_banner = 0;
46: }
47:
48: # Print out counts for each server/statuscode
49: foreach (@slist) {
50: my $str;
51: foreach my $st (@stlist) { $str.=sprintf("%3d ",$hitcnt->{"$_/$st"}); }
52: $str =~ s/s*$//;
53: printf("%".max($minw, length($_))."s ", $str);
54: }
55: $rows_since_banner++;
56: print "
";
57: }
58:
59: $SIG{'INT'} = sub { $quit = 1; };
60: $last = [gettimeofday];
61: while(!$quit and my @p = Spread::receive($m, 0.2)) {
62: if(@p[0] & Spread::REGULAR_MESS()){
63: # For each regular message, parse the common log
64: if(@p[5] =~ /^(S+) # remote host address
65: s(S+) # remote user
66: s(S+) # local user
67: s[([^]]+)] # date
68: s"([^"]+)" # request
69: s(d+) # status
70: s((?:d+|-)) # size
71: s"([^"]+)" # referrer
72: /x) {;
73: my ($raddr, $ruser, $luser, $date, $req, $status, $size, $ref) =
74: ($1, $2, $3, $4, $5, $6, $7, $8);
75: (my $lhost = @p[1]) =~ s/^#[^#]+#//;
76:
77: # account for the server and status code, if either is "new" we
78: # must issue a new header/banner
79: $banner = 1 unless exists $servers{$lhost};
80: $banner = 1 unless exists $statuses{$status};
81: $servers{$lhost} = 1;
82: $statuses{$status} = 1;
83: # tally the server/status hit
84: $hits{"$lhost/$status"}++;
85: }
86: }
87: if(tv_interval($last) > $interval) {
88: # if $interval has elapsed, print out our tallies and zero them
89: pretty_hits(\%servers, \%statuses, \%hits, $banner);
90: $banner = 0;
91: undef %hits;
92: $last = [gettimeofday];
93: }
94: }
95:
96: Spread::disconnect($m);
The wwwstat program provides the insight we’re missing. Let’s take it for spin on a small web cluster of three nodes serving only dynamic page traffic. Output from wwwstat is as follows:
1: www-va-1 www-va-2 www-va-3
2: 200 302 404 500 200 302 404 500 200 302 404 500
3: ------------------------------------------------------------------------
4: 51 3 0 0 69 2 0 0 54 2 0 0
5: 40 0 0 0 57 1 0 0 48 2 0 0
6: 68 2 0 0 70 4 0 0 55 2 0 0
7: 68 2 0 0 94 2 0 0 71 1 0 0
8: 54 2 0 0 60 0 0 0 53 1 1 0
9: 61 1 0 0 69 2 0 0 64 0 0 0
10: 99 4 0 0 92 5 0 0 101 1 0 0
11: 70 4 0 0 89 4 0 0 83 3 0 0
12: 65 2 0 0 57 1 0 0 49 1 0 0
13: 59 4 0 0 60 2 0 0 56 2 0 0
14: 48 3 0 0 50 2 0 0 46 4 0 0
15: 44 2 0 1 58 1 0 0 44 1 0 0
16: 49 0 0 0 64 3 0 0 54 3 0 0
17: 54 6 0 0 50 2 0 0 54 2 0 0
18: 94 1 0 0 84 0 0 0 76 4 0 0
Hey! There’s an internal server error on www-va-1 (line 15)! Someone should take a look at that. Most importantly, however, we can see that the number of requests per time interval to each node in the cluster is distributed reasonably well (uniformly).
Now, the wwwstat tool certainly can be cleaned up a bit. The rendering could be prettier, and the information could be more thorough. However, it demonstrates that we can whip up a tool to suit our needs in short order as long as the information we need to analyze is at our fingertips. Getting the information here was cake (lines 19-22, 61, and 96).
This example was fun, but you may say, “I can look on my load balancer and see this information.” You are absolutely right, if you (as a developer or sys admin) have access to that load balancer.
Demonstrating this passive analysis technique with web logs in common log format was simple and useful. That is certainly not the be-all, end-all of what can be accomplished. Spread is a simple communications medium, and publishers can publish anything they want. You could change the common log format to a custom one that includes the time it took to service each web request. With this modification, you could augment wwwstat to display average, minimum, and maximum service times (much like iostat does).
Note
Sadly, to get resolution finer than 1 second in Apache 1.3 (you’d want millisecond or microsecond granularity), you have to modify the mod_log_config source code. If you don’t code C, or have never touched Apache source or Apache module source, this is a fabulous first project. It is short, simple, and amazingly useful. Apache 2.0 already provides sub-second timing granularity.
Aside from web logs, you could have your database abstraction layer log to a spread group on every statement execution and report the query being run and the time it took to execute it.
Outside the monitoring space (in a manner of speaking) is the capability to track user click-streams in real-time, regardless of the servers they access.
When you spend a lot of time in a large architecture you begin to realize that looking up at the system from the ground floor is a great way to troubleshoot problems. It also happens to be one of the worst ways to find problems. Your vision is shortsighted, and your view on the system as a whole is poor. So, the best architects and engineers have a healthy respect for the down-and-dirty details, as well as a macroscopic view of the business.
When I say “macroscopic view of the business” I don’t mean accounting, HR, cleanliness of the office space—we haven’t left the technical landscape. I’m referring to technical business metrics. The marketing initiatives, the new registrations, the number of orders placed, and so on. These elements make the business money and, in the end, pay your salary, so you better be monitoring them. Somebody has to see the big picture, and if you are the CTO or the director of operations, that is your job. If you aren’t and you report to someone, there is no excuse for you to not see the big picture—that’s the path to the D and C levels.
The key here is not to lose your analytical engineering-focused thinking. So, you might ask (though I hope not) what I hear from developers and administrators when I speak on this subject. “What good does it do me to see how many orders were placed yesterday or last hour?” “Who cares how many new customers we have as long as the number is positive?” “No one tells me when a new marketing initiative starts, that’s handled by another department; besides, what does it have to do with my job?”
There are many answers to these questions. Usually they are delivered after a smack in the head of the person who asked them in the first place. The most obvious reason is because you should care what is going on. The other reason is because you are in the unique position to see an even bigger picture.
On the nontechnical side of the business, you better believe they have reports on every single business related metric. Chances are good that the data for those reports mostly comes from the logs and databases in your architecture. So...you can see those reports, too. However, the business side doesn’t see all the technical reports such as bandwidth utilization, database query volume, and cache hit rates on your static content servers.
By seeing all of this data at a high level, you can learn what to expect. You see normal trends and correlations between metrics that fall more on the business side to metrics that fall more on the technical side. Understanding the relationship between these things can lead to profound insights.
So, where are we going with this? Am I saying that you should have daily reports of all the important business metrics and technical metrics in one place so that you can see the picture? Well, obviously, but that’s the tip of the iceberg. With centralized real-time logging you can get reports by the minute and see trends as they form. Although understanding a trend that is just forming is pretty much impossible, if you have familiarized yourself with all the big picture data and understand what the relationships between all the metrics look like in a healthy system, you can spot an unhealthy situation as it is gestating.
If you have ever worked with large number sets, the first thing you learned was that visualization tools are priceless. I can look at the number of octets sent every minute of the day from each of our 10 web servers (1440 times 10) or I can look at a simple graph. Both are useful, but I certainly want to start with the graph—if everything looks okay, I have no need to look deeper. Graphs, specifically those that share a common axis (such as time), make it easy to correlate cause and effect, which can be difficult when there are multiple causes and effects spanning several systems.
Let’s stay with our news site as an example. Most operations groups use graphing as an invaluable data correlation tool. Typical graph sources are bandwidth and errors on each switch port, as well as CPU, memory, load, and disk utilization on each server. These graphs are an invaluable resource when attempting to diagnose performance issues and the effects that new strains (new pushed services or code) have caused.
Suppose that we launch a new service that offers users a listing of the most popular “next page visited” list based on the site-local page loaded by all people who were viewing the page in question directly prior. In other words, if 1,000 users viewed page A and then performed some action to deliver them to another page on the site, all those pages would be ranked by popularity and displayed on page A. Implementing this in a scalable manner will be left as an exercise to the reader (read the rest of the book first).
The service has been launched and metrics are down by 5%. Why and what metrics? These are questions posed to senior technologists, and having a firm grasp of how to arrive at a solution quickly is a valuable skill. New user registrations are following an expected trend, the bandwidth is up by 2%, as well as the number of hits on the site. However, the advertising click-through is down by 5%. This is the landscape for our puzzle. How can all these system metrics be up and the business be down?
To answer this question we need more data—or an aware operations team. However, we also can have data coming out our ears, and it all will be useless unless we find a good means of visualizing it.... Enter Tobias Oetiker and his useful RRDtool (http://people.ee.ethz.ch/~oetiker/webtools/rrdtool/.)
The more I work with RRDtool, the more I realize that it is utterly obtuse, and yet irreplaceable. RRDtool stands for Round Robin Database tool, and it allows streamlined data metric retention and visualization. Perhaps the most common use of this type of tool is for monitoring the activity on network interface cards on routers, switches, and even hosts. RRDtool will allow you to create a database of tracked metrics with a specific expected frequency and well-defined database retention policies, feed new metrics into the database, and then generate both ugly and stunning visualizations of the data therein.
Like many engineering tools, RRDtool provides an engineer with just enough options to require constant access to the manual page and defaults/samples that are designed to convince people that engineers don’t know what really looks good. However, it is powerful and flexible and a tremendous asset to any monitoring suite.
The ins and outs of RRDtool could fill the pages of at least one book, and it simply isn’t important to understand how to install, configure, and use RRDtool for me to illustrate its usefulness. Luckily, the documentation for RRDtool and the various open source products that use it are excellent starting points.
We will walk through a simple usage of RRDtool and show how the additional collected information can help us solve the “metrics are up and business is down” problem posed earlier.
The first thing we’ll do is set up some RRDs to track the metrics we’re interested in. Note that you must be interested in these things before the problems occur; otherwise, you will see only the data representing the problematic situation and not historical data for comparison. In other words, we should set up the metric collection as part of launching the service, not as a part of troubleshooting.
We want to track the number of bytes in and out of our web environment and the number of page hits by server, error code, and user registration status. To make this example shorter, we’ll set up traffic metrics and page hits by user registration status here and leave the rest as an exercise to the reader.
For all our information we want second to second accurate data. However, updating all these databases once a second for each metric can be expensive, and it really doesn’t add much value. Basically, we want to be able to see spikes and anomalies better. For example, if something bad happens for one minute out of the hour, we don’t want to see it averaged into 60 minutes worth of data. There is a trade-off here, and I’m giving you some insight into choosing a lower bound on the data collection period. If a graph or set of graphs is displayed, what is the amount of time that it will take to fully understand what we’re seeing? This includes the big picture, trends, identifying anomalies, and correlating them across data sources. On a good day, it takes me about two minutes, so I collect data twice that often.
The next questions are “how long will this data be retained?” and “how far back must be it available on 60-second intervals?” These are much tougher questions. Typically, I retain information for two years when I set up RRD files. If I want data back farther than that, it is never needed on a granularity finer than a week, so archiving could actually be done by taking RRD-generated graphs and saving one a week forever.
To create the RRDs for the inbound byte counters and outbound byte counters to be used to measure overall traffic, we create one RRD for each (though multiple metrics can be stored in a single RRD, I find juggling them easier when they are one-to-one):
rrdtool create /var/rrds/web-inbytes.rrd --step 60 DS:bytes:COUNTER:60:0:U
RRA:AVERAGE:0.5:1:5760 RRA:MAX:0.5:1:5760 RRA:MIN:0.5:1:5760
RRA:AVERAGE:0.5:10:4032 RRA:AVERAGE:0.5:60:5376
RRA:AVERAGE:0.5:120:8064 RRA:MAX:0.5:120:8064 RRA:MIN:0.5:120:8064
rrdtool create /var/rrds/web-outbytes.rrd --step 60 DS:bytes:COUNTER:60:0:U
RRA:AVERAGE:0.5:1:5760 RRA:MAX:0.5:1:5760 RRA:MIN:0.5:1:5760
RRA:AVERAGE:0.5:10:4032 RRA:AVERAGE:0.5:60:5376
RRA:AVERAGE:0.5:120:8064 RRA:MAX:0.5:120:8064 RRA:MIN:0.5:120:8064
We will create RRD files for tracking hits by registered versus unregistered users similarly:
rrdtool create /var/rrds/web-visitorhits.rrd --step 60 DS:hits:COUNTER:60:0:U
RRA:AVERAGE:0.5:1:5760 RRA:MAX:0.5:1:5760 RRA:MIN:0.5:1:5760
RRA:AVERAGE:0.5:10:4032 RRA:AVERAGE:0.5:60:5376
RRA:AVERAGE:0.5:120:8064 RRA:MAX:0.5:120:8064 RRA:MIN:0.5:120:8064
rrdtool create /var/rrds/web-userhits.rrd --step 60 DS:hits:COUNTER:60:0:U
RRA:AVERAGE:0.5:1:5760 RRA:MAX:0.5:1:5760 RRA:MIN:0.5:1:5760
RRA:AVERAGE:0.5:10:4032 RRA:AVERAGE:0.5:60:5376
RRA:AVERAGE:0.5:120:8064 RRA:MAX:0.5:120:8064 RRA:MIN:0.5:120:8064
The preceding statements maintain single step (60 seconds) averages, minimums, and maximums for 5760 intervals (4 days), 10 step (10 minute) averages for 4032 intervals (28 days or 4 weeks), 60 step (60 minute) averages for 5376 intervals (224 days or 32 weeks), and lastly 120 step (2 hour) averages, minimums and maximums for 8064 intervals (2 years).
Perhaps the most challenging aspect of managing stores of metrics is collecting the data in the first place. There are two categories of metrics in the world: those that can be queried via SNMP (Simple Network Management Protocol) and those that cannot. Many a tool sits on top of RRDtool that can collect SNMP-based metrics for you. Cacti (http://www.cacti.net/) is one such tool that manages to make its way into production a lot around here.
Querying data from SNMP is simple—there are supporting libraries or extensions for almost every common programming language. I highly recommend using one of the many prebuilt packages to do automated metric collection from all your SNMP-capable devices. Many of these packages even automate the creation and population of the RRD files. For now, we’ll set up a simple cron job that updates the two byte counters from the router that sits in front of our web architecture (see Listing 9.3). (It’s IP address is 10.10.10.1.)
Listing 9.3. simple_out_rrdupdate.sh—Simplistic RRDtool Update Script
#!/bin/sh
FILE=$1
AGENT=$2
OID=$3
if test ! -f "/var/rrds/$FILE.rrd"; then
echo No such RRD file
exit
fi
COMMUNITY=public
BYTES='snmpget -c $COMMUNITY -v 2c -Oqv $AGENT $OID'
if test "$BYTES" -le "0"; then
echo Bad SNMP fetch;
exit
fi
rrdtool update /var/rrds/$FILE.rrd -t bytes N:$BYTES
crontab entry:
* * * * * /usr/local/bin/simple_oid_rrdupdate.sh web-inbytes 10.10.10.1
.1.3.6.1.2.1.2.2.1.10.1
* * * * * /usr/local/bin/simple_oid_rrdupdate.sh web-outbytes 10.10.10.1
.1.3.6.1.2.1.2.2.1.16.1
It should be clear that you would not want to run a cron job every minute for every single metric you monitor. This specific example is for brevity. Additionally, the SNMP OID .1.3.6.1.2.1.2.2.1.10.1 is in no way intuitive. It represents the inbound octets (old networking lingo for bytes) on interface 1 of the specified device. Any SNMP collection tool worth its weight in electrons will make OIDs human readable and easy to find.
Now that we have statistics being collected (and we’ll assume we have been collecting them all along), we can move on to something that is a bit more obtuse (if that’s possible). Collecting SNMP metrics is easy because all the tools do all the complicated actions described previously for you, and you just point it at a device, or set of devices, and click Go. This can be done because SNMP is an established protocol, and the OIDs (the long dot-delimited numeric) are well established as either an industrywide standard or are well documented by the vendor of the device. Graphing other stuff is not so simple.
To graph the rate of page loads (hits) for visitors to the site, as well as for registered users, we need to know more than any vendor could generally know. Specifically, we need to know how we classify a loaded page as being loaded by a registered user (in our case a user with an account that is currently “signed in” while viewing the page) or a visitor (anyone else).
To do this, we can alter the wwwstat program we wrote before to track the hits and update the RRD files. In our web application we will use the second field of the common log format (remote user) to represent the current viewing user. It is in the form V-{VISITORID} for visitors and U-{USERID} for users. We place it in the remote user field of the log format because it will not change the format and thus will not break existing processes that read those logs. The remote user field is relatively useless these days because many clients don’t support RFC1413, and most sites don’t attempt to perform RFC1413 (ident) lookups. This means that we simply need to monitor the live log stream and tally logs with a remote user starting with ‘V’ in the web-visitorhits file and everything else in the web-userhits file. We do this in userhits2rrd.pl seen in Listing 9.4.
Listing 9.4. userhits2rrd.pl—Updating RRD Files with External Data
01: #!/usr/bin/perl
02:
03: use strict;
04: use Spread;
05: use Getopt::Long;
06: use Time::HiRes qw/tv_interval gettimeofday/;
07: use RRDs;
08:
09: use vars qw /$daemon @group $interval $last $quit %ahits/;
10:
11: GetOptions("d=s" = > $daemon,
12: "g=s" = > @group,
13: "i=i" = > $interval);
14:
15: $interval ||= 60;
16: my ($m, $g) = Spread::connect( { spread_name = > "$daemon",
17: private_name = > "tt_$$" } );
18: die "Could not connect to Spread at $daemon" unless $m;
19: die "Could not join group" unless(grep {Spread::join($m, $_)} @group);
20:
21: $ahits{visitors} = $ahits{users} = 0;
22: sub tally {
23: # This should be called every $interval seconds
24: RRDs::update("/var/rrds/web-visitorhits.rrd",
25: "--template", "hits", "N:$ahits{visitors}");
26: RRDs::update("/var/rrds/web-userhits.rrd",
27: "--template", "hits", "N:$ahits{users}");
28: }
29:
30: $SIG{'INT'} = sub { $quit = 1; };
31: $last = [gettimeofday];
32: while(!$quit and my @p = Spread::receive($m, 0.2)) {
33: if(@p[0] & Spread::REGULAR_MESS()){
34: # For each regular message, parse the common log
35: if(@p[5] =~ /^(S+) # remote host address
36: s(S+) # remote user
37: s(S+) # local user
38: s[([^]]+)] # date
39: s"([^"]+)" # request
40: s(d+) # status
41: s((?:d+|-)) # size
42: s"([^"]+)" # referrer
43: /x) {;
44: my ($raddr, $ruser, $luser, $date, $req, $status, $size, $ref) =
45: ($1, $2, $3, $4, $5, $6, $7, $8);
46:
47: if($ruser =~ /^V/) { $ahits{"visitors"}++; }
48: } else { $ahits{"users"}++; }
49: }
50: }
51: if(tv_interval($last) > $interval) {
52: tally();
53: $last = [gettimeofday];
54: }
55: }
56:
57: Spread::disconnect($m);
Now we run the userhits2rrd.pl script, and data collection and storage into RRD is done. The reason this is substantially more complicated than SNMP is that there are no good generic tools to collect your custom business metrics. Each time you want to track a new data source that isn’t SNMP capable, you either have to glue it into an SNMP agent or query via custom logic as we have done here. These metrics are absolutely useful and warrant maintaining one-off collection scripts for each of the business metrics you want to track. In the end, you’ll find that your scripts aren’t very complicated, aren’t all that different from one another, and will yield substantial intra-organizational reuse.
So, we’re collecting metrics, but this doesn’t help us solve our problem. We must be able to visualize it for it to prove useful. Like everything else with RRDtool, the visualization can do exactly what you want, but the user interface to do it is 100% engineer and 0% designer. We have a web wrapper around most of the RRD graphs we can generate, which makes them quite nice; but I’ll show you the “under the hood” graph generation here so that you can have a healthy respect for why someone should wrap it with a simple web interface.
To generate a graph that is ugly, we can call rrdtool in its simple form:
rrdtool graph
ugly.png -title "web traffic" -a PNG
--vertical-label "bits/sec" -width 800 -height 500
"DEF:inbytes=/var/rrds/web-inbytes.rrd:inbytes:AVERAGE"
"DEF:outbytes=/var/rrds/web-outbytes.rrd:inbytes:AVERAGE"
"CDEF:realinbits=inbytes,8,*"
"CDEF:realoutbits=outbytes,8,*"
"AREA:realinbits#0000ff:Inbound Traffic"
"LINE1:realoutbits#ff0000:Outbound Traffic"
--start -172800
Yes, that’s the simple form. It pulls the in and out byte metrics over the last 172,800 seconds (two days) from their respective RRD files, multiplies them by 8 (to get bits), and graphs the inbound in a blue area curve and the outbound in a red line curve.
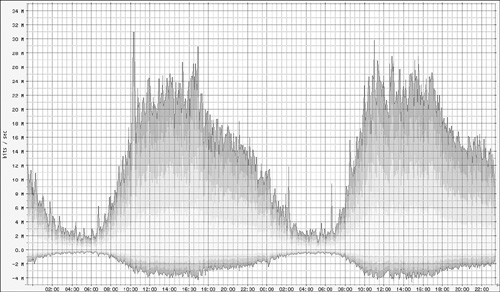
It produces something usable, but so ugly I refuse to grace this book with it. So, we will consult a visualization expert and show the traffic sent to the Internet on the positive y-axis and the traffic received from the Internet on the negative y-axis (the total hits being the area in between). Additionally, we will add some gradient pizzazz and end up with the following (utterly obtuse) command that produces Figure 9.5:
rrdtool graph webtraffic.png -title "web traffic" -a PNG
--vertical-label "bits / sec"
--width 450 --height 180
DEF:outbytes=/var/rrds/web-outbytes.rrd:outbytes:AVERAGE
DEF:inbytes=/var/rrds/web-inbytes.rrd:inbytes:AVERAGE
"CDEF:realout=outbytes,8,*,-1,*"
"CDEF:realin=inbytes,8,*"
"CDEF:realout1=outbytes,8,*,-1,*,3,*,4,/"
"CDEF:realout_h=outbytes,8,*"
"CDEF:realout2=outbytes,8,*,-1,*,2,*,4,/"
"CDEF:realin3=inbytes,8,*,1,*,4,/"
"CDEF:realoutb=outbytes,8,*,-1,*"
"CDEF:realinb=inbytes,8,*"
"CDEF:realin_h=inbytes,8,*"
"CDEF:realin1=inbytes,8,*,3,*,4,/"
"CDEF:realin2=inbytes,8,*,2,*,4,/"
"CDEF:realout3=outbytes,8,*,-1,*,1,*,4,/"
"AREA:realout#ffaa44:"
"AREA:realin#ffaa44:"
"AREA:realout1#ffcc55:"
"AREA:realin1#ffcc55:"
"AREA:realout2#ffee77:"
"AREA:realin2#ffee77:"
"AREA:realout3#ffff88:"
"AREA:realin3#ffff88:"
"LINE1:realoutb#888833:web outbound traffic"
"LINE1:realinb#888833:web inbound traffic"
--start -172800
Now let’s graph our user hit metrics using the same technique (shown in Figure 9.6):
rrdtool graph webhits.png --title "online users" -a PNG
--vertical-label "users" -width 800 -height 500
DEF:uhits=/var/rrds/web-userhits.rrd:hits:AVERAGE
DEF:vhits=/var/rrds/web-visitorhits.rrd:hits:AVERAGE
"CDEF:realv=vhits"
"CDEF:realv3=vhits,1,*,4,/"
"CDEF:realvb=vhits"
"CDEF:realv_h=vhits"
"CDEF:realv1=vhits,3,*,4,/"
"CDEF:realv2=vhits,2,*,4,/"
"CDEF:realu=uhits,-1,*"
"CDEF:realu1=uhits,-1,*,3,*,4,/"
"CDEF:realu_h=uhits"
"CDEF:realu2=uhits,-1,*,2,*,4,/"
"CDEF:realub=uhits,-1,*"
"CDEF:realu3=uhits,-1,*,1,*,4,/"
"AREA:realu#ffaa44:"
"AREA:realv#ffaa44:"
"AREA:realu1#ffcc55:"
"AREA:realv1#ffcc55:"
"AREA:realu2#ffee77:"
"AREA:realv2#ffee77:"
"AREA:realu3#ffff88:"
"AREA:realv3#ffff88:"
"LINE1:realub#888833:Registered Users"
"LINE1:realvb#888833:Visitors"
--start -172800

Back to our problem, so that we don’t wander aimlessly without purpose any longer: New user registrations are following an expected trend, the bandwidth is up by 2%, as is the number of hits on the site. However, the advertising click-through is down by 5%.
As our problem describes, we should see an increase in bandwidth by about 2% from the previous day. Figure 9.5 shows something that looks reasonably consistent with the problem description.
In Figure 9.6, however, we see something entirely unexpected. We were told that the hits on the site have increased by 2% as well, but the data for today (the right hump) is substantially more than 2% larger than yesterday (the left hump). So, either someone doesn’t know what he is talking about, or that person’s definition of “hit” doesn’t match our definition of “hit.”
Indeed this is the case. If we look at our script, it tallies all log lines it sees as a hit for either a registered user or a visitor. It does not limit the count to those requests serviced by a 200 HTTP response code (as is common in some reporting tools). Although this doesn’t identify the problem, we clearly see that a problem of some type is occurring today that did not occur yesterday—progress.
If we believe that this graph shows dramatically different trends from what the problem report indicates because of the response codes, we should be looking at graphs of response codes.
Figure 9.7 shows a graph of pages served over time broken down by HTTP response code. The problem couldn’t be more obvious now. We are throwing 404 (page not found errors) now, and we were not doing so yesterday. Looking at these graphs to come to this conclusion took only a few seconds. The data behind most problems, when visualized correctly, will hit you like a ton of bricks.

We’ve talked a lot about web logging. Web logs are important in their own way; however, a smoothly running architecture has a plethora of logs encompassing just about every possible aspect of the system.
If you log in to a server that you don’t pay much attention to and spend about 15 minutes poring over the various logs on the machine, you are almost guaranteed to find something out of line. Modern UNIX and Windows deployments have so many moving parts that it is easy to lose track. Centralized logging can provide a single portal through which the normal day-to-day operations can be audited.
When a machine begins to exhibit unexpected behavior, the first thing that any systems engineer (developer, DBA, network admin, systems admin) will do is log in and look around. However, if the machine is truly misbehaving, we often find ourselves unable to access it; but, you could access the logs, if they were being written elsewhere.
To any seasoned systems admin, I’m describing all the benefits of using syslog to log events to a remote logging server. I hope that reading the previous sections of this chapter enlightened you regarding what can be accomplished when logging is performed via a multiple-subscriber communications medium such as Spread.