Chapter 4 Queueing Theory
The joy of engineering is to find a straight line on a double logarithmic diagram.
—Thomas Koenig
We notice that queueing theory garners polar reactions; some find it inconsequential (for development) while others find it useful to motivate or apply lean product development.
Chapter
• Queue Management to Reduce Cycle Time 96
• Hidden Batches: Eyes for Batches 110
• Hidden Queues: Eyes for Queues 111
• Indirect Benefits of Reducing Batch Size and Cycle Time 112
• Applying Queue Management in Scrum 115
Queueing theory offers insight into why traditional product development is unnecessarily slow—and what to do about it. We very occasionally coach web-application groups where—really—the maximum effort for a feature is half of one person-day. They do not have a major large-batch problem. But in large products one feature (before splitting) may be “add support for HSDPA protocol” or “add support for PDF version 1.7.” In such domains, it is particularly helpful to see that large batches and long queues exist, and that something can be done to improve. This thinking tool is relevant for large products because big variable batches of work have a nonlinear impact on cycle time—they can really mess things up.

An interesting incongruity: Queueing theory—the mathematical analysis of how stuff moves through a system with queues—was developed to understand and improve throughput in telecommunication systems—systems with lots of variability and randomness similar to product development. As a consequence, telecommunication engineers understand the basic insights. And yet, telecom infrastructure development people (telecom is a domain of large products) do not always see that it applies to them to reduce the average cycle time in their development system.
Toyota people understand statistical variation and the implications of queueing theory; this is reflected in the lean leveling principle to reduce variability and more generally in the lean focus on smaller batches and cycle times to move toward flow. As will be evident, Scrum supports the management implications of queueing theory.
Before diving directly into the subject, note that lean is sometimes described as focusing on smaller batch (work package) size , shorter queues , and faster cycle time. Delivering value quickly. Lean is much more than this—the pillars are respect for people and continuous improvement resting on a foundation of manager-teachers in lean thinking. Queue management is a mere tool far removed from the essence of lean thinking. That said, faster cycle time is part of the “global goal” in lean: Sustainable shortest lead time, best quality, most customer delight, lowest cost, high morale, safety. So, on to cycle time...
Try...Compete on Shorter Cycle Times
A lean product development organization is focused on value throughput in the shortest possible sustainable cycle times , focused on the baton rather than runners. Toyota people, the progenitors of lean thinking, are masters of faster and faster (shorter) cycle times without overburdening people.
What are some process cycles or cycle times in product development?
• “concept to cash” for one release
• “concept to done” for one feature
• potentially shippable time—how frequently could you ship?
• integration time (to integrate and fully test the product)
• compile time (of all the software)
• “ready to pilot” to delivery time
• deployment time for testing (into embedded hardware)
• analysis and design times
Key performance indicators (KPIs) in lean are not focused on the utilization of workers doing these processes. Rather, lean KPIs focus more on throughput cycle times—the baton rather than the runners.
That said, a caution: Measurement usually generates dysfunction or ‘gaming’ of the system by sub-optimizing to appear to achieve a good score [Austin96]. This is especially true on ‘lower’ process cycles. Higher-level cycle times such as potentially shippable cycle time and “order to cash” or “order to delivery” (the quintessential cycle times) are most relevant.
What would it mean if you could deliver in half or a quarter of the time at a sustainable pace without overburdening people? And on the other hand, what is the cost of delay?
Consider the benefits of delivering fast in terms of life cycle profits, opportunities gained, response to competition, and innovation. For most companies—not all—it would be an extraordinary advantage.
Half the time is not half the cost—When people hear “half the time” they may think, “Twice as many products, features, or releases—twice the old efficiency.” But there could be more transaction cost, the overhead for each cycle. Shipping more frequently might increase testing or deployment costs—or not, as will be seen.
Economic model includes cycle time—How to consider the trade-off of shorter cycles versus transaction costs? Use an economic model of your product that includes cycle time factors [SR98]. Suppose you could ship six months sooner. What are the estimated total life cycle profit impact and the increased testing costs (transaction cost)? If you could gain $20 million at a 40 percent increase in testing costs ($1.3 million), it is money well spent. The flip side of this is the cost of delay. One product study showed a 33 percent loss of total profit due to a six-month delay [Reinertsen83]. Unfortunately, many product groups we work with do not seriously analyze cycle time factors in their life cycle profit economic model.
Half the time is not twice the cost—Before you put away your spreadsheet on the transaction cost analysis, hold on. There is a subtle connection between cycle time, transaction cost, and efficiency that will soon be explored—a secret behind the impressive efficiency of Toyota and other lean thinking enterprises...
Queue management—There are plenty of strategies to reduce cycle time; both lean and agile practices offer a cornucopia of skillful means. One tool is the subject of this chapter—queue management.
Queue Management to Reduce Cycle Time
“Queues only exist in manufacturing, so queueing theory and queue management don’t apply to product development.” This is a common misconception. As mentioned, queueing theory did not arise in manufacturing but in operations research to improve throughput in telecom systems with high variability. Furthermore, many development groups—especially those adopting lean or agile practices—have adopted queue management based on queueing theory insight for both product development and portfolio management. One study from MIT and Stanford researchers concluded:
Business units that embraced this approach [queue management for portfolio and product management] reduced their average development times by 30% to 50%. [AMNS96]
Queues in Product Development and Portfolio Management
Example queues in development and portfolio management?
• products or projects in a portfolio
• new features for one product
• detailed requirements specifications waiting for design
• design documents waiting to be coded
• code waiting to be tested
• the code of a single developer waiting to be integrated with other developers
• large components waiting to be integrated
• large components and systems waiting to be tested
In traditional sequential development there are many queues of partially done work, known as work-in-progress or WIP queues; for example, specification documents waiting to be programmed and code waiting to be tested.
In addition to WIP queues , there are constrained-resource or shared-resource queues, such as a backlog of requests to use an expensive testing lab or piece of testing equipment.
Queues Are a Problem
First, if there are no queues—and no multitasking that artificially makes it appear a queue has been removed—then the system will move toward flow, the lean principle and perfection challenge that value is delivered without delay. Every queue creates a delay that inhibits flows. More specifically, why are queues a problem?
WIP queues—WIP queues in product development are seldom seen as queues for several reasons; perhaps chief among these is that they tend to be invisible—bits on a computer disk. But they are there—and more importantly they create problems. Why?1.
• WIP queues (as most queues) increase average cycle time and reduce value delivery, and thus may lower lifetime profit.
• In lean thinking, WIP queues are identified as waste—and hence to be removed or reduced—because:
— WIP queues have the aforementioned impact on cycle time.
— WIP queues are inventory (of specifications, code, documentation, ...) with an investment of time and money for which there has been no return on investment.
— As with all inventory, WIP queues hide—and allow replication of—defects because the pile of inventory has not been consumed or tested by a downstream process to reveal hidden problems; for example, a pile of un-integrated code.
— We saw a traditional product group that spent about one year working on a “deal breaker” feature. Then product management decided to remove it because it threatened the overall release and the market had changed. Replanning took many weeks. In general, WIP queues affect the cost and ability to respond to change (deletions and additions) because (1) time and money were spent on unfinished deleted work that will not be realized, or (2) the WIP of the deleted item may be tangled up with other features, or (3) a feature to add can experience a delayed start due to current high WIP levels.
As will be explored, there is a subtle but potentially powerful systems-improvement side effect that can occur through the process of eliminating WIP queues.
Shared resource queues—In contrast to WIP queues, these are more often seen as queues—and seen as a problem. They clearly and painfully slow people down, delay feedback, and stretch out cycle times. “We need to test our stuff on that printer. When will it be free?”
Try...Eradicate queues by changing the system
The bottom line is that (usually) queues are a problem. Given that, you may jump to the conclusion that the first line of defense against this problem is to reduce the batch and queue size , because these are classic queue-management strategies. Yet, there is a Gordian Knot solution that should be considered first...
The remainder of this chapter will indeed explore reducing cycle time through batch- and queue-size management. But that entire management strategy should be Plan B. Rather, start with Plan A :
Think outside the current box and shorten cycle times by changing the system so that queues no longer exist—by removing bottlenecks and other forces that create the queues. These constraints and the queues they spawn may be created or eradicated by the very nature of a development system and its tools.
Suppose the existing system is based on sequential or serial development with single-specialist workers or groups. There will be WIP queues: The analyst group hands off specification work packages to the programming group that hands off code work packages to the testing group. The inside-the-box response to improving cycle time with queue management is to reduce batch size, reduce variability, and limit the WIP queue sizes between these groups.
But there is a deeper alternative that will more dramatically improve cycle time: Discard that system and the bottlenecks and WIP queues it spawns. If you adopt cross-functional feature teams that do complete features (analysis, programming, and testing) without handing off work to other groups, and that apply automated acceptance test-driven development (TDD), the above WIP queues vanish by moving from serial to parallel development.
Avoid...Fake queue reduction by increased multitasking or utilization rates
Suppose you are busy working on item A, and items B, C, D, and E are in your queue. Fake queue reduction is to work on all these items at more or less the same time—a high level of multitasking and utilization. Multitasking is one of the lean wastes because as will be soon seen, queueing theory shows that this would increase average cycle time, not reduce it. Bad idea.
Do not increase multitasking2. or utilization rates to create the illusion that queues have been reduced and the system has improved; rather, improve the system so that the bottlenecks and other forces that create queues are removed.
After Plan A, What Queues May Remain?
Traditional WIP queues can be eliminated by the move to Scrum with cross-functional feature teams and the use of acceptance TDD. Banished and vanished via Plan A—change the system. Still, queues can and do remain:
• shared-resource queues, such as a testing lab
• the queue of feature requests in the Product Backlog
• WIP queues because (1) Plan A is not yet possible (deep change in large product groups takes time), or (2) tools and techniques, such as moving from manual to fully automated testing, are weak and slow to improve
Whatever queues remain—and at the very least, the Scrum Product Backlog will remain—you can improve average cycle time by Plan B in queue management...
Try...Small batches of equal size
In Scrum, a smaller batch means a smaller work package of items or features to develop in an iteration. Equally sized batches imply that each is estimated to be roughly equal in effort.
Concretely, how to apply this in Scrum? That will be explored later in the chapter, but first, on to the field of queueing theory...
Queueing Theory
It might take hard work or a new perspective, but it doesn’t take much theory to “manage queues” by eradicating them. On the other hand, when they must still exist, it is helpful to know how to deal with them with the thinking tool of queueing theory.
A Formal Model for Evaluating Processes
You may accept at face value that queues with smaller feature-batches of equal size improve average cycle time. Or not. In any event, it is useful to know that this suggestion is not based on opinion but is grounded in a formal mathematical model that can be demonstrated. It is possible to reason about some aspects of a development process, using a formal model. For example:
• Hypothesis: It is fastest to do sequential (‘waterfall’ or V-model) development with large-batch transfers between groups.
• Hypothesis: It is fastest for people or groups to have high utilization rates and multitask on many projects at the same time.
An understanding of queueing theory, independent of opinion, can reveal if these hypotheses help reduce average cycle time.
The topic is relatively simple; a scenario captures key elements...
Qualities of a Stochastic System with Queues

Consider Los Angeles or Bangalore at rush hour. By some miracle there are no accidents and all lanes are open. Traffic is tight and slow, but moving. Over a short period of time, there are accidents on three different major four-lane highways (twelve lanes), and three lanes are closed—only nine lanes are still open. Boom! Before you can say, “Why didn’t I buy a helicopter?” much of the city does a phase shift into gridlock. When the accidents are finally cleared (ranging from thirty to sixty minutes later), the massive queue buildup takes forever to clear. Observations:
• Nonlinear—When the highway is from zero to fifty percent loaded, it is smooth sailing—virtually no queues or delays. But between fifty and one-hundred percent, slowdown becomes noticeable, queues build up. The relation of utilization to queue size is nonlinear, not a smooth linear increase from zero.
• Delay and overload does not start at 99.99% utilization—It is not the case that everything goes fast and smooth on the highway until just before 100 percent capacity of cars on the road. Rather, things slow down and gridlock happens well before capacity is reached.
• Clearing the queue takes longer than making it—Forty-five minutes of blockage in Los Angeles at rush hour creates queues that take more than forty-five minutes to clear.
• Stochastic, not deterministic—There is variation and randomness with probabilities (it is a stochastic system): arrival rates of cars, time to remove blocks, exit rate of cars.
This is worth spelling out if you wish to grasp how systems behave, because it seems all us humans do not have an intuitive sense of the stochastic and nonlinear quality of systems with queues. Gut instinct may be that they are deterministic and behave linearly. This incorrect “common sense” leads to thinking mistakes in analyzing problems and managing product development. These observations—and thinking mistakes—apply to WIP queues in traditional product development and to virtually all other queues.
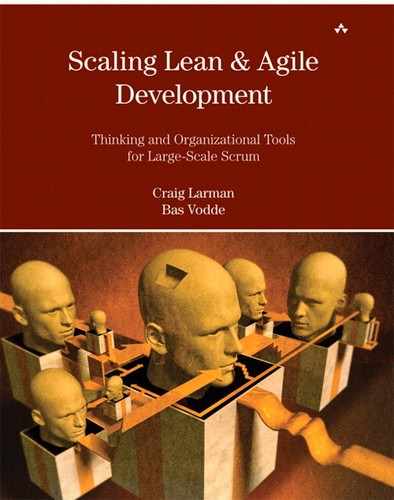
One common thinking mistake in product development is that the queues, delay, and the people that serve them behave as in Figure 4.1—the misunderstanding of “delay only starts when the highway is 100 percent full.” But slowdown starts happening on the highway long before it is 100 percent full. Perhaps at 60 percent capacity, you start to notice slowdown—a longer average cycle time.
Figure 4.1. a common myth or thinking mistake regarding queues in systems with variability
With the misunderstanding “delay only starts when the highway is 100 percent full ,” there is a misguided focus on trying to improve cycle time by increasing resource utilization—getting the people in product development to be more busy, usually by more multitasking. This is the mistake of watching the runner rather than the baton.
What really happens to average cycle time when one increases the utilization level of things or people in a system with variability?

At Xerox they have expensive, large digital print presses in a test lab. There is often a shared-resource queue of testing requests for one of these devices. Without understanding how queues really work (that is, believing they work as in Figure 4.1), the management approach would be to encourage that these expensive systems are reserved and utilized close to 100 percent of the time. But the reality is that there is variability all over the place—a stochastic system. Tests arrive randomly, some fail quickly, some take forever to complete, sometimes the equipment breaks, and so forth. This same variability of behavior applies to people and the queues of work that they work on.
Modeling a Basic Single-Arrival System with Queues
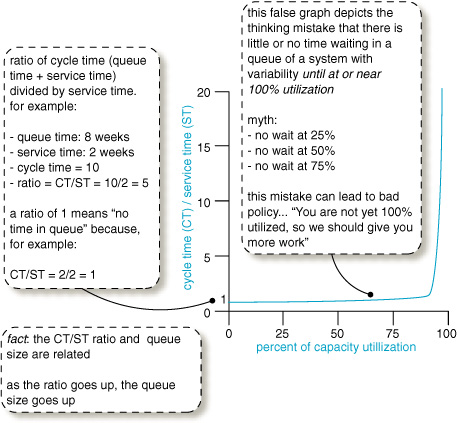
How do these systems behave—in traffic, test labs, or traditional development with people working on WIP queues? You have a sense of it from the traffic story. Mathematically, the behavior may be modeled as variations of M/M systems. M/M means that the inter-arrival rate into the queue is Markovian and the service rate is Markovian.3. A common, basic queueing model is M/M/1/∞—it has one server (for example, one test printer or team) and an infinite queue.4.
Now it starts to get interesting... In a M/M/1/∞ system, how does cycle and service time relate to utilization of the server—be it a test printer or people working on WIP queues? Figure 4.2 shows the behavior [Smith07].
Figure 4.2. waiting behavior for a basic M/M/1/∞system
These are averages in Figure 4.2, because elements have random variability, such as:
• requests arrive at different times with different effort
• tests or programming effort take variable time
• people work faster or slower, get sick, or work longer or shorter
The essential point to grasp is that an item (such as a requirement request) starts sitting in a queue waiting for service long before people are 100 percent utilized. It is also fascinating to see the impact of increased utilization of people on cycle time: As utilization goes up in a system with lots of variability, average cycle time gets worse, not better. This is counterintuitive to an average accountant or management consultant who has been taught to “improve productivity by increasing utilization of resources.” Most have not been exposed to queueing theory—how to understand stochastic systems with queues (people doing work with variability)—and so demonstrate a thinking mistake.
Modeling a Batch System with Queues (Traditional Development)
It gets even more interesting (if you could believe that)... The basic M/M/1/∞ system assumes that a single item (for testing, analysis, programming, ...) arrives in isolation—that arriving items are never clumped (or batched). Yet in traditional product development, work packages do arrive in big clumpy batches, such as sets of requirements or testing work or code to be integrated. Or an apparent ‘single’ requirement is received such as “provide HSDPA support” that is in fact itself a batch of sub-requirements.5.
Probably obvious, but it needs to be said:
As work-item size or batch size increases, variability increases.
One mega-requirement, more variability. A big batch of requirements, more variability. Big pile of code to integrate or test, more variability. And if you are involved in budgeting or finance... A big pile of budgets, more variability.
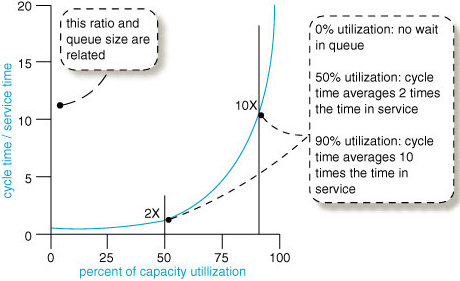
What effect does this increased size variability have on queues and waiting time? Now, instead of the simpler single-arrival M/M/1/∞model (a single work item arrives), we have a Mx]/M/1/∞system (a batch of items arrive). This model is a better analogy to traditional product development. Example behavior is shown in Figure 4.3.
Figure 4.3. waiting behavior in a Mx]/M/1/∞ system, analogous to traditional development with variable batches
At first glance, people may not grasp the startling and counterintuitive implication of what just happened to their cycle time.
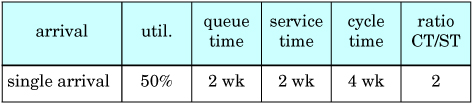
A scenario may help: Suppose a person or team is currently 50 percent utilized and you usually give them single small-sized requirements now and then that arrive with some randomness and some variability in size. Assume it will take them two weeks of hands-on work to complete a particular requirement-X. And assume it is the simple single-arrival system modeled in Figure 4.2 (and repeated in the lower curve of Figure 4.3).
As a table, here is an approximation of the average situation:
Next, instead, suppose that you are typically giving the 50-percent utilized team significantly bigger batches of requirements, or ‘one’ giant requirement that actually encompasses a big batch of sub-requirements; these arrive with some randomness and size differences. Assume it will take twenty weeks of hands-on service time to complete some particular batch-X or ‘single’ big requirement.
Knowing the prior table, this is what some people will predict:
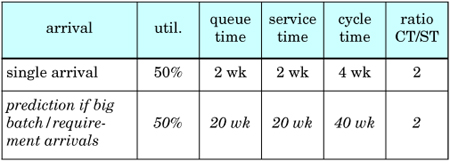
A gut instinct prediction is a linear increase in the cycle-time impact. Ten times as much work on average being pushed through the system, so ten times the cycle time. Four weeks versus 40 weeks.
But it does not work that way, because more variability is introduced into the system. A much bigger batch or much bigger ‘single’ requirement that encompasses many sub-requirements means more variability within the batch, and of course batches can arrive of different sizes. So what happens?
At 50 percent utilization, the cycle-to-service-time ratio is ‘5’ in the Mx]/M/1/∞ example. This approximates the contrasting situations:
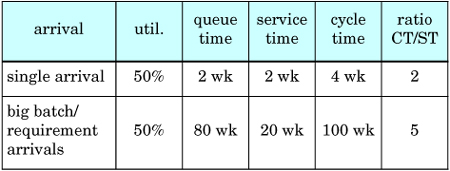
Things just got a lot worse. Of course, these are averages and cannot be assumed for any one real case, and this model is a simplified abstraction of development. But this is why understanding—and acting on the insight—of queueing theory is vital for large-scale development, because large systems are often associated with big requirements, and big work (requirements, testing, integration, ...) in big batches arriving at variable times. That can have an astonishing impact on average cycle time.
And as explored earlier, pushing for high utilization rates of your workers in this situation with big batches of work is a recipe for... blackstrap molasses in Alaska.
The reality is a nonlinear increase in cycle time. This impact on delay and queue size defies our instinct because people are not used to analyzing stochastic systems with queues. One might think, “If I make the work package ten times bigger, it will take ten times as long to exit the system.” Do not count on it.
Series of WIP Queues Aggravate Delays— These delays are further aggravated in traditional sequential development because there are a series of processes with WIP queues in front of them; this compounds the variability and adds more negative impact to the overall average cycle time. The Law of Variability Placement [HS08] reveals that the worst place for variability (in terms of negative cycle-time impact) is at the front end of a multi-stage system with queues. This is what happens in phase-one requirements analysis with large batches of specifications.
Conclusion
So, what has been learned?
• product development is a stochastic system with queues; it is nonlinear and non-deterministic
• behavior of a stochastic system with queues defies our instincts
• batch size, size of requirements, and utilization levels affect queue size and cycle time in nonlinear random ways that are not obvious—throughput can get slow if not understood
• queue size affects cycle time
• in a variable system, high utilization increases cycle time and lowers throughput—it does not help; a traditional resource management approach [for example, McGrath04] can make things worse by focusing on the runner rather than the baton
• a system with variability and a series of processes and WIP queues further aggravates the delay; this situation describes traditional sequential development
• variability at the front end of multi-step system with queues has the worst impact
Hidden Batches: Eyes for Batches
If you bake three cherry pies at the same time, then it is clear that there is a batch of three items. Things are not so clear in product development: What exactly is ‘one’ requirement? At one level, “a 600 DPI 12 PPM color printer” is one requirement, but it is also a composite requirement or a batch of sub-requirements that can be split; for example, into “a 600 DPI color printer.” Decomposition of a ‘single’ large composite requirement is especially relevant (and easy) in software systems. This topic, and its connection to representing very large requirements as user stories that can be split, is considered in the Requirements chapter of the companion book. For now, the key point to appreciate is that ‘one’ requirement—especially in large software-intensive embedded systems—is almost always itself a batch of sub-requirements. These hidden batches need to be seen.

Large variable-sized batches are bad for cycle time. Single large items with variability are bad for cycle time. Variation in size of batches or items is bad for cycle time. So, the implication for queue management in Scrum is this:
Hidden Queues: Eyes for Queues
When people join Toyota, they learn “Eyes for Waste.” They learn to see things as waste that they had not considered, such as inventory—queues of stuff. Now, queues of physical things are easy for people to perceive, and to perceive as a problem... My goodness, there’s a gigantic pile of Stuff queuing up over there! Making any money from the pile? Are there defects in there? Does it need to be combined with other stuff before we can ship it? Do we need—and will we make money with—each and every item in the pile?
Invisible queues—In traditional development there are also all kinds of queues, but because they are invisible they are not seen as queues or keenly felt as problems. If you are a business person who has invested ten million euros to create a gigantic pile of partially done Stuff sitting on the floor, not making any money, you walk by it and see it and you feel the pain and urgency to get it moving. And you think about no longer making big piles of partially done stuff. But product development people do not really see and feel the pain of their queues.
Yet, they are there. Queues of WIP—information, documents, and bits on a disk. Invisible queues. Product development people need a lesson in “Eyes for Queues” so that they can start to perceive what is going on, and develop a sense of urgency about reducing queue sizes.
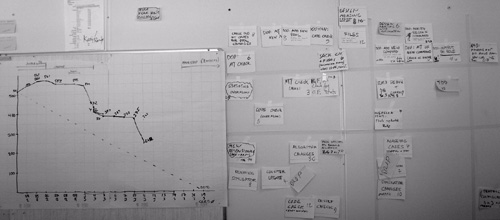
Visual management for tangible queues6.—To develop “eyes for queues” and a sense of attention, one lean practice is visual management , making physical tokens (not tokens in a computer program7.) for these queues. For example, in Scrum and other agile methods, it is common to represent all the tasks for the iteration on paper cards that are placed on the wall and moved around as tasks are completed (Figure 4.4). Physical tokens. Putting these tasks into today’s computers8. defeats the purpose of lean visual management and the way humans—with countless eons of evolutionary instinct working with concrete things—need to see and feel tangible queues.
Figure 4.4. lean visual management creates physical tokens, such as task cards and paper charts on a wall, so that invisible queues can become tangible—really seen and felt
Indirect Benefits of Reducing Batch Size and Cycle Time
“Why bother? Our customers don’t want a release every two weeks, nor do they want just a sub-requirement.”
We get this question regularly from product groups and business people. They do not yet appreciate the advantages of small batches in short cycles:
• The overall larger release-cycle-time reduction that can come by eradicating queues and by applying queue management so that many development cycles are shorter.
• The elimination of batch delay, where one feature is unnecessarily held back because it is moving through the system attached to a larger batch of other requirements. Eliminating this provides another degree of freedom for the business to ship a smaller product earlier with the highest-priority features.
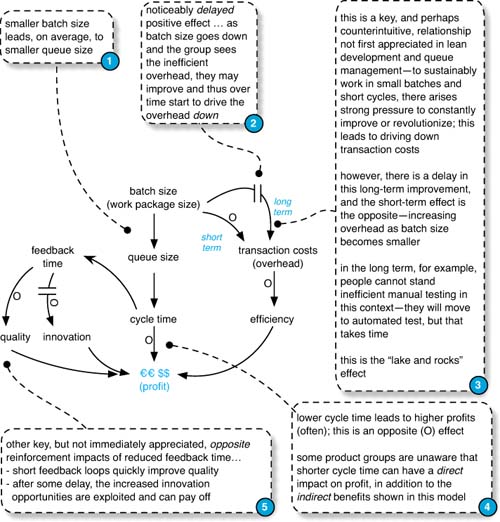
• And last but not least, there are indirect benefits due to the “lake and rocks ” effect described next.
Indirect Benefits: The Lake and Rocks Metaphor
A metaphor shared in lean education: lake and rocks. The depth of the water may represent the inventory level, batch size, iteration length, or cycle time. When the water is high (large batch or inventory size, or iteration length), many rocks are hidden. These rocks represent weaknesses. For example, consider an eighteen- month sequential release cycle with a massive batch transfer; inefficient testing, integration, and poor collaboration are all hidden below the surface of such a long cycle and such a large batch. But if we work with that group and ask, “Please deliver a small set of small features that is potentially shippable in two weeks, every two weeks,” then suddenly all the ineffective practices become painfully obvious.

Said another way, the transaction cost (overhead cost) of the old process cycle becomes unacceptable. That pain then becomes a force for improvement, because people cannot stand re-experiencing it each short cycle, and indeed it may simply be impossible to the iteration goals with the old inefficient system of development.
Tip : Not all ‘rocks’ are big or immediately visible. The lean journey—and the journey of Scrum—is to start with the big rocks that are most painfully obvious yet movable, and over time work on smaller impediments.
The causal loop diagram in Figure 4.5 illustrates this lake and rocks effect in terms of a system dynamics model.
Figure 4.5. indirect and delayed benefits of reducing batch and cycle size
Applying Queue Management in Scrum
There are dozens of strategies to manage queues. Managing the Design Factory by Don Reinertsen explains many. However, we want to focus on a few key steps in a Scrum context:
1. change the system to utterly eradicate queues
2. learn to see remaining queues with visual management
3. reduce variability
4. limit queue size
Change the system— (see p. 98). Must you manage existing queues? Step outside the box. For example, Scrum feature teams and acceptance TDD eliminate many queues in traditional development.
Reduce variability— (see p. 117). Some people first try to reduce work queues by increasing utilization or multitasking (with negative results), or by adding more developers. True, adding people—if they are talented—can help (there are exceptions), but it is expensive and takes time. People who have grasped queue management recognize a simpler place to start in Scrum: Reduce variability, which includes reduction in batch size.
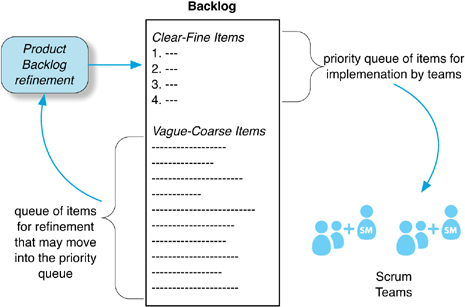
A Closer Look at the Product Backlog as a Set of Queues
It is possible to view the Product Backlog as one big near-infinite priority queue9., but we suggest a more fine-grained view. It has distinct subsets. One view is that it contains two backlogs: (1) the Release Backlog for the current release, and (2) the “future backlog.” A second perspective is that the Product Backlog contains the following two subsets:
• the clear-fine subset10. of user stories that are clearly analyzed, well estimated, and fine grained enough to do in one iteration (or less)
• the vague-coarse subset of coarse-grained user stories needing more analysis, estimation, and splitting before entering the clear-fine subset
The Release and future backlogs may both contain clear-fine and vague-coarse user stories. At the start of a release cycle, the Release Backlog typically contains mostly vague-coarse user stories, and iteration by iteration they are refined into clear-fine stories, and then implemented.
This leads to some key points (illustrated in Figure 4.6):
• It is common—and advisable—in Scrum to prioritize only the clear-fine subset of the Release Backlog.
• In Scrum, this “clear-fine priority queue” is the critical queue of implementation work before the teams.
• The vague-coarse subset of the backlog is a feeding queue of user stories into a backlog refinement process that adds high-quality small stories to the clear-fine subset.
Figure 4.6. Product Backlog contains several queues
Try...Reduce the variability in Scrum
Before getting carried away with the idea of variability reduction—new development is not manufacturing; without variation nothing new happens or is discovered. It is both appropriate and inevitable that there is variability in research and development. However, there are indeed varieties of variability than can be diminished—the topic of this section. In the terminology of Edwards Deming, there is common-cause variation and special-cause variation. The first category is common noise variation in the process, and not easy to assign a specific cause. On the other hand, special-cause variation— also known as assignable variation—can be identified. For example, variation in feature-request size is special-cause variation. By reducing identifiable special-cause variation—in Scrum or work processes —a system with queues has improved average throughput.
Variability is one of the three sources of waste in lean thinking (the other two are overburden and non-value-add actions ). With an understanding of queueing theory, it may be clearer why variability is considered a source of waste.
What are some sources or kinds of variability in Scrum?
• big batches and big user stories
• ambiguity of what a user story means
• ambiguity of how to implement a story
• different (estimated) efforts for different stories
• number of stories in the Release Backlog clear-fine priority queue
• estimate-versus-actual effort variance, which can reflect what/ how ambiguity, unskillful estimation, learning, and much more
• the arrival rate of user stories into the clear-fine priority queue of the Release Backlog
• team and individual variability
• overloading or failure of shared resources, such as a testing lab
... and more. In queueing-model terminology, they usually boil down to variability in the service and arrival rate.
In lean thinking, flow is a key principle—and flow requires reduction or elimination of variability. That is why leveling is also a lean principle; it is an antidote to variability and helps move toward flow.
This leads to some variability-reduction suggestions in Scrum:
Reduce variability by a small queue (buffer) of clear-fine, similar-sized user stories in the Release Backlog— In the Lean Thinking chapter, it was explained that a small buffer of high-quality inventory is used in lean systems to smooth or level the introduction of work to a downstream process. This inventory (a temporarily necessary waste) positively supports level pull because the Scrum feature teams now have a queue of similar-sized stories to work on; no waiting and fewer surprises. Stories in the vague-coarse subset of the Release Backlog have high what/how ambiguity and are large; so choosing those for implementation is unskillful because it increases variability.
Reduce variability by holding a “five percent” Product Backlog Refinement Workshop each iteration—One of the less-known guidelines in Scrum is to dedicate at least five percent of duration of each iteration to requirements analysis, user story splitting, and estimation or re-estimation. This is done for user stories for future iterations, not the current iteration, and may be done in a Product Backlog (PB) Refinement Workshop. This reduces what/how ambiguity or variability, plus reduces estimation variability because re-estimation may improve as people learn.
see Requirements in companion book
During this workshop, split items into small and equally sized user stories. A big ‘single’ requirement is actually a hidden batch. For example, the ‘one’ story “...HSDPA protocol support...” can be split into smaller customer-centric user stories. This reduces batch size and its attendant variability. It also reduces batch delay—the artificial holding back of an important sub-feature because it was stuck to a larger batch of features, some of which are less important.
This repeating workshop also creates a regular cadence of adding clear-fine stories to the queue, reducing variability in arrival rate.
Reduce variability by stable feature teams—Use stable long-lived feature teams in Scrum to reduce the variability in the ‘servers’—the teams. Also, the cross-functional, cross-component feature teams increase parallelism and flow because a user story can flow to any one of several available teams.
Reduce variability by timeboxed effort-boxed learning goals—This tip is most useful in domains with large research-oriented requirements. It reduces what/how ambiguity and variability.
Sometimes non-trivial investigation is needed just to start to understand a feature. For example, we were once consulting at a site in Budapest; the mobile-telecom product group wanted to provide “push to talk over cellular.” The international standards document for this is thousands of pages. Just to vaguely grasp the topic is a formidable effort. One approach is to ask a team to “study the subject.” Yet, that is fuzzy unbounded work that will introduce more service variability and may expand into the lean waste of over-processing. An alternate approach—our suggestion—is to offer the team a timeboxed and effort-boxed goal to learn. Perhaps the concrete goal is to present a research report at the end of the iteration, in addition to their work implementing user stories. For example, “introductory report on push to talk, maximum 30 person hours.” A leveled amount of effort is put into the research and learning, balanced with the team also implementing user stories. The Product Owner Team may then decide to invest more bounded effort into another cycle of research in a future iteration (probably more focused as the subject clarifies), until finally the subject is clear enough for people to start writing, splitting, and estimating user stories.
Other Benefits of Reduction in Variability
Another benefit of all this variability reduction is improved prediction (estimation) of the duration of the release.
Finally, it allows higher utilization of teams. Queuing theory predicts that irregularly loading large high-variability batches of big requirements onto groups and then pushing for high levels of utilization or multitasking increases cycle time. Avoid that.
On the other hand, queueing theory predicts that utilization can be higher without negative cycle-time impact if there was leveling or removal of variability in all elements.

Imagine a highway that only allows small, equally sized motorcycles all going the same speed. Bikes only enter the highway one at a time at an even pace controlled by a pacing light on the ramp entrance. This idealized highway—on average—can be more fully utilized while still maintaining good flow than can a typical high-variability highway.
How Small?
If a one-week requirement is better than a one-year requirement, is a one-minute requirement even better?

The way to look at this is the transaction cost or overhead of each batch of work. At some point, the cost or effort of user-story splitting becomes too high or difficult. And the overhead of doing each small story eats away the advantages. That said, it is worthwhile recalling that moving to smaller batch sizes has a subtle indirect benefit to drive down overhead costs over time, as explored on p. 113. And yet, at some point splitting is no longer worth it—though that point will change over time.
Try...Limit size of the clear-fine subset of the Release Backlog
Another queue management technique is to limit queue size. This does not necessarily reduce variability, but it has other virtues. In a traditional development first-in first-out (FIFO) WIP queue, a long queue is a problem because it will take forever for an item to move forward through the queue and eventually be finished—a straightforward reason to limit FIFO WIP queue size.
That problem is less pernicious in a Scrum Release Backlog priority queue , since it can be re-sorted—something just added can move to the head of the list. Still, there are good reasons to limit the number of items in the clear-fine priority queue of the Release Backlog:
• A long list of fine-grained complex features is hard to understand and prioritize. In large-product development, we regularly hear complaints from the Product Owner Team that the backlog is too big for them to “get their head around.”
• A big backlog of clearly analyzed, finely split and well-estimated user stories has usually had some investment in it, proportional to its size. It is inventory with no return on that investment. As always with inventory, that is a financial risk.
• People forget details over time. All the user stories in the clear-fine subset have been through in-depth analysis in PB Refinement Workshops. If that list is short, there is a good chance that the Scrum Team implementing the story has recently analyzed it in a workshop, perhaps within the last two months. If the queue is very long and growing, there is a greater chance the team will take on a story analyzed long ago. Even though there will probably be written documentation that was generated long ago in the workshop, it will of course be imperfect, and their grasp of the details will be hazy and stale.
Theory of Constraints
Theory of Constraints (TOC) is a management system originally created for manufacturing [Goldratt84]. It is mentioned here because TOC also deals with bottlenecks, cycle time, batch size, and queues.
A key idea of TOC is that there is always at least one—usually just one—primary constraint (or bottleneck) that limits throughput or performance of a system. The constraint may be in a physical form, in some knowledge work, or in a policy—and there will usually be a queue building up behind it. Broadly—and at risk of gross oversimplification—the journey of applying “basic TOC” is to find that one dominant constraint or bottleneck, reduce it so it is no longer dominant, and then look for the new primary constraint. Repeat forever. There is much more, but space prevents a thorough treatment.
Basic TOC has appealing logic to it, such as focusing on the major bottleneck and reducing it. Try that.
Some people who write about TOC primarily focus on the simple idea of “remove the dominant constraint” and a few other straightforward tools. No problem.
But... the story gets messy. Some promote TOC for project management without having seen the full picture in action. In the 1990s Goldratt extended TOC to project management for product development work [Goldratt97]. Here is a key point: Official “project management TOC” is more than what is described in the books, and involves specialized courses, tools, and coaching from the Goldratt Institute or authorized providers. It includes a relatively complex and detailed plan-and-control centralized management system with detailed task assignment to people, intensive upfront estimation and scheduling in detailed Gantt charts, and several other traditional management practices. Bottom line: We have seen two very large official “project management TOC” adoption attempts (and heard of one more) in companies developing software-intensive embedded systems. Big companies with large product groups. The management was educated formally in the method, tools were purchased, TOC consultants tried to help. The practice was clearly heavy, not agile, and not lean. In all three cases, the approach was eventually found cumbersome and not very effective, and was dropped.
Conclusion
Queue management can become a hammer so that you go looking for queue nails. Resist the temptation to manage existing queues—that is an inside-the-box response to the problem. Rather, consider doing system kaizen so that the underlying system is changed in some way so that queues can no longer form or exist. Parallelizing with cross-functional teams and acceptance test-driven development are common examples, but there are more. Only apply queue management—a point kaizen tactic—when you cannot eradicate a queue.
Recommended Readings
There are dozens, if not hundreds, of general texts on queueing theory. More specifically, we suggest readings that make the connection between this subject and product development:
• Managing the Design Factory by Don Reinertsen is a classic introduction on queueing theory and development. Reinertsen has a broad and deep grasp of both product development and business economics and weaves these insights together into one of our favorite books on product development. This is the book that popularized the model of thinking tools for process improvement and organizational change.
• Flexible Product Development by Preston Smith was the first widely-popular general product development book that introduced agile software development concepts—including Scrum and Extreme Programming—to a broader audience. This text includes an analysis of queueing theory and variability, and their relationship to development.