
Chapter 2. Why Is eBPF the Optimal Tool for Security?
In this chapter, we will take you on a journey through pre–cloud native network security and threat detection, how they have changed with the introduction of Kubernetes, and finally, how they can be solved with eBPF.
Precloud Security
Before cloud native became the dominant production environment, network monitoring and threat detection tools were based on auditd, syslog, dead-disk forensics, whatever your network infrastructure happened to log, and optionally, copying the full contents of network packets to disk (known as packet captures).
Monitoring from Legacy Kernel, Disk, and Network Tools
Traditional logging systems such as auditd, are not namespaced in the kernel, so they lack details about which container invoked a system call, started a process, or opened a network socket. Network logs are also not container-aware since pod IPs are ephemeral and can be reused by entirely different apps in different pods—maybe even on different nodes—by the time the investigation starts.
Capturing packets stores every packet in a network to disk and runs custom pattern matching on each packet to identify an attack. Most modern application traffic is encrypted, largely thanks to Let’s Encrypt and service mesh; high-scale environments are now the norm, so packet captures are too costly and ineffective for cloud native environments. Another tool used to monitor for security incidents is disk forensics.
Disk forensics collects a bit-for-bit duplication of a volume or disk during incident investigation with the goal of useful artifact extraction. Forensics artifacts are “the things left behind unintentionally, unconsciously, often invisibly, that help us get to the bottom of an incident.”1 While a lot of useful information can reside on-disk, the artifacts can be fairly random, and you don’t get the luxury of defining what data you would like to collect. Thus, you’re left with a literal snapshot of artifacts that exist at the time of capture. Artifacts in memory are lost altogether unless they’re paged to disk.
Memory forensics started by focusing on a new class of in-memory attacks; however, most operating systems now deploy kernel address space layout randomization (KSLR)2 that complicates introspection of kernel memory and thus gives you only a partial solution.
Contrast this with eBPF, a native kernel technology that allows you to trace or execute mini programs on virtually any type of kernel event.3 This enables capturing security observability events with a native understanding of container attributes like namespaces, capabilities, and cgroups. Fully customizable programs that run at kernel events, like a process being created, allow us to have a flexible and powerful runtime security framework for containers.
A Cloud Native Approach
Using eBPF, you directly attach to kernel code paths and collect only the security observability events you define in near real time with no disruption to the application. Later, these events are sent to userspace and can then be shipped to permanent storage for analysis, threat hunting, incident investigation, or building out security policy.
eBPF programs enable Kubernetes support by bundling API “watcher” programs that pull identity metadata from the Kubernetes API server and correlate that with container events in the kernel. This identity includes pod names, Kubernetes namespaces, container image IDs, and labels. This identity-aware metadata identifies which pods are associated with security events across the entire cloud native environment.
For example, you can trace the full lifecycle of both processes and network sockets or pods from start to finish. This identity-aware security observability can give you a historical view of every process execution and network connection across your cloud native environment with low storage requirements.
Deep Dive into the Security of eBPF
The challenges of the traditional security tooling that were introduced by the adoption of cloud native environments can be solved by using eBPF. But what does this solution look like, and why is it so powerful?
Virtual Machine in the Kernel
Since a pod is just a set of Linux processes running in the context of a kernel namespace, the pod makes system calls and requests to the operating system kernel where eBPF resides. For example, the execve()4 system call is used to launch a new process. If you run curl from a bash shell, a fork of bash invokes execve() to start the curl child process. eBPF allows you to hook into any arbitrary kernel event, run a program on behalf of it, return with the appropriate values, and expose it back to userspace. For example, you can run an eBPF program that executes on the return of the execve() system call; extract metadata like curl binary name, PID, UID, process arguments, and Linux capabilities of the process; and send it to userspace, as shown in Figure 2-1.

Figure 2-1. eBPF program attached to execve() system call
This means eBPF allows you to intercept any kernel event, run customized code on the return value, and react with fully programmable logic. You can think of it as a virtual machine in the kernel with a generic set of 64-bit registers and eBPF programs that are attached to kernel code paths.
eBPF Programs
The eBPF verifier and JIT (just-in-time) compiler are components that ensure that eBPF programs fulfill the following programmability requirements:
- Safety from bugs
-
Before executing the eBPF bytecode (the compiled version of the eBPF program), the kernel takes and passes it through the eBPF verifier. The eBPF verifier makes sure that the loaded program cannot access or expose arbitrary kernel memory to userspace by rejecting out-of-bound accesses and dangerous pointer arithmetic. It also ensures that the loaded program will always terminate to avoid creating an infinite loop in the kernel. If the verifier fails, the eBPF program will be rejected. This mechanism guarantees that the kernel validates and restricts what we load into kernel space, thus we are not able to run arbitrary code inside the kernel with eBPF.
- Continuous delivery
-
After the eBPF program has passed and been approved by the verifier, it goes to the JIT compiler. It takes and compiles the eBPF program to the native CPU that your system runs (for example, x86), which means instead of interpreting bytecode in software, you are now executing a program that runs at the same speed as natively compiled code. After the eBPF program is passed through the JIT compiler, it is attached to a certain system call or to various hook points that you define. This mechanism allows you to replace programs in the Linux kernel dynamically without any change or impact to your applications.
- Performance
-
The last aspect is performance. In case of eBPF, this is achieved by the JIT compiler that translates generic bytecode into the architecture-specific CPU code, providing performance as close as possible to native execution.
These three requirements enable continuous security observability with validated safety from the eBPF verifier and JIT compiler, leaving no impact on the Kubernetes workloads with close to native execution speeds.
eBPF Hook Points
We can attach an eBPF program to a variety of hook points and introspect distinct security observability data at different levels, as seen in Figure 2-2.5
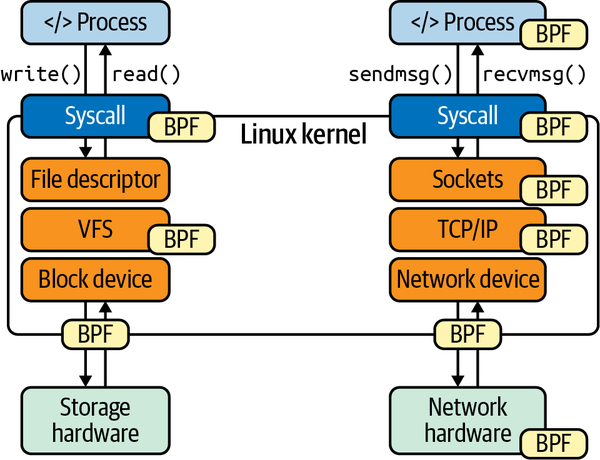
Figure 2-2. eBPF hook points
Starting from the top of the image, you can attach an eBPF program to userspace applications by hooking on uprobes. This means you can run an eBPF program for particular functions in your applications. This is how you can profile applications using eBPF.
Then, you can attach eBPF programs to arbitrary system calls and kernel functions, with kprobes. “Kprobes can create instrumentation events for any kernel function, and it can instrument instructions within functions. It can do this live, in production environments, without needing to either reboot the system or run the kernel in any special mode.”6 Kprobes can include reads and writes to a file, mounting a sensitive filesystem to a container, changing a kernel namespace—which can indicate a privilege escalation—loading a kernel module, creating of a socket, executing a program, and more.
You can also attach to an arbitrary trace point in the Linux kernel. A trace point is a well-known, defined function name of the Linux kernel that will stay stable over time. While kernel functions might change per release, trace points provide a stable API, allowing you to instrument the entire Linux kernel.
You can also instrument at the network device level. For any virtual or physical device, you can attach an eBPF program that gets invoked for every network packet that is being received or sent. This is how tools like Cilium Hubble can provide network observability and network policy in Kubernetes.
Why eBPF?
eBPF collects and filters security observability data directly in the kernel, from memory or disk, and exports it to userspace as security observability events, where the data can be sent to a SIEM for advanced analysis. Because the kernel is shared across all containers,7 these events provide a historical record of the entire environment, from containers to the node processes in a Kubernetes cluster that make up a Kubernetes cluster.
Security observability data includes Kubernetes identity-aware information, such as labels, namespaces, pod names, container images, and more. eBPF programs can be used to translate and map processes, its system calls, and network functions into a Kubernetes workload and identity.
eBPF programs are able to both observe Kubernetes workloads and enforce user-defined security policies. With access to all data that the kernel is aware of, you can monitor arbitrary kernel events such as system calls, network sockets, file descriptors, Unix socket domain connections, etc. Security policies are defined at runtime that observe and enforce desired behaviors by using a combination of kernel events. They can be fine-grained and applied to specific workloads by using policy selectors. If the appropriate policy selectors match, the pod can be terminated or paused for later investigation.
To benefit from the eBPF-based observability and enforcement, end users are not expected to write eBPF programs by themselves. There are already existing projects and vendors creating open source security observability tools that use eBPF programs to provide this observation and even enforcement, such as Tracee and Falco. We will dive deeper into one of them, Cilium Tetragon, and detect a real-world attack scenario in Chapter 3.
System Call Visibility
A system call (also known as syscall) is the stable API for an application to make requests from the kernel. For security observability, we are interested in observing sensitive system calls that an application makes inside a Kubernetes pod but ignore those same syscalls when they’re made by the container runtime during initialization.
Monitoring system calls can help identify malicious behavior in Linux and container runtimes like runC, Docker, and Kubernetes. These malicious behaviors can include:
-
Reads and writes to a sensitive file, which allows you to detect unauthorized access
-
Mounting a filesystem from a container, which allows you to identify privileged access to the host filesystem
-
Changing kernel namespaces, which often reveals privilege escalation
-
Loading a kernel module, which can be a great indicator of an attacker performing local privilege escalation
-
Container changing the host machine values from a container, which is a common technique attackers apply to alter the system time, firewall rules, etc.
Monitoring the most common sensitive system calls used by known exploits could also help you identify certain steps of an attack in a chain of events. For example, observing the madvise(MADV_DONTNEED) system call invoked by the Dirty COW exploit would indicate a certain step from a privilege escalation.8 madvise() takes advantage of a Linux kernel race condition during the incorrect handling of a copy-on-write (COW) feature to write to a read-only memory mapping, thus allowing writes to read-only files. For example, the /etc/sudoers file can be written to, which will add the current user to the sudoers list, thereby escalating privileges. By monitoring the pivot_root system call,9 you can determine whether the attacker has privileged access and is allowed to remount the host filesystem. This would allow the adversary to edit the ~/.ssh/authorized_keys file, add their public key, and maintain a foothold in the system.
Observing system calls with kprobes is resilient against the recent Phantom v1 and v2 attacks. These attacks take advantage of handling the arguments and context of the system call in userspace and allow tampering with incorrect values before they are copied into the kernel.
Network Visibility
Sockets are the operating system representation of communication between applications on the same node,10 between pods and clusters, or on the internet. There are many types of sockets in Linux (IPC, Unix domain, TCP/IP, etc.), but we’re specifically interested in TCP/IP sockets for security observability.
Sockets provide improved identity over network packets because socket events are tracked in the operating system kernel and coupled with process and Kubernetes metadata. This allows you to track all network behavior and associate that behavior with the specific workload and service owner. This identity helps remediate, patch, or lock down a certain pod with network policy if malicious activity is detected.
eBPF can trace the full lifecycle of a socket and corresponding connections for every container in your cluster. This includes visibility for a process listening for a connection, when a socket accepts an inbound connection from a client, how much data was transferred in and out of a connection, and when the socket is closed.
Tracking all network connections at the socket layer gives a cluster-wide view into all network connections in your cluster and includes the pod and process involved. There are numerous good reasons to collect network observability data, including to build out a least-privilege network policy. If you’re planning on using network policies, you’ll need network observability to help craft out your policy. By using network observability, you can also detect several techniques in the MITRE ATT&CK® framework,11 which is a well-known knowledge base and model for adversary behavior. For example, you can identify lateral movement, which is when an attacker “explor[es] the network to find their target and subsequently gain[s] access to it. Reaching their objective often involves pivoting through multiple systems and accounts.”12
Filesystem Visibility
Unauthorized host filesystem access in containers has caused several severe vulnerabilities and privilege escalation techniques. The official Kubernetes documentation calls this out: “There are many ways a container with unrestricted access to the host filesystem can escalate privileges, including reading data from other containers, and abusing the credentials of system services, such as kubelet.”13
While it’s recommended to use a read-only filesystem for pods, observability into filesystem mounts inside a container or Kubernetes pods is crucial. We can observe all mount system calls from a container, which provide visibility for all mounts made in a node.
Observing read and write events to a filesystem or to stdin/stdout/stderr file descriptors is a powerful method to detect attacker behavior, including achieving persistence on a compromised system. Monitoring and enforcing access to sensitive files and credentials is a good way to get started. For example, by observing write access to the /root/~.ssh/authorized_keys file, you can identify if an attacker installs a potential backdoor to maintain a foothold on the system.
By monitoring a combination of system calls with eBPF, you can monitor access on sensitive files with open, or read and write with read, and write, respectively.
The Underlying Host
Containers aren’t the only show in town. Detecting malicious behavior in your pods and workloads is critical, but so is detecting malicious behavior in your cloud native infrastructure. Any worthy security observability solution should provide events for both containerized workloads as well as standard Linux processes on the node.
If you recall, containers are just Linux processes running in the context of a Linux namespace. The underlying host can be a physical or virtual machine and runs containerized workloads and standard processes using the same kernel. When building out your security observability, it’s critical to capture both containerized and standard processes to provide visibility from initial access in a container to post-exploitation behavior, such as a container escape as a process on the host.14
Containers and Linux processes share their kernel,15 and both are visible to eBPF. The combination of containerized processes and standard processes provides full visibility into workloads and node events. You can distinguish between events for nonnamespaced host processes, with namespaced container processes, while providing a unique identity for each.
Real-World Detection
But how do you translate system calls and socket connections into detecting a real-world attack? If you run strace on your machine, you can see that system calls are happening all the time.16 Not everyone has the detection skills to identify an attack on these signals alone. Instead of observing each individual system call and network event that happens inside an environment, focusing on patterns of attacker behavior and their target object is more beneficial.
The MITRE ATT&CK framework defines repeatable patterns of attacks and can help identify attacker behavior. If you’ve defined a threat model,17 you can define observability points around your risk profiles.
Using eBPF security observability during a red team assessment, penetration test, or Capture the Flag (CTF) event can identify real-world attacker behavior and validate that you have sufficient visibility into attacks. Participating in CTFs and red team exercises can also help sharpen your detection skills for real-world scenarios. The best way to detect an attack is by learning how to attack.
1 See the discussion of forensic artifacts by Tetra Defense’s President, Cindy Murphy.
2 Kernel address space layout randomization (KASLR) is a well-known technique to make exploits harder by placing various objects in the stack at random, rather than fixed, addresses.
3 As named by Brendan Gregg, an eBPF legend.
4 See the manual page for the execve() system call.
5 This blog post is a great source to learn and understand the different hook points, data sources and their advantages.
6 Brendan Gregg, BPF Performance Tools (Addison-Wesley Professional). This book is the encyclopedia of BPF tools and performance, covering many topics with a balance of theory and practice.
7 With notable exceptions, such as userspace emulated kernels like gVisor, unikernels, and other sandboxed environments.
8 The madvise() system call advises the kernel about how to handle paging input/output in a specific address range. In case of MADV_DONTNEED, the application is finished with the given range, so the kernel can free resources associated with it. The detailed description of the Dirty COW Linux privilege escalation vulnerability can be found in the corresponding CVE.
9 The pivot_root system call allows you to remount the root filesystem to a nonroot location, while simultaneously mounting something back on the root. It’s typically used during a system startup when the system mounts a temporary root filesystem (e.g., an initrd), before mounting the real root filesystem, but it can be used for attackers mounting a sensitive filesystem inside a container.
10 As Michael Kerrisk calls it in The Linux Programming Interface (No Starch Press).
11 “MITRE ATT&CK® is a globally accessible knowledge base of adversary tactics and techniques based on real-world observations.”
12 Lateral movement is described in the MITRE ATT&CK framework.
13 Although this documentation is referenced in the deprecated PodSecurityPolicy, it’s still relevant.
14 An example attack framework can be MITRE. A few steps from the attack are covered in “Detecting a Container Escape with Cilium and eBPF” by Natalia Reka Ivanko.
15 With some notable exceptions, such as gVisor, which implements a proxy kernel in userspace or Firecracker, which provides a sandboxed and limited KVM guest per workload.
16 Strace is a useful diagnostic, instructional, and debugging tool which can help you for example to observe system calls.
17 There are multiple books and online courses to learn how to define a threat model. An online course is “Kubernetes Threat Modeling” (O’Reilly).