
The subject of detecting trickery and accurately fingerprinting client software, that is. I have thus far mentioned that the task of detecting deceptive clients is complex, but not impossible and that behavioral analysis, a careful monitoring of the sequence of events produced by the browsers in question is a route worth exploring.
HTTP is a particularly generous subject of study, because, as we have seen, much of the activity occurs in parallel or nearly in parallel, and the exact queuing and data-processing algorithms are fairly subtle and unique for each client. By measuring the number of files downloaded at once, the relative time delays between requests, the ordering of requests, and other fine details of a session, it is possible to measure the unique characteristics of a system on a level that is much more difficult for the user to tamper with. Hence, you can distinguish impersonators from law-abiding citizens with no effort.
To provide a real-world example of this approach in the simplest possible way, and to stay as close to real applications as possible, I decided to see how much could be told from existing, fairly limited samples of data that many of you probably have on hand, so I reached for the standard logs of slightly more than 1 million requests to a relatively popular website. The data used for this analysis was a typical Apache web server access log, containing request completion times, requested URIs, advertised browser data from the User-Agent header, and other basic information of this nature. The page for which the log was kept consists of a set of relatively small pictures of comparable size and a single HTML document that calls for them all.
Apache’s practice of logging requests when they are completed, as opposed to logging them when issued, could be perceived as a problem, but is actually quite helpful, assuming the requested set of files is relatively homogeneous. Request initiation order is usually more influenced by the sequence in which resources are referenced within the main page, whereas completion timing is a more complex beast.
Completion order probabilities depend on the number of requests, inter-request delays, and other parameters that subtly but noticeably vary from browser to browser. In particular, browsers that always keep only one connection open always issue requests in a known order, A-B-C-D; browsers that open three connections at once and issue requests rapidly are just as likely to produce B-A-C-D, C-B-A-D, C-A-B-D . . . and in those later cases, requesting queuing and session management matters most.
Naturally, we cannot forget that the observed sequence is also heavily affected by network latency and reliability and other random issues. Still, it is reasonable to expect that, for such a large set of samples, these non–browser-specific effects would either average out or affect data for all clients in a similar way. And when this happens, we will hopefully see subtle differences between browsers that lie underneath a friendly user interface.
Figure 14-1 shows a statistical distribution of attempts to load the ten-element web page mentioned earlier for the four most popular web clients in the dataset. Each graph is divided into ten major segments. The first corresponds to the main HTML file, which is directly requested and naturally makes the first element of the site. The remaining nine major segments correspond to nine images referenced from this HTML, in the order in which they are called for in HTML.
Each of the segments is further divided into ten discrete locations on the X axis (not explicitly shown here to avoid cluttering the chart). The height of the graph at the nth discrete location within a given segment represents the likelihood of this particular file being loaded as the nth item in sequence.

To make the graph more readable, distribution probabilities are given as percentages between 1 and 100 (corresponding to percentages, with all values less than 1 percent rounded up), and discrete points are connected with lines. The graphs are then plotted on a logarithmic scale (log10, with major guides at 1, 10, and 100) to make subtle features more pronounced and easier to visually compare.
In a perfect world, with fully sequential and predictable browsers, the first segment would contain only a peak at the first (leftmost) discrete location; the second segment would contain a peak only at the second location, and so forth. In practice, however, some browsers issue many requests at once, and thus the order is more easily shuffled: the third referenced file can end up being loaded before the second or after the fourth. The less pronounced a single spike is in each segment, the more aggressive the browser fetch algorithm appears to be—for the more even the probability of this file being loaded out of order is.
The differences should be clearly visible, even between browsers historically based on the same engine: Mozilla and Internet Explorer. All clients appear to observe the order in which files were referenced in the main document, and so subsequent spikes move slowly from left to right across the segments. Yet, as you can see, Mozilla is generally considerably less impatient than Internet Explorer and more often finishes downloading files in the order in which they were requested. Opera, on the other hand, touted as the fastest browser on earth, is considerably less sequential (with many files having two or three nearly identically pronounced spikes, suggesting that a set of requests is issued so rapidly that the completion sequence is almost arbitrary, and most heavily influenced by network jitter). Wget, a popular open-source web spider, is for comparison perfectly sequential (a pattern common for automated crawlers), uses a single connection, and loads all files in the same order.
Pictures and graphs are nice, but have little or no value for automated policy enforcement or abuse detection. To quantify observed patterns somehow, and to make fingerprinting a bit more realistic, I decided to introduce a simple metric that gives a segment a better score (in the range of 0 to 10) when only a single peak is present and gives a lower score when the distribution is more arbitrary. This could allow for creating a simple, ten-value fingerprint for a specific piece of software and then match observed activity against a set of signatures to determine the best fit.
To construct a metric that expresses a relative quality (linearity) Q of observed behavior at major segment s, I used the following formula (fn denotes the probability of file appearing at position n in fetch sequence, expressed in percentage values for convenience and to upset purists):
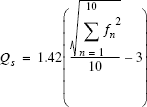
This equation, although scary at first sight, is actually straightforward. I wanted the formula to give preference to the situation when this particular file is most often loaded at a fixed position in a sequence (that is, one f value is near 100 percent, and remaining probabilities are close to 0 percent) over those when all positions are equally likely to occur (all f values at 10 percent).
Because the sum of all elements of f is fixed (100 percent), the easiest way to achieve this is to use a sum of squares: for any sequence of nonzero numbers; a sum of squares of those numbers is always less than a square of the sum. The highest and lowest results are as follows:
| 102 + 102 + 102 + 102 + 102 + 102 + 102 + 102 + 102 + 102 = 1,000 |
| 1002 + 02 + 02 + 02 + 02 + 02 + 02 + 02 + 02 + 02 = 10,000 |
The remaining math, besides the main sum, is used merely to map results to a reasonable scale of 0 to 10 (when rounded).
The results of calculating this metric for each segment of observed traffic for each browser are superimposed on Figure 14-1, as a numeric value describing every segment of the graph. As expected, Wget scores perfectly for each segment. Scores for the other browsers confirm previous visual observations and make them more tangible. Although Internet Explorer and the Mozilla/Netscape engines appear to have roughly similar graphs, strong differences can be observed around load charts for items 4 through 6 and to a lesser degree across the entire fetch sequence. Opera clearly distances itself from the bunch, with consistently lower scores for each segment.
As a result, by applying a fairly trivial analytic tool, we ended up with a framework for devising a practical method to identify browsers and detect trickery in a statistically significant sample of user’s HTTP traffic. You can enhance the model by analyzing other auto-load elements such as scripts, HTML style sheets, image maps, frames, and other files that exhibit even greater browser-to-browser variance. The Santa might find it easier this year to prepare the naughty user list.
I merely hope to show how easy it is to detect hidden characteristics of an unknown application by observing its behavior, without making any specific assumptions or dissecting the internals of such a program. The above exact numbers are likely not directly applicable to any website other than the one I used, and so you are encouraged to do your homework should you find a potential use for this technique. Once you profile a site or a set of sites, you can use the data to efficiently recognize systems based on their activity patterns over time.
Needless to say, the method I’ve used here is a (perhaps overly) simplistic approach to behavioral analysis and is based on perhaps the most trivial of all possible scenarios; I provide it as encouragement and to tempt you to search for more. In advanced cases, you can readily use the process of rendering contents in frames, tables, and other visual containers or fetching and rendering special types of files to determine which browser is being used even without performing statistical matching—in various highly specific aspects of browser activity, differences become far more striking. A clever application of differential timing is also promising.
And consider this: You can take more thought out forms of behavioral analysis a step further and deploy them not to tell one rendering engine from another, but to tell machines from humans or even identify single users. As discussed in Chapter 8, keyboard use patterns are often so unique for an individual that it is possible to use them for biometrics. Similarly, research suggests we can use the ways users click links, make choices, read information, and so on to indicate who or what is behind a set of requests.[104] Although now closer to scientific speculation than fact, this is a wonderful field to explore and play with.
Browser activity and behavioral analysis applications go beyond the detection of browser software—in fact, some enter the domain of user privacy and anonymity.
An interesting piece of research published in 2000 by Edward Felten and Michael Schneider[105] makes a fascinating contribution to the possible applications for the technique, an ability that is closely allied with caching mechanisms deployed in today’s engines, bringing us to the point where all the elements discussed so far finally meet.
The basic premise of their research is that, by inserting a reference to a file on a particular site and then measuring the delay the browser encounters while downloading it, it is possible to tell whether the user had visited a particular site in recent days. Simple enough.
I’ll spare you a lengthy excursion into the world of theory, predictions, and speculations (just this once) and instead propose a nearly real-world example. Assume that I am running www.rogue-severs.com. I’ve decided that my main page will, for some reason, refer to a picture (such as a front-page logo) taken from www.kinky-kittens.com; I make the visual element difficult to find or scale it down so that it is not visible, but it will be still loaded by a browser.
An unsuspecting user visits my site. If they have never been to www.kinky-kittens.com, it takes them a while to download the image I have referenced. If they are a frequent visitor, however, the image is already present in their cache and is fetched almost instantly.
Because the reference to the www.kinky-kittens.com resource is preceded and followed by requests for other visual elements I happen to host on my site, by deploying clever timing heuristics, it is possible to reliably measure whether the entire logo had been fetched or whether it was already in the cache. All this suffices to determine whether a newcomer to my page is indeed a frequent visitor to a specific website (or a particular section of a website) and effectively brutally invades their privacy. Although the scenario is not likely to be used for widely deployed routine espionage (primarily because clear evidence is left behind and might be noticed by the operator of the server on whose users we desire to snoop), targeted attacks might be quite effective.
In the end, all pieces of the puzzle fit together, perhaps loosely, but still fit together. Users, programs, and habits can all be easily exposed through a careful abuse of modern features of a popular Internet protocol. Something not necessarily always comforting to the valued visitors of www.kinky-kittens.com.