
Chapter 7. Miscellaneous Other Uses
Introduction
The wondrous thing about Snort is that, because of its flexible modular structure, it is easy to make it do things that it wasn’t designed to do. With some original thinking, it is possible to get Snort to do anything from checking up on the health of your network to using it to listen out for a secret knock.
In the very last recipe, there is some advice about how not to get yourself in trouble using the power of Snort.
7.1. Monitoring Network Performance
Solution
Snort includes several tools to help determine how your network is performing. Chapter 4 discussed one of these tools: the performance monitor preprocessor, perfmonitor. The perfmonitor preprocessor logs its data in a comma-separated format file in the Snort log directory. The perfmon-graph tool can display this data to a web page, or you can even generate a text-based chart using the perfstats.c script in the Snort contrib directory. For the brave who want to create a rolling graph of protocol use, you can use the flow log preprocessor STDOUT logging mechanism to pull that information out of Snort to a dynamic interface (ESM/SIM anyone?). Fianlly, you can use Snort in binary mode then replay the packets to a file so you can pull all the data you want—such as top talkers, protocol use, etc.—through the use of custom scripts. The only reason to seek the last option is if the others can’t help solve your problem.
Discussion
The perfmonitor preprocessor has been a part of the Snort code
since Snort 1.9.0. This preprocessor was originally built to help
debug and test Snort, but the developers decided to enable it with the
open source code to help the community. This preprocessor has to be
enabled at compile time with --enable-perfmonitor added to your configure
statement. Chapter 4 gives
examples of the full set of configuration options for the preprocessor
in the snort.conf file. However,
this information is logged to the Snort log directory in a CSV format
file. This file can then be pulled over to a central machine for
display, such as on a status board for your analysts to look at using
perfmon-graph. Using the data from the perfmonitor preprocessor, we
get a chart like that shown in Figure 7-1 to be
displayed.

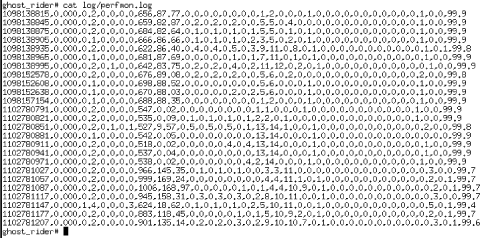
This might be a little more helpful to your security team and management than the information provided in Figure 7-2, which shows how the perfmonitor logs are written.
To use the perfmon-graph tool, you will need at least the Round Robin Database (RRD) Perl libraries installed. The link to the tool can be found in the “See Also” section. RRD was originally built as a replacement for the operational tool MRTG. However, for the perfmon-graph tool, it needs only the Perl modules installed. These modules enable perfmon-graph to use the graphing components of RRD to plot Snort data without needing to install the full tool. As this tool needs to add modules to the Perl libraries on the system, it needs to be installed with user root.
Root#./configure --<your options>( none are usually needed ) root#make site-perl-install
This tells RRD to install only the Perl libraries needed to graph data in image type PNG graph format. One example for organizations that have more than one sensor could be to use the machine that displays ACID or some other web frontend as the collection point for these files. Have the perfmonitor logfiles pulled regularly using SCP if you are security conscious or FTP if you are more comfortable with your sensors’ connection to this machine. Then create another script to take the raw perfmonitor files, as in Figure 7-2 and use the perfmon-graph tool to create the files in a web directory. The following script could be used to pull all the perfmon.log and session.log files over to a specific directory on a collection machine using SSH trusted keys. This could be used as a secondary collection of evidence in case one or more of your sensors is compromised. This could also be the directory that the perfmon-graph tool pulls data from to generate hourly, daily, or weekly graphs.
# START OF EXAMPLE SCRIPT
#!/bin/sh
#
# Simple script to collect needed information from the sensors
# using a trusted key pair from a non-root account called `scripts'
# that is placed on all of the sensors and collection server.
# This script uses SCP to transfer the files and therefore needs
# a trusted (public/private key pair) to be use from a local account
# on both collection machine and the sensors.
#
# Create a timestamp file to be pulled to determine when this script
# was last run
mytime=`date `
echo "This is the last time the script was run $mytime " > /logs/LASTTIME
#
#
# SENSORS
#
# INTERNAL - <IP> <Location> <etc>
scp <scripts_account>@<IP>:/var/log/snort/perfmon.log
/logs/INTERNAL_SENSOR_perfmon.log
scp <scripts_account>@<ip>:/var/log/snort/session.log
/logs/INTERNAL_SNORT_STREAM4.log

# REPEAT FOR EACH SENSOR

# ALL DONE!
Another use mentioned previously was the ability to generate graphs from the data. The following is an example display script that is used to convert the raw logs into a graphical format. In this example, a directory structure was created to organize the data by sensor location/name.
#
# wwwroot--
#          |
#       sensor_perfgraphs (created index.html file below)
#            |
#         INTERNAL_DIR
#            |
#            EXTERNAL_DIR
#            |
#            RAS/VPN_DIR
To make this easier to use, create a main page that is refreshing, such as for an information portal page. That way, analysts can determine when an update has been applied. Set the following script to run from cron at the intervals that you would like to use.
#####
#!/bin/sh

# NOTE: Probably going to be easiest to run as root for permission errors

#
# Place this file in the sensor_perfgraphs director
#<HTML><HEAD><TITLE> SNORT SENSOR PERFMONITOR GRAPHS </TITLE></HEAD>
#<CENTER> <B> LAST TIME RUN 'cat /logs/LASTTIME' </B> </CENTER>
#<BR><BR><BR><BR><BR>
#<BR> <B> INTERNAL <A HREF="INTERNAL/index.html">SENSOR</A>
#<BR> <B> EXTERNAL <A HREF="EXTERNAL/index.html">SENSOR</A>
#<BR> <B> RAS/VPN_DIR<A HREF="REMOTE/index.html">SENSOR</A>
#<!--- REPEAT FOR EACH SENSOR -->
#</HTML>
#
# CREATE THE perfmon-graph files
#
# INTERNAL Sensor
/path/to/perfmon-graph.pl  /var/www/html/sensor_perfgraphs/INTERNAL
/logs/INTERNAL_SENSOR_perfmon.log
# REPEAT FOR EACH SENSOR
#
# ALL DONE!
This method could easily be used on a cron job to automatically update the web pages, which could be displayed on a large screen or screensaver on which your management and other personnel can see what activity has been occurring on the network.
Another possibility would be to use another tool called perfstats.c to display the data from Snort perfmonitor logs. This tool is a script that comes as part of the Snort source distribution. While it doesn’t display fancy web PNG images, it does still get the job done, as you can see in Figure 7-3.

This tool has to be compiled before you can use it. It also has
to be fed the data from STDIN, such as from a cat command, in order to work. To use the
perfstats.c file, you first have
to compile it. To compile this tool, use gcc or cc, depending on which
you have with your distribution. We are going to specify the file to
which we want the compiler (gcc) to output our completed file with
-o.
root#pwd/tmp/snort-2.2.0/contrib root#gcc -o perfstats.exec perfstats.c
If you get errors, you might want to check for the compiler or make sure that you have a complete Snort source distribution. To use the newly compiled tool, feed it a perfmonitor logfile. To postprocess a perfmonitor file, use this command:
root# cat /logs/perfmon.log | ./perfstats.exec -qThis will print out a copy of the CSV data in a readable format such as in Figure 7-4. If you want to keep a running eye on the performance of your network, you can do this:
root# tail -f /logs/perfmon.log | ./perfstats.execThe tail -f is a command to
automatically feed to STDIN the last entry into a file. This way, the
perfstats.exec tool is refreshing
the stats every time the perfmonitor preprocessor is triggered. Using
some programming skills and imagination, you could take this and feed
it to a “live” status application/web page. This output could then
provide a quick reference to your analysts of the health and wellness
of the network(s).
If you want the summary page (-q) to display the columns of information,
you must edit the source code file (perfstats.c). This is a simple one-line
addition to the file. Find line 108, which should look like:
107 void printstatsex( DATA * p, DATA * q,DATA * r)
108 {
109    printf("         Mbits/Sec:  %9.1f %9.1f %9.1f
", p->mbits,q->mbits,
r->mbits);
Add this line between line 108 and 109:
printf("                      AVG:     MIN:     MAX:
");
To get the following:
107 void printstatsex( DATA * p, DATA * q,DATA * r)
108 {
109    printf("                      AVG:     MIN:     MAX:
");
110    printf("         Mbits/Sec:  %9.1f %9.1f %9.1f
", p->mbits,q->mbits,
r->mbits);
Save the file and recompile as earlier. You should see output similar to Figure 7-4.

The slight difference the summary line makes can sometimes be helpful, especially when explaining to management. However, this type of text-only information will most likely be used only by your analysts, and possibly an operations staff, to troubleshoot and display network issues.
You can also make Snort display some rudimentary protocol information in real time by setting the flow log to display to STDOUT (screen), such as in the following:
,----[ FLOWCACHE STATS ]----------
Memcap: 10485760 Overhead Bytes 16400 used(%0.165949)/blocks (17401/8)
Overhead blocks: 1 Could Hold: (73326)
IPV4 count: 7 frees: 0 low_time: 1098152556, high_time: 1098152592, diff: 0h:00:36s
    finds: 1220 reversed: 447(%36.639344)
    find_sucess: 1213 find_fail: 7 percent_success: (%99.426230) new_flows: 7
 Protocol: 6 (%99.672131) finds: 1216  reversed: 445(%36.595395)
  find_sucess: 1210 find_fail: 6 percent_success: (%99.506579) new_flows: 6
 Protocol: 17 (%0.327869) finds: 4  reversed: 2(%50.000000)
  find_sucess: 3 find_fail: 1 percent_success: (%75.000000) new_flows: 1
While confusing to some, this can be logged to a file using redirection or just displayed to a file. But you can get some idea of the load your network is under from the previous code. In the previous example, the flow log was set to output stats every 15 seconds. So in 15 seconds, Snort had:
observed 14 new flows
TCP traffic 99% ( protocol 6)
UDP traffic wasn't even 1% (protocol 17)
No other protocol was observed
For full information on the flow log, check out Chapter 4. For this example, we modified the snort.conf file to enable:
# Snort.conf file
preprocessor flow: stats_interval 15 hash 2
# default
# preprocessor flow: stats_interval 0 hash 2
#
Display this information using the Bourne shell running Snort with the following options:
/path/to/snort -c /path/to/snort.conf -i <interface> 2>&1
However, to display to a file (Console.log, in this example), run with the following options:
/path/to/snort -c /path/to/snort.conf -i <interface> 2>&1 > CONSOLE.log
Finally, another way to show real-time stats is through the
console option on the perfmonitor
preprocessor. This is discussed fully in Chapter 4. However, for this example,
we are going to use the real-time stats portion of the
preprocessor.
For example, if you wanted to see text-only information, such as
the following, you could just enable the perfmonitor preprocessor to
log to console. Following is an
example of the type of reporting that will be written to either syslog
or the console.log file, if
starting Snort with the previously listed run options.
Snort Realtime Performance  : <date>
--------------------------
Pkts Recv:   806
Pkts Drop:   0
% Dropped:   0.00%

KPkts/Sec:   0.03
Bytes/Pkt:   688

Mbits/Sec:   0.15 (wire)
Mbits/Sec:   0.00 (rebuilt)
Mbits/Sec:   0.15 (total)

PatMatch:    88.35%

CPU Usage:   0.11% (user)  0.00% (sys)  99.89% (idle)

Alerts/Sec      :  0.0
Syns/Sec        :  0.0
Syn-Acks/Sec    :  0.0
New Sessions/Sec:  0.0
Del Sessions/Sec:  0.0
Total Sessions  :  1
Max Sessions    :  2
Stream Flushes/Sec :  0.0
Stream Faults/Sec  :  0
Stream Timeouts    :  1
Frag Completes()s/Sec:  0.0
Frag Inserts()s/Sec  :  0.0
Frag Deletes/Sec     :  0.0
Frag Flushes/Sec     :  0.0
Frag Timeouts        :  0
Frag Faults          :  0

Protocol Byte Flows - %Total Flow
--------------------------------------
TCP:   99.98%
UDP:   0.00%
ICMP:  0.00%
OTHER: 0.02%

PacketLen - %TotalPackets
-------------------------
Bytes[60] 38.57%
Bytes[62] 0.25%
Bytes[63] 0.13%
Bytes[65] 0.13%
Bytes[66] 0.13%
Bytes[68] 0.13%
...cut for brevity

TCP Port Flows
--------------
Port[110] 0.23% of Total, Src:  50.54% Dst:  49.46%
Ports[High<->High]: 99.77%

UDP Port Flows
--------------
ICMP Type Flows
In the next example, the Snort perfmonitor preprocessor data is being output in both raw, comma-separated file (CSV) and postprocessed formats. The raw formatted data can then be passed on to the perfmon-graph tool for real-time graphing, while the syslog server can be searched through to get the postprocessed format data found previously. (The following example logs events every 30 seconds or five packets—whichever occurs first—and then writes the CSV file snortfile perfmon.log in Snort log directory while also generating a report, as can be seen earlier to either syslog or the console.log file.)
# Example snort.conf file
preprocessor perfmonitor: time 30 flow pktcnt 5 snortfile perfmon.log console
The raw CSV logfile created by perfmonitor can be put to additional use with some custom tools, if your organization has further use for the data. This can be pretty powerful information to use for network planning and loss-of-services planning. The data also offers the valuable service of displaying the Return-On-Investment (ROI) for an IDS team through graphs and repeatable and automated reporting.
See Also
Perfmon-graph (http://people.su.se/~andreaso/perfmon-graph/)
perfstats.c snort-2.2.x source code contrib directory
rrd tool (http://people.ee.ethz.ch/~oetiker/webtools/rrdtool/)
7.2. Logging Application Traffic
Solution
Make use of the session
keyword that was introduced in Recipe 2.26.
Description
If your application, like most do, uses a particular port on a
particular machine, write a rule that detects this and use the
session keyword to record it. For
example, to record all traffic to and from a MySQL server running on
TCP 3306 on a particular machine (192.168.0.8, for example), use the
following rule:
alert tcp any any <> 192.168.0.8 3306 (msg: "MySQL"; session: all;)
7.3. Recognizing HTTP Traffic on Unusual Ports
Problem
To improve security and reduce bandwidth usage, it is essential to ensure that only authorized web servers are running on the network.
Solution
HTTP traffic is easy to detect; write a rule to identify it and log the packets to determine the port and IP of the offending server.
Description
HTTP traffic is easily identifiable. The following list covers most HTTP commands:
OPTIONSGETHEADPOSTPUTDELETETRACECONNECT
So a rule that detects these commands will record all HTTP
traffic. Obviously you won’t want to record any traffic that is going
to and from legitimate HTTP servers, so the rule should be written to
exclude these. For example, the following example will detect any
GET command to any machine that
isn’t the web server on 192.168.0.8:
var WEBSERVER 192.168.0.8
alert tcp any any -> !WEBSERVER any  ( content: "GET"; msg: "Detected HTTP GET";
7.4. Creating a Reactive IDS
Problem
Simple alerting is insufficient; you want to actively respond to an attempt to compromise your security.
Solution
If you want to reset any illegitimate connection attempts, use
the resp keyword from Recipe 2.27.
If you want to call on an external program to perform some action, use the unixsock output plug-in from Recipe 2.23.
If you want to use Snort to modify the rules of a firewall to block unwanted traffic, use SnortSAM.
If you want to use Snort as a filter to remove unwanted traffic, you need to run Snort inline. This removes the problem of attacker using an intrusion prevention system to create a denial of service. As it drops only packets that are suspect, it doesn’t exclude an entire IP address.
Discussion
The first two options have been discussed earlier; please see the respective recipes for further information.
To create an interface between Snort and a firewall, you can use either the unixsock output plug-in to call a script to modify the firewall, or you can use SnortSAM.
SnortSAM is a plug-in to Snort that interfaces with a number of firewalls, both commercial and open source, to modify the rulesets. The supported firewalls at the time of writing include:
Checkpoint Firewall-1
Cisco PIX firewalls
Cisco routers
Netscreen firewalls
Watchguard
IPTables and IPChains
To install SnortSAM, download the source from http://www.snortsam.net. Unzip and unpack the source, change to the source directory, and make SnortSAM by entering the following commands:
tar xvZf snortsam-src-2.24.tar.gz
cd snortsam-src-2.24
./makesnortsam.sh
When the compile is finished, copy the binary to /usr/local/bin. Or you can download the precompiled versions from the same site for Linux, Windows, and Solaris.
To add the SnortSAM plug-in into Snort, download the snortsam-patch.tar.gz file from the SnortSAM site, decompress and unpack it, and then use it to patch the Snort source using the following commands:
tar xvZf snortsam-patch.tar.gz
cd snortsam-patch.tar.gz
./patchsnort.sh /usr/local/src/snort
where /usr/local/src/snort is the path to your Snort source. You then need to recompile Snort as described in Recipe 1.n.
To run SnortSAM, start it with the following command:
snortsam /usr/local/etc/snortsam.conf
where the path is that of the snortsam.conf file. This file contains the configuration options for SnortSAM and an example file is provided. The minimum options are to specify a Snort sensor to listen to and the details of the firewall that is to be modified by SnortSAM. Edit the example file to reflect your requirements.
Once SnortSAM is running, you need to start Snort with a snort.conf file that includes the SnortSAM output plug-in. You can add it by entering the following line in the snort.conf file.
output alert_fwsam: 192.168.0.25
Replace the IP address with the IP of the machine running
SnortSAM. Modify your rules by adding the fwsam option, which allows you to specify
which IP to block and the duration of the block. For example, to block
the source of the packet for a duration of five minutes, add:
fwsam: src, 5 minutes;
For example:
Alert tcp any any -> any 2001 (msg: "Block anyone who tries Port 2001"; fwsam: src, 5 minutes;)
You should examine the SnortSAM documentation to see the exact eccentricities of working with your particular type of firewall.
The big caveat of reactive firewalls is the capability of an attacker to launch a substantial denial of service. If the firewall shuts down any IP address that sends a certain packet, someone can spoof the source address on multiple packets of that type, which would block all those IP addresses. The solution to this issue is to run Snort inline.
To run Snort inline, there are a number of prerequisites and a fair bit of initial setup. The good news is that most of these prerequisites are now standard in the latest releases of most flavors of Linux.
You’ll need to download the snort_inline source, which is available online at http://snort_inline.sourceforge.net/. This is a full copy of Snort with the necessary modifications. Decompress the source, change into the source directory, configure, make, and then as root, install the snort_inline binaries by typing the following:
tar xvZf snort_inline-2.1.3b.tgz
cd snort_inline-2.1.3b
./configure --enable-inline
make
su
make install
Once this is done, Snort is ready to be run inline. You need to download the rc.firewall script from http://www.honeynet.org/papers/honeynet/tools.
This script controls the Snort inline setup and configures all the
other necessary things. You will, however, have to modify the script
so that the configuration options are right for your system. All the
variables are neatly kept at the head of the file in the User Variable section. Relevant variables
and the meanings of their possible settings are listed in Table 7-1. If a variable
isn’t listed here, we recommend that you use the default.
Variable name | Meaning |
MODE = “bridge” | “nat” | This determines whether the setup is a simple
bridge (same IP addresses
on both sides) or if it performs nat (network address translation).
For the example, this is set to |
PUBLIC_IP= “192.168.0.8” “192.168.0.9” | These are the internal IP addresses that you wish to be filtered. If you list more than one IP, they should be separated by spaces. |
INET_IFACE = “eth0” | This should be the external facing interface. |
LAN_IFACE = “eth1” | This should be the internal facing interface. |
LAD_BCAST_ADDRESS= “192.168.0.255” | This is the broadcast address for the internal network. |
QUEUE= “yes” | “no” | Either enable or disable QUEUE support: this
should be set to |
PATH= “/sbin:/usr/sbin” | Path to check for all requisite programs; the
|
Once you have made the changes that are necessary to the rc.firewall script. Running the script will cause all the traffic through IPTables to be passed to our snort_inline daemon.
./rc.firewall
Next, the task is to modify the ruleset so that instead of
alerting, the packets are dropped. You can download a utility from the
Honeynet site mentioned earlier that will do this for you
automatically, but it is good practice to know what is going on
anyway. The change is straightforward: replace the alert keyword with the drop keyword. This will cause those packets
that match the rule to be discarded without a trace.
To start snort_inline so it is listening to the packets passed from IPTables, use the following command:
snort -D -c /etc/snort/snort.conf -Q -l /var/log
Most of the options are standard: -D for daemon mode, -l for log directory, and -c for configuration file. The only
different option is -Q, which tells
snort_inline to listen to the IPTables queue.
See Also
Snort-inline project (http://snort-inline.sourceforge.net)
guardian from the snort contrib directory
IPS vendors
7.5. Monitoring a Network Using Policy-Based IDS
Solution
Using Snort to monitor your network using policy-based IDS is generally a good idea as a second-layer defense. However, in the age of tunneled applications, when just about every application has an HTTP port, a policy-based solution does not provide as good coverage as normal signature IDS.
Another key point is that using policy-based IDS requires an organization to know a lot about its own network and the services it offers to the outside world. For example, with a policy-based architecture you might be suddenly flooded with alarms about FTP traffic on your web server(s) because your operations staff failed to notify the IDS team of a change in the services offered on those servers.
Finally, you are placing a lot of hope in the idea that attackers to your network won’t realize that you, for example, trust all traffic between the outside world and your web server on port 80/tcp and 21/tcp. In such a case, an attacker can install a backdoor application on port 80, such as /backdoor.exe, then wait until your organization looks through its web server logs. Or turn off the FTP service and install an encrypted SSH session on that port so that you are now blind to the information being infiltrated/exfiltrated from your network.
Discussion
What is policy-based IDS? Policy-based IDS is making several assumptions about your network:
You know your network very well, such as your network segments, IP ranges, and outside connection points.
You know and have secured your “servers” to provide only the service(s) you want. Web servers serve only HTTP; FTP servers serve only FTP, etc.
You have an application proxy or other means of securing egress traffic leaving your network.
With this in mind, one of the examples of this would be to configure Snort to be aware of all your servers in the snort.conf file, as in the following:
# Policy-based snort.conf example
var HTTP_SERVERS [10.0.4.5/32, 10.0.7-7/32,10.1.3.4/32]
var MAIL_SERVERS [10.1.4.6/32,10.0.10.5/32]
var FTP_SERVERS [10.1.4.4/32,10.1.3.7/32]
# var SSH_SERVER [  ]
Then create several rules to trust that traffic and pass it without analysis, as in the following:
# Create pass rules for the "trusted" traffic
pass tcp $EXTERNAL_NET any <> $HTTP_SERVERS $HTTP_PORTS
pass tcp $EXTERNAL_NET any <> $MAIL_SERVERS $MAIL_PORTS
pass tcp $EXTERNAL_NET any <> $FTP_SERVERS 21
# ETC, etc
To enable Snort to pass the rules first at runtime, enable the
-o option to change the rule order
to pass/alert/log rules. This means
that Snort will process pass rules, then alert rules, and finally, log
rules.
/path/to/snort -c /path/to/snort.conf -o -i <interface>
Here are several examples of policy-based rules that would be typical to enable on your policy sensors to determine when a policy has been violated:
alert tcp $HTTP_SERVERS any -> any !$HTTP_PORTS (msg:"ODD PORT USE - HTTP
SERVER !!"; flow:established; classtype:bad-unknown; rev:1; sid:10777;)

alert tcp $MAIL_SERVERS any -> any !MAIL_PORTS (msg:"ODD PORT USE -
MAIL SERVER !!"; flow:established; classtype:bad-unknown; rev:1; sid:10778;)

alert tcp $FTP_SERVERS any -> any !21 (msg:"ODD PORT USE - FTP SERVER";
flow:established; classtype:bad-unknown; rev:1; sid:10779;)
Hopefully you can see from the previous examples how much knowledge about the network(s) and resources you need to use this type of IDS. To briefly touch on the subject of network profiling, policy-based IDS is very similar. Like network profiling, policy-based IDS works on the principle that once a network is known, changes should be minimal or non-noticeable. However, for today’s networks, this is not often the case. One network that we are aware of had as much as 20 percent of the network changing on a given day! However, one of the benefits of this type of IDS can be found when combined with the events from your normal signature IDS. For example, when a compromise occurs, it might not fire an event from your signature IDS. However, if the compromise starts even one odd port connection, the policy-based IDS will have several events!
Finally, when used with keyword searches through your allowed application traffic, such as for HTTP, SMTP, etc., this can provide your organization with some tools to enforce an acceptable use policy. For example, if the corporate policy is worded so that content monitoring is allowed, your analysts now have the clearance to set IDS rules to alarm on content violations, such as porn, discriminatory language, privacy information, or even file-sharing applications in use on the network. This can then be handed to your proper channels, depending on the agency for resolution.
See Also
Snort 2.0 book on policy-based IDS
Application firewalls/proxy servers
7.6. Port Knocking
Solution
Use port knocking. Use the unixsock output plug-in to send alerts to a small program that keeps track of the ports accessed. If the “knock” is successful, the program will run the command required to reset the service.
Discussion
Port knocking takes the concept of a “secret knock” into the computer age. You select a certain range of ports to be accessed in a certain order, perhaps even with certain flags set on the packets sent. Snort detects each packet and then, using the unixsock output plug-in, logs the order that they come in and, if correct, runs a command of your choice to restart your service.
This need not be used only for restarting services. You could use port knocking to further secure your computer, by having no services running at all until the combination of ports is sent, and then start an SSH daemon on an unusual port.
You should ensure that you create a selection of ports that are sufficiently random that they are unlikely to be activated by accident by a randomized port scanner; for this example, we are going to use only four to simplify the program.
First, you need to set up an instance of Snort to recognize your knocking. A simple snort.conf file that includes the unixsock plug-in and one rule file is more than enough. The example rule file is as follows:
# Snort Portknocking Rules

alert tcp any any -> 192.168.0.8 4 (msg: "Port Knock 1";)
alert tcp any any -> 192.168.0.8 8 (msg: "Port Knock 2";)
alert tcp any any -> 192.168.0.8 13 (msg: "Port Knock 3";)
alert tcp any any -> 192.168.0.8 24 (msg: "Port Knock 4";)
At this point if you wanted to make this more secure still, you should add other criteria, such as a specific source IP, specific source port, or flags. When we get to the knocking program, we will be using hping which can spoof all these details, so don’t feel that the IP will restrict you to doing this only from a single machine; look at it more as another level of secret knowledge that would pose more of a problem to someone seeking to hijack your connection.
The unixsock alerting program from Recipe 2.23 has been modified to count the knocks and ensure that they come in the correct order. There are probably a million and one ways of programming this; the example is simple, but it works.
#!/usr/bin/perl
use IO::Socket;
$TEMPLATE = "A256 A*";
unlink "/var/log/snort/snort_alert";
$SIG{TERM} = $SIG{INT} = sub { exit 0 };
my $data;
my $client = IO::Socket::UNIX->new(Type => SOCK_DGRAM,
                   Local => "/var/log/snort/snort_alert")
  or die "Socket: $@";
print STDOUT "Socket Open ...
";
while ( true ) {
    recv($client,$data,1024,0);
    @FIELDS = unpack($TEMPLATE, $data);

# The Knocking Code starts here...

if (@FIELDS[0] =~ /^Port Knock 1/){
    $flag_one = 1;
    $flag_two = $flag_three = 0;
    }
elsif ($flag_one =  = 1 && @FIELDS[0] =~ /^Port Knock 2/){
    $flag_two = 1;
    $flag_one = $flag_three = 0;
    }
elsif ($flag_two =  = 1 && @FIELDS[0] =~ /^Port Knock 3/){
    $flag_three = 1;
    $flag_one = $flag_two = 0;
    }
elsif ($flag_three =  = 1 && @FIELDS[0] =~ /^Port Knock 4/){
    $flag_one = $flag_two = $flag_three = 0;

# Enter the Knock action here.

    print "Who's there ?
";

     }

# and ends here ...

else { $flag_one = $flag_two = $flag_three = 0; }

}
END {unlink "/var/log/snort/snort_alert";}
The code simply loops until the alerts come in the right order (resetting if the order is wrong at any point ), and then, in this case, responds by asking “Who’s there ?” At this point, you would enter the code you wish to execute.
The knocker itself is quite easy: you could either write your own program that sends a single packet to a specified port, or you could use one of the hundreds of packet creation tools available on the Web. Using other programs such as Telnet to access a port won’t work well, since more than one packet often is sent, so the port knock criteria will fail.
For this example, we are going to use hping. Hping is available for download from http://www.hping.org; installation is easy and is just a matter of decompressing the source by typing:
tar xvZf hping2-rc3.tar.gz
Changing into the hping directory, running the configure program, and then making as root, install the source:
cd hping2-rc3
./configure
make
su
make install
Hping is hugely powerful and can create packets to pretty much any criteria, but in this case, we are simply going to send a single packet to the specified port on the destination IP.
hping 192.168.0.8 -p 4 -c 1
This will send one packet (-c
1) to port 4 (-p 4) on IP
192.168.0.8. This is our first knock. There is no time criteria set in
the listening program, so you could enter each line by hand each time
if you wish, but it makes much more sense to create a shell script to
run it. The following basic script will send a single packet to the
right ports in the right order.
#!/bin/sh

hping 192.168.0.8 -p 4 -c 1
hping 192.168.0.8 -p 8 -c 1
hping 192.168.0.8 -p 13 -c 1
hping 192.168.0.8 -p 24 -c 1
There are a number of ways you could elaborate on this simple mechanism. You could add a time element so that all ports are required within a certain time frame; you could use the listening script to restart Snort as well with a new set of rules, so that the port sequence changes each time; or you could include requirements as to the contents of the packets. You can make this as simple or as complex as you need, and it can be used to call any external script that you care to create.
See Also
Christiansen, Tom and Nathan Torkington. Perl Cookbook. Sebastopol, CA: O’Reilly, 2003.
hping user manual (http://www.hping.org/)
7.7. Obfuscating IP Addresses
Problem
You want to send someone else your Snort logs for analysis, but you don’t want to give them too much information about your network.
Discussion
The obfuscation switch changes all IP addresses in the logs to
read xxx.xxx.xxx.xxx. If you use this in combination with the -h (homenet) option, it only obfuscates the
IPs within that range; all other IPs (i.e., those of the people
attacking you) remain in the clear.
See Also
Snort Users Manual
7.8. Passive OS Fingerprinting
Solution
OS fingerprinting is the idea that every platform has a unique TCP/IP stack. There are several tools and methods that use Snort to determine an OS platform of a given system crossing your network(s). If you are interested in modifying the Snort source code to detect/determine a hosts’ OSes, the snortfp project would be best suited to your needs. If you are going to use your own methods to combine the data, using p0f is your best tool in determining the host OS. Finally, if you are going to use commercial products, the Sourcefire RNA product is the way to go.
snortfp
This was a preprocessor that modified the Snort 2.1.2 code and the web frontend ACID to display OS fingerprints of a host. However, this project hasn’t been worked on since that version of Snort. Also, this patch only seems to patch Snort correctly on Linux platforms; if you are using BSD, Solaris, or Windows platforms, you are out of luck, unless you care to recreate the code. Download the patch files from http://mysite.verizon.net/sdreed.
The project uses Snort rule extensions to detect an OS fingerprint. Then it changes the ACID web code to display and search through these OS fingerprints, as can be seen in Figure 7-5, from the site mentioned earlier.

As this code runs on an older version of Snort, use it with caution and monitor it for faults.
p0f
p0f (http://lcamtuf.coredump.cx/p0f.shtml) is probably the most widely used OS-detection tool that doesn’t need to actively probe the target to determine the OS. While letting the p0f tool keep its own log and then maintaining that log along with your IDS logs may be enough for some organizations, most will want to integrate the data into a useable, searchable format; that would be a database. Specifically pushing the p0f data into your ESM/SIM would probably provide analysts with some helpful information when an event is detected. The current p0f tool 2.x doesn’t natively support database output, yet. There is a project called p0f_db (available at: http://nk.puslapiai.lt/projects_en.shtml) that will parse p0f data into both a MySQL and PostgreSQL databases. As of Version 0.3, this code seems to run only on Linux and not BSD systems.
Sourcefire RNA
Finally, since this is a Snort book, it’s only fair that we show you a commercial product that helps solve this problem as well. This quote from the sourcefire web site (http://www.sourcefire.com) that gives a brief overview of the application(s) should help.
Warning
Sourcefire Real-time Network Awareness© (RNA) enables organizations to more confidently protect their networks through a unique patent pending combination of passive network discovery, behavioral profiling, and integrated vulnerability analysis to deliver the benefits of real-time network profiling and change management without the drawbacks of traditional approaches to identifying network assets and vulnerabilities.
If buying Sourcefire is an option to you, contact them for a demo and sales.
Discussion
Because operating system vendors add their own “tweaks” to the TCP/IP stack implementation, each operating system has a unique “signature.” For a detailed discussion of this topic, see Fydor’s paper on the nmap site:
| http://www.insecure.org/nmap/nmap-fingerprinting-article.html |
The use of passive fingerprinting can be helpful in determining
the attacker and/or the victim’s risk. For example, if you get a Snort
alarm for a Microsoft IIS command execution attempt ../../cmd.exe?/+dir on an Apache server, the
p0f logs can be used to show that the “victim” machine is not
vulnerable to the attack.
While this type of information can be a virtual gold mine for government organizations and certain other businesses, not every organization is going to be able use or keep this type of information. There are several projects and code modifications available to those who would like to use this capability. However, this also is dipping into the realm of the Enterprise Security Manager/Security Incident Manager (ESM/SIM) vendors such as Arcsight, Netforensics, and Guardent. These vendors specialize in taking data from multiple types and normalizing them into a single event, such as taking in logs from your firewalls, IDS, routers, vulnerability scanners, and even patch management logs in some cases. But as you can probably guess, that topic alone could be enough for another book!
snortfp
This tool seems to compile correctly only on Linux platforms and not on BSD platforms. This patch is actually two parts combined into a single file that you download from the author’s site. The first part is the actual Snort source code patch, while the second part is a modification to the ACID web frontend (Chapter 5). The Snort patch adds a couple of changes to the Snort code; the major modification is to the rule structure itself. This change enables the ruleset that you downloaded to trigger an event on packets that can be used to determine an OS. These packets are then logged to the modified ACID database where they will be displayed. As mentioned earlier, the ACID frontend has to be modified as well as the MySQL database (no other databases are supported at this time). This modification takes the form of some structure changes, as well as the addition of a single new table to the ACID schema.
First you need to get the patch file (snort-2.1.2fp.patch.gz) from the author’s site (http://mysite.verizon.net/sdreed) as well as the Snort source code (snort-2.1.2.tar.gz) from snort.org. Then, follow these steps to get it installed:
# put the snort and the patch in the same directory then patch # the snort source code snortuser#pwd/tmp/SNORT_FP snortuser#lssnort-2.1.2.tar.gz snort-2.1.2fp.patch.gz snortuser#tar xvfz snort-2.1.2.tar.gzsnortuser#gunzip snort-2.1.2fp.patch.gz# Now we patch snort snortuser#patch -p0 < snort-2.1.2fp.patch# Now we build snort with mysql support and whatever else we want snortuser#./configure --with-mysql -other-options# only make the application don't install yet unless you are sure # that this build and patch worked. snortuser#make# the second part of this patch is to patch ACID database schema # and the ACID web interface. # First let's go patch the database. Create a database and the schema # using the scripts found in the snort config directory. snortuser#mysqladmin create snortfpdbsnortuser#cd snort-2.1.2/contribsnortuser#mysql -D snortfpdb < create_mysqlsnortuser#mysql -D snortfpdb < snortdb-extra# Now we apply the snortfp schema changes # COMMENT OUT the line "use snort;" from create_mysql_fp unless your # database is named snort. snortuser#mysql -D snortfpdb < create_mysql_fp# Now we install the ACID web interface like in recipe x.x # Then we patch ACID using the new file in the contrib directory of # snort # If ACID was installed in /usr/local/apache2/htdocs/ACID/ directory. # NOTE: Please run ACID web CREATE AG group schema change first # otherwise the changes for snortfp aren't made. snortuser#cp ACID-0.9.6b21fp.patch /usr/local/apache2/htdocs/ACID/snortuser#cd /usr/local/apache2/htdocs/ACIDsnortuser#patch -p1 < ACID-0.9.6b21fp.patch# reload your main ACID page and notice the "Network Fingerprints" # button! # TEST SNORT TO PUSH IN SOME EXAMPLE DATA snortuser#cd /tmp/SNORT_FP/snort-2.1.2/# change the "snort.conf" file to handle our new data # "output database: log, mysql, user=snrtfp password=password # dbname=snortfp host=localhost" # NOW let's test it out # Create a directory called "log" in the snort directory if you don't # want to change anything on your system snortuser#./src/snort -c etc/snort.conf -l log -i eth0 -T# if you don't get errors or a core dump then the patch was applied # correctly and you should see some data in your ACID frontend.
p0f
p0f has been kept up to date since the new author started with Version 2.0 a little over a year ago. This tool uses the libpcap library just like Snort to passively sniff packets off the network. The best description of how p0f detects the operating system comes from the author himself at http://lcamtuf.coredump.cx/p0f/:
The passive OS fingerprinting technique is based on analyzing the information sent by a remote host while performing usual communication tasks—such as whenever a remote party visits your webpage, connects to your MTA—or whenever you connect to a remote system while browsing the web or performing other routine tasks. In contrast to active fingerprinting (with tools such as NMAP or Queso), the process of passive fingerprinting does not generate any additional or unusual traffic, and thus cannot be detected. Captured packets contain enough information to identify the remote OS, thanks to subtle differences between TCP/IP stacks, and sometimes certain implementation flaws that, although harmless, make certain systems quite unique. Some additional metrics can be used to gather information about the configuration of a remote system or even its ISP and network setup.
This tool can be used in conjunction with Snort to help accomplish the same goals as those of the snortfp project, though with a little less work. One possible use if you are not planning on pushing this data into an ESM and don’t want to modify your frontend for IDS data would be to create a new frontend for this data to be searched in addition to the IDS data. While creating an additional step in your analyst’s investigation process, it might prove useful in determining network threat. The following example creates a p0f logfile that is rotated and marked for the date.
#!/bin/sh #
mydate=`date +"%d%m%Y" `


echo "STOPPING p0f detection"

killall p0f

echo "Rotating LOGS"

mv /logs/p0f.log /logs/p0f.log.$mydate


echo "STARTING P0f detection"

p0f -i <interface> -o /logs/p0f.log -l &

p0fPID=`ps -aux | grep p0f | grep -v "grep" | awk '{ print $2 }' `

echo "Started p0f with PID: $p0fPID "
# All Done
For simplicity, we’ll set this script to rotate daily. The following example should be added to your crontab on your sensor(s) to rotate the previous script every day at 11:55 PM.
# edit crontab (crontab -e) and add
55  11 * * * /bin/sh /path/to/the/above/script
Another solution would be to log the p0f logs into a database to be searched from a web frontend, ESM/SIM, or other custom tool. The advantages of placing logs in a database are:
- Scalability
Databases are easier to manage and maintain than flat files, especially in high traffic networks.
- Searchable
Once the logs are in a database, you can create charts, graphs, and even trends from the data for reports.
- Limited access
If you work with law enforcement at some point, you’ll find it handy if the data has as few modifications as possible and comes from as few sources as possible. For example, set up one account with write access and no read access, using this account for the portion of any tool that actually collects the data, while creating another account for searching through the data that has read and search permissions but not change access permissions.
As of p0f Version 1, there was a project from Bill Stearns called p0f-mysql that gave some support to logging p0f data to a database. However, in p0f Version 2.x there is a new project called p0f-db that supports both MySQL and PostgreSQL database formats for the data. Again, however, this seems to work only on Linux platforms and not BSD platforms. This application is actually a second application to run as an output portion of p0f. First download and install the source code, available at the following site: http://nk.puslapiai.lt/projects/p0f_db/:
bash$bunzip2 p0f_db-0.3.tar.bz2 | tar xvf -bash$./configure --with-mysql & make# OR if you prefer PostgreSQL #bash$./configure --with-postgres & make
Once this compiles correctly, create the database and account for p0f_db to use (using the same method as for the ACID setup). The following code uses the direct MySQL command line; if you are not comfortable editing a MySQL database through this method, a web-based tool called phpmyadmin is available at http://www.phpmyadmin.net or http://sourceforge.net.
bash$mysql -u root -p# Create the database mysql>CREATE database p0f_db;# create the user for the database mysql>GRANT UPDATE, INTSERT, SELECT on p0f_db.* TOp0fdata@localhostIDENTIFIED BY "password";mysql>flush privileges;mysql>exit
Once the database and its permissions have been set, remove
the snort-inline options from the p0f-db code, unless you are
deploying inline on a sensor. Edit the file in p0f_db/doc/create_mysql.sql removing or
commenting out all lines that start with DROP. Once complete, create the schema for
the database to use to handle data.
bash$ mysql -D p0f_db < doc/create_mysql.sql
#
Next edit the file p0f_db.conf with the database information from the previous example.
#
mysql host=localhost user=p0fdata password=password dbname=p0f_db
Finally, now that the database is set up to handle the p0f-db data, simply start p0f-db and watch for errors to correct. If no errors are found, simply run either via script/cron or directly as needed, as in the following:
bash$ ./src/p0f_db ---config=doc/p0f_db.conf ---log=/logs/p0f.logHopefully these examples should give you some ideas on how to use and integrate this information into the processes and procedures your analysts follow when investigating an event.
See Also
Snort!(fp) (http://mysite.verizon.net/sdreed)
p0f (http://lcamtuf.coredump.cx/p0f.shtmlhttp://lcamtuf.coredump.cx/p0f.shtml)
p0f_db (http://nk.puslapiai.lt/projects/p0f_db/)
p0f-mysql (http://www.stearns.org/p0f-mysql)
Sourcefire (http://www.sourcefire.com)
7.9. Working with Honeypots and Honeynets
Solution
What are honeypots and honeynets? Why would you run one?
A honeypot is “a system whose value is being probed, attacked, or compromised” (project.honeynet.org). The Honeynet Project is a group of individuals who study honeynets from around the world. Different organizations have different uses for honeynet data—from research and tactics in the case of the Honeynet Project to nabbing criminals, as is the case with some law enforcement and government agencies. A honeynet is a group or network of honeypots, which are usually either actual machines or virtual hosts, such as with a tool such as VMware. For the purpose of this discussion, most organizations use honeypots or honeynets only for research such as studying attackers’ tactics. If your organization employs legal honeypots (nets), your corporate legal department should be consulted with first.
There are three great uses for Snort when it comes to honeypots and honeynets:
Use Snort as a simple sniffer or packet logger to monitor attacker activity.
Use Snort as a network IDS to log and alert on attacker activity.
Use Snort Inline as an IPS to control outgoing packets from a honeypot/honeynet and nullify attacker attempts.
Discussion
Snort is great for recording all traffic entering and exiting your honeypot or honeynet. The simplest way to use it is in passive mode via a switch span port or a network tap. This allows Snort to stealthily capture any attacker activity. In this scenario, you can use Snort in any of its three modes, depending on your needs: packet sniffer, packet logger, or NIDS. A newer approach to integrating Snort with honeynets is with Snort Inline. Snort Inline sits between network segments and acts as a layer 2 bridge, passing traffic between interfaces. Once again, Snort is stealthy in this mode because it does not have an IP address and does not add a hop in the network, making it virtually undetectable. Snort Inline also provides intrusion prevention system (IPS) technology. This can mitigate or nullify attacks as they occur, without the attacker’s knowledge. It runs on a Linux system and uses iptables packet queuing to collect and make decisions about packets as they traverse the system’s interfaces. Using Snort on a production network, as an IPS allows you to block attacks or replace the content in them to nullify the attack. Using Snort Inline’s additional rule actions does this:
dropDrops the packet using Iptables and logs via Snort
rejectDrops the packet using Iptables and logs to syslog, then the communication is closed by either TCP RST for TCP sessions or an ICMP port-unreachable message for UDP
sdropDrops the packet using Iptables but does not log it
replaceThe rule language reference with the ability to replace hostile text with the same size harmless text in payload when running Snort inline
Snort Inline can be used to control outgoing packets from a honeypot or honeynet.
If a honeypot is compromised by a worm or similar attack, Snort Inline
can use its new rule keywords to keep the worm from propagating
outside of the network. It can also keep an attacker from using a
compromised honeypot to attack other systems outside the network. Even
more beneficial is the replace
keyword. By replacing the content of the attack as it traverses the
network, the attacker will not know why the attack isn’t working,
giving the IDS team more time to analyze attacker behavior and
techniques. Since all Snort Inline actions are logged, this gives the
team an abundance of valuable information for analysis, including
types of attacks, attack tools, and attacker skill sets.
The following is an example of a Snort Inline rule to drop packets:
drop tcp $HOME_NET any $EXTERNAL_NET 53 (msg:"DNS EXPLOIT named"; flags:
A+; content:"|CD80 E8D7 FFFFFF|/bin/sh";)
The following is an example of a Snort Inline rule to change packet contents:
alert tcp $HOME_NET any -> $EXTERNAL_NET 53 (msg:"DNS EXPLOIT named";
flags: A+; content:"|CD80 E8D7 FFFFFF|/bin/sh"; replace:"|0000 E8D7
FFFFFF|/ben/sh";)
The Honeynet Project has been using Snort Inline extensively and has incorporated it into their Honeywall CD-ROM. Some of the Snort Inline functionality also has been incorporated into the Snort 2.3 release; however, it continues to refer to the Snort Inline project for the latest features and advancements. When working with honeypots and honeynets, always remember to consult your organization’s legal department and get permission first!
7.10. Performing Forensics Using Snort
Solution
The most important step you can take when using Snort to perform forensics is to make sure you have at least one instance of Snort capturing full packets in binary mode. It’s even a good idea to have a backup (or two) of this binary data. Once you have the data stored in binary mode, you can use a tool like Ethereal to read in the packet captures and save the data that you want to a new file. This may be the contents of an FTP session or the installation of a rootkit, or some other type of important data for analysis.
There are two other keywords that can be used within Snort rules to collect specific data:
logto:filenameEvents that trigger rules with this keyword will be written to a separate file.
Session:printableEvents that trigger rules with this keyword will output all ASCII characters of a connection—for example, an HTTP, FTP, or Telnet session—to a human readable file.
It is best to have both the binary packet captures as well as the human readable ASCII files.
Discussion
Forensics may be performed as part of a larger incident-handling process or part of your honeypot/honeynet analysis. If it is being performed as part of the incident-handling process, it is important to have a set of well-established processes and procedures. More details on incident handling and interacting with law enforcement can be found in the recipes “Snort and Investigations,” “Snort as Legal Evidence in the U.S.,” and “Snort as Legal Evidence in the U.K.”
When dealing with system forensics, most of the time attacker tools and programs are deleted from the system. As long as the attack was remote, the network forensics logs will have a capture of the files being transferred to the target machine and any commands that were given over the network. Ethereal is a great tool to use to “follow TCP streams” to reconstruct network traffic. An important benefit of network forensics data is that it serves as a backup in a case when the investigation team is unable to recover any evidence from a target machine.
Finally, it is important to have solid organizational policies. You must have specific policies that allow you to capture and maintain forensics information as part of your job responsibilities. You need a policy that allows you to store and provide privacy information about your users to outside agencies. This is especially important when dealing with law enforcement.
See Also
Orebaugh, Angela D. and Gilbert Ramirez. Ethereal Packet Sniffing. Rockland, MA: Syngress, 2004.
7.11. Snort and Investigations
Problem
We have been using Snort for some time as our IDS platform. But now that we have a criminal activity that we caught, how do we help/assist law enforcement with our logs?
Solution
The first thing a government or military law enforcement investigation will ask is: how many people have access to the data? The next question will be: has the data been changed by anyone?
These are only some of the questions that will be posed to you by an investigation team. The other thing to keep in mind is that you should have your detection policy and methodology documented in your procedures. This is especially important in investigations involving someone’s privacy. For example, you might have a documented procedure of detecting porn on your network with generic keyword searches. If you find a user breaking the policy, the documented procedure will back up your team no matter who the user is. Unfortunately, it really does happen: high-ranking employees you catch violating corporate policy may turn and accuse you or your team of violating their privacy rights. A documented procedure protects your company and your CIRT team from being sued.
The second point worth making is that different law enforcement agencies will want different types of data. The level of interaction between your team and theirs will also vary with each incident. Your documented procedures should help maintain the chain of custody as well as the chain of evidence.
Discussion
One of the easiest ways to help a law enforcement group is to hand them your documented processes and procedures. This can help them for several reasons:
They understand the function and mode of operation for your team. This can help them frame how/why you brought the event to their attention.
They understand who has access to your data. Does your IDS data lie out of band? Who can read/see the data? Encrypted data paths from your sensors to your backends are good.
They understand what kind of data to ask for. If your procedures say you can’t keep full TCPDump logs due to having a high-speed, high-bandwidth network, they know they are only going to get session and/or single-packet alarm data, such as from Snort.
One suggestion for teams that have to deal with law enforcement quite often, such as ISPs or government/financial teams, would be to sign/encrypt your logs. For example, if you rotate your Snort alert file every 24 hours, what happens to the old file? Is it kept? Where? Is it moved offline?
If you keep the old logs on the sensors, why not sign the files with md5 hashes, for example. Then take the hashes to be stored on a write-only file/media on, say, the backend device(s). For example in the following script, we create a hidden file on the sensor that should have the same hashes as the file on our backend, so when we go to collect the logs for the date in question for law enforcement, we can show that the files haven’t changed since they were collected, and no one has been able to easily change the data. (Or at least the data can’t be changed easily, because someone familiar with your system could simply recreate or delete the files. However, if your sensors and backend are compromised, you have bigger problems to deal with!)
The following script could be used to help generate law enforcement-friendly logfiles. This script is run as a nonprivileged user scripts while using encrypted scp to transfer the logfiles. This script is called once a day via cron at 11:55 PM from the sensor.
55 23 * * * /bin/sh /scripts/IDS_SEC.sh > /dev/null
This script creates the hashes of the valid files, and then copies the file to the server and a hidden directory on the sensor. However, for high traffic or high-security networks, being called once an hour might be more appropriate.
# The script could look like this
#!/bin/sh
#
# Variables
mydate=`date +"%m%d%Y" `

# remove any possible old file
rm -f /tmp/hash.txt

# create the new temp file
touch /tmp/hash.txt

# sign the new one
md5 /log/snort/alert.10052004.gz > /tmp/hash.txt
md5 /log/p0f/pof.log.10052004.gz >> /tmp/hash.txt
md5 /log/snort/session.log.10052004.gz >> /tmp/hash.txt

# now send the hash to the backend
scp 10.0.1.1:/log/SENSORS/sensor1/SEC_LOG.$mydate /tmp/hash.txt

# write the hash file to a hidden file on the sensor for dual check

echo "LOGS FOR $mydate" >> /root/.SEC_LOGS
cat /tmp/hash.txt >> /root/.SEC_LOGS

# remove the evidence
rm -f /tmp/hash.txt

# All done!
This can apply also to your Snort “tagged” sessions as well as for your TCPDump logs, the simple point being: if you can show that your documented IDS procedures tell you to automatically sign your logfiles and the logs haven’t been touched since they were written, then law enforcement will have an easier time showing that the data was collected and held in a manner close to a chain of evidence. While non-law enforcement personnel aren’t held to as high a standard as law enforcement, this will help in an investigation.
Another example is if you have IDS data in a database, such as for ACID. Law enforcement personnel need to be shown that the data can be inserted into the database only by one means, the sensors, while the data can be sorted, organized, read, deleted (depending on the organization) from only one other method. Another help is to show how the data travels from the sensor(s) to the database. For example, if you are using the encrypted SSL/MySQL recipe from Chapter 1, then unless an attacker is between your IDS sensors and backend with an SSL decrypting/re-encrypted device, he can’t see/tamper with the data. If once your IDS data is inserted into the database the data is encoded, such as with a base64 algorithm, it’s not simple to change or remove the data cleanly without leaving a trace of evidence to track with.
This can be set in the snort.conf, file as in the following:
# snort.conf file example
output database: log, mysql, user=snortuser password=password dbname=snort
encoding=base64 host=localhost sensor_name=sensor1
When combined with the native encryption of MySQL/OpenSSL, you now have shown that the data can’t be tampered with very easily.
Finally, if you can demonstrate that your procedures document the attempts at maintaining a secure, verifiable log infrastructure, most law enforcement and legal teams will be able to testify/use your data with a level of confidence.
While keeping this in mind, remember that your procedures and policies will provide your team and organization with the top-cover that you need when law enforcement is called in and your data is put to the test. If you maintain this secure infrastructure without having it documented, law enforcement and the legal system may not be able to use your data. For example, at a previous employer, we were able to gather some information about some network traffic that was not really outside our procedures, but more like a side-step. When we handed the data over to law enforcement, they thought it was great until the officer in charge asked us how we got the data because it didn’t look like anything we had documented. It turned out they couldn’t use the data, and so we had to prove otherwise that the attack had indeed occurred. Now we went back after the fact to change our procedures, but the damage was done. Remember that each law enforcement agency is going to ask for different types of data and just work with them best you can for each situation.
See Also
Beale, Jay. Snort 2.1 Intrusion Detection. Rockland, MA: Syngress Publishing, 2004.
FBI computer crimes division web site
Attend local FBI Infraguard meeting to ask agents yourself
Your organization’s Legal/Law Enforcement division
7.12. Snort as Legal Evidence in the U.S.
Problem
We have been dealing with law enforcement on a case involving our network. How should we handle our data when using it as legal evidence in a case?
Solution
Simply follow the guidelines and suggestions stated earlier. For example, if your site is involved in interstate business, any compromise is automatically a federal case under the Computer Fraud and Abuse Act (U.S. Code Title 18, section 1030) as a protected computer. Also, with the passing of the USA Patriot Act, section 217 allows for organizations to monitor their networks for trespassers. There are several sections of the U.S. Code Title 18 that step through all parts of an investigation about which your organization might have questions. If you are unsure of your bounds, either check with your legal department or contact your local FBI infraguard chapter at http://www.infraguard.net.
Document and demonstrate to law enforcement and officers of the court that your data goes through as few hands as possible. It is also important to demonstrate that your data can’t be read/tampered with easily. One possible method is through use of encryption, digital signatures, out of band infrastructures, and/or detection through normal means that are documented.
Discussion
Another thought would be to make sure that your corporate legal department has signed off on your organization’s acceptable use and consent to monitoring documentation. This can really help for internal issues such as firing and termination of employees and contractors.
Use the previous example script, or create your own to sign and store your logs securely. For example, if your organization can afford an ESM/SIM, get the vendor to accept the log hashes or store them somewhere yu can easily gather and maintain them. For example, some ESM/SIM vendors offer custom reports. So create a report called Law Enforcement and have that report not only pull the IDS logs but print the hashes for the logfiles that law enforcement is going to gather. This way, you can hand them a hard copy, and then they can physically sign off and show that the data was maintained from your team to theirs, such as in the following. However, one would hope your vendor would have a much cleaner and prettier report, if for no other reason than to show to management:
########################################################
#  TEXT REPORT FOR 10 October,2004                     #
#                                                      #
#  INCIDENT NUMBER: 2004-09 Porn use (internal)        #
#                                                      #
# Created by: John Simpleton (Day shift - Analyst)     #
# FOR: John Q. Law (FBI)                               #
#                                                      #
# Incident description:                                #
# IDS events triggered on possible company violation   #
# (porn) when investigated discovered law enforcement  #
# was needed to be involved.                           #
#                                                      #
#                                                      #
# IDS LOGS:                                            #
# File name MD5 Hash on file                           #
# snort.08102004 d332lhl4hj43hhl3hl3hl24hl4khlkh       #
# snort.09102004 kj4khj4lkl4khk3lhkl5jl5j6kl7j56       #
# session.log.08102004 33kj4klj534kl53kl6jk5lj6l5k4j6  #
# session.log.08102004 4j5klj43lk5j6lkj45l65kj4k74k    #
#                                                      #
# _ _ _ _ _ _ _ _ _ _ Date                             #
# _ _ _ _ _ _ _ _ _ _ _ _ _ _ _ _ _ _ IDS personnel    #
#                                                      #
# _ _ _ _ _ _ _ _ _ _ _ _ _ _ _ _ _ _ _ LE personnel   #
#                                                      #
#  (Print and store hard copy in file 13)              #
#                                                      #
########################################################
See Also
7.13. Snort as Evidence in the U.K.
Problem
You run a network, and you want to ensure that you can prosecute anyone who attempts to breach your network security.
Solution
Take all reasonable steps to ensure that your evidence can’t be contaminated. Ensure that you have documented your system, policies, and procedures adequately, and also in cases of breach, ensure that you document the steps you take to resolve the situation.
Discussion
This is a difficult area and can be substantially different depending upon where you are. In the United Kingdom, prosecutions are most likely to be brought under the Computer Misuse Act (1990), which creates the following offenses:
Unauthorized access to computer material.
Unauthorized access with intent to commit or facilitate commission of further offenses.
Unauthorized modification of computer material.
Each offense has a specific criteria defining guilt, which, like most U.K. law, requires that the offender intentionally commit the offense or intend to commit the offense. To help prove this, it is advisable that you use banners to notify anyone connecting to the service or computer that it is a system that requires specific authorization to connect to it.
To prosecute, you must show that:
The offender knew that it was a secure resource.
The offender intentionally ignored such a fact.
Snort is capable of logging all network traffic, so you can show that a message indicating the authorization requirements has been sent to the offender and that she has persisted in connecting past this point.
You must, however, ensure that there is no way that your logging system can be altered. This preserves the “chain of evidence” so that there is no way the data can be corrupted, altered, or lost. You should ensure that your Snort system is secure—ideally with no network access at all, making use of taps to get data off the network without presenting the machine to the network at all.
Once you have determined that an event has taken place, it is vital that you contact your local law enforcement agency and notify them immediately. They may send someone to supervise the collection of evidence; comply with their wishes and be prepared to give them as much help as they require. It is highly likely that they will want to see documentation regarding the configuration of the system, and the procedures that you followed to determine that there has been a breach. This is to ensure that the data has had no way of being altered inadvertently, or if it has, that such an alteration has affected the quality of the data. They will most likely require that an image of the system and the data be taken—this may be to a specific forensic system or it may just be a hard copy to tape or CD. When setting up your system, you should consider providing such a mechanism for getting data off, with at least a writeable CD drive.
The key point to remember is that at any point in the process you must be able to account for what has happened to the data, who has had access to it, and what procedures have been carried out on it. This will allow a court to determine its accuracy, and hopefully get you your conviction.
See Also
Computer Misuse Act, 1990
7.14. Snort as a Virus Detection Tool
Solution
Using the ClamAV engine (http://www.clamav.net), several Snort developers from the open source community (Will Metcalf and Victor Julien) have been able to create a Snort preprocessor that can be used to detect viruses such as web-based, mail-based, and several other ports. One word of caution, though: this tool, while helpful, can place an extra load on a sensor. It should be deployed as its own sensor so as to not take processor time and space away from your main sensor platform. However, the value of a tool such as this should be immediately visible in demonstrating the threat posed by your RAS/VPN users, or even your remote sites that connect back into your network.
For example, if you have a RAS connection that connects directly to your network core without passing through any or little defenses, what would be the first line to be breached if a worm outbreak were to occur? Your RAS link would promptly help your network defense team discover which machines the patch management team didn’t get to finish.
Another reason to run this preprocessor is that AV vendors often get detection methods for viruses and Trojans before the IDS community does. So for example with the ms04-028 exploit (jpeg JFIF exploit), ClamAV had an update that would detect the exploit, while the Snort community came out with several that worked only over HTTP. So when you are doing your threat count at the end of the day, you can determine that the exploit came in eight times over the Web and was correctly killed by the user AV software on the desktop, while the server team missed the 10 times it came in over SMTP through HTML emails.
Discussion
To enable this preprocessor, you have to patch Snort and first get the file from:
| http://sourceforge.net/tracker/download.php?group_id=78497&atid=553469&file_id=98150&aid=1011054. |
This patch has been tested on Linux and BSD platforms. To enable it, we are going to follow these procedures to install the clamAV software and get the most current AV database, and then install Snort with the patch to log to a database (ACID, for simplicity). Following these instructions, you will have an antivirus detecting Snort that logs to a database (MySQL, for example).
Once the ClamAV source code is downloaded from http://www.clamav.net, it needs to be installed. At the time of writing, the most current version is 0.80, which will successfully detect the jpeg exploit found in MS04-028! This tool runs as its own user, so you’ll have to create an account as well before installing. This account is also specified at install time to make sure the tool is compiled correctly.
root#adduser clamavroot#./configure --with-user=clamav & make
If no errors are displayed after the make is complete, install the tool to the default location of /usr/local/share/clamAV. Then make a test run to make sure the executables compiled correctly using the following example.
root#/usr/local/bin/clamscan /home/<username>
If the summary doesn’t look something like the following, the install failed, minus the actual exploit code.
[root# /usr/local/bin/clamscan /home/<username>/
/home/<username>//.bash_logout: OK
/home/<username>//.bash_profile: OK
/home/<username>//.bashrc: OK
/home/<username>//.bash_history: OK
/home/<username>//.viminfo: OK
/home/<username>//virus-jpeg.zip: Exploit.JPEG.Comment.4 FOUND
/home/<username>//.pinerc: OK
/home/<username>//p0f_db-0.3.tar: OK
/home/<username>//snort-2.2.0.tar.gz: OK

----------- SCAN SUMMARY -----------
Known viruses: 24618
Scanned directories: 1
Scanned files: 12
Infected files: 1
Data scanned: 28.71 MB
I/O buffer size: 131072 bytes
Time: 51.797 sec (0 m 51 s)
Now that ClamAV is installed and working, it is time to update the ClamAV database files with the most recent virus datafiles from http://www.clamAV.net. You can probably script the following example to pull the files daily, if your sensors aren’t out of band.
Root#cd /usr/local/share/clamavroot#wgethttp://db.local.clamav.net/main.cvd root#wgethttp://db.local.clamav.net/daily.cvd
Now that ClamAV is working on the sensor, it is time to build Snort 2.2.x to use the ClamAV preprocessor. Using the patch found at the following link:
| http://sourceforge.net/tracker/download.php?group_id=78497&atid=553469&file_id=98150&aid=1011054 |
The Snort source code will have to be patched to use the preprocessor. (A very special thanks to William Metcalf for his help in getting this preprocessor to compile.) Once the patching is done, Snort will have to be resourced to make the changes before compile time.
root#patch -p0 < clamav-snortv-2.2.0.diff# Either run root#autoreconf -f# OR #root#libtoolize -f & aclocal & autoheader & automake & autoconf
Now, compile Snort with the ClamAV preprocessor enabled, though
you will have to compile Snort with all the
ClamAV options. If all are not passed to the configure command, Snort does not compile
the preprocessor correctly! Once configure is completed with no errors, make
Snort as normal with make and
make install.
root#./configure --enable-clamav --with-clamav-includes=/usr/local/includes--with-clamav-defdir=/usr/local/share/clamav --with-mysql(--enable-debug ?optional) #
Finally, edit the snort.conf file to use the ClamAV preprocessor. The preprocessor has to be placed in the snort.conf file immediately after the stream4_reassemble preprocessor but before the http_inspect preprocessor, unless you want the preprocessor to detect test viruses such as EICAR only! One last suggestion would be to test the build in the local snort-2.2.x directory first, as in the following:
#"preprocessor clamav"
#
root# ./src/snort -c etc/snort.conf -i eth0 -l log -T
If you don’t get any errors such as “unknown preprocessor: ClamAV,” your build was successful. Simply install and change as necessary to start detecting viruses and Trojans on your network(s).
Unfortunately, there aren’t many hard stats yet on the load this places on Snort and the sensor. But for a safe bet, either place a new sensor with this enabled or use on a slow link for staging until you are comfortable using the patch.
Another thought is this will detect only the viruses passing by your sensor. If your organization is considering venturing down the path of intrusion prevention systems (IPS) and application firewalls, you might want to check out the new patch for snort-inline that drops the virus packets at the inline device.
Finally, there are several applications for this as seen earlier; the best to start out with is to demonstrate the risks exposed to your network(s) by remote/RAS/VPN users. This can help an organization weigh the risks of having those connections and the level of protection and assurance that needs to be applied to those connections. Another example would be to place it in front of a heavy-load mail server to demonstrate the cost of allowing spam email through your mail server. The possibility with this preprocessor is the limit of the team applying it and for what purpose.
See Also
Snort-inline patches (http://www.sourceforge.net)
snort-devel mailing list for community support
7.15. Staying Legal
Problem
Monitoring the activity of people is starting to enter questionable legal (not to mention ethical) grounds. How can you stay on the right side of it?
Solution
Know your legal requirements, be ethical, and you are unlikely to get burned.
Discussion
It is hard to write a section that will comprehensively cover all areas in all countries; each legal system has its own statutes and acts that apply to the area of computing. To give this section a fair appreciation, we are going to approach it from an ethical standpoint. There are sections of U.S. and U.K. law referenced in the “See Also” section at the end. To quote them would probably be counterproductive, as they are likely to send you to sleep—trust us, we’ve read them.
It is ethically wrong to spy on someone without good cause. In the case of detecting an attack or an attacker, your good cause is the protection of your business or personal assets. This is fairly simple, but you would still do well to include a banner to this effect at any point of access (e.g., FTP, web server, Telnet, SSh, etc.). Something along the lines of:
-----          This is Simon's FTP Server.         -----
Unauthorized access or unauthorized use is not permitted.
All use of this server is monitored for security reasons.
This quite clearly states that access is only for those authorized and that usage should also be authorized (so an employee uploading the latest Star Wars movie is also subject despite being authorized for access), and that all such usage is being monitored. It also states the reason for doing so. If you feel like adding a bit more emphasis to it, you can always add:
Anyone found to be in breach of authorized use will be
prosecuted to the fullest extent of the law.
It doesn’t really add much legally, but people might think a bit more if they think you might actually do something about it!
Legally, you are going to do pretty well against someone who is attempting to compromise the security of your systems.
“Your honor, my client’s privacy was invaded while he was exploiting a buffer overflow to deface the web site of the plaintiff.”
“Case Dismissed.”
In most (but not all—don’t count on it) countries, this is a criminal offense in itself. However, your own employees, and even your legitimate customers, are in a very different situation.
There is a significant difference between “attack” and “misuse,” as the previous FTP server/Star Wars example shows. As an employer, you need to define an acceptable use policy before you can monitor for acceptable use. If you don’t tell your employees what they can and can’t do, you can’t realistically expect them to know. You should be aware that the emphasis is on getting them to read the policy; ideally, you should have them sign a hardcopy of the policy and then keep it on record. This should be kept up to date, reissued, and hopefully re-signed. The time scale for this is dependant on your business, but annually is a good bet. Obviously, this doesn’t actually mean that anyone reads the thing—they just sign it and get back to work—but it does give you a position of far greater strength. A reasonable acceptable use policy is available for download from http://www.sans.org/resources/policies/; there are also a lot of good guidelines here for other areas of policy implementation.
If you are keeping information on computer, and this information could possibly be related to the actions of an individual, which they may be within IDS logs, you should be aware of your obligations under any personal data laws that may be in force in your country. A company once had issues with getting billing information for their software from another country, the billing records matched a username with duration of use of the software, and this was determined to be enough to identify an individual and prevent that data from being exported. Ensure that you either use the obfuscation feature until completely necessary, or are allowed to keep such information in order to avoid problems.