6 Corporate Level Strategies
You can’t do today’s job with yesterday’s methods and still be in business tomorrow
—Alfred Chandler
LEARNING OBJECTIVES
- Identify different strategies adopted by organizations at headquarter-level contrasted with business-level strategies
- Learn different types of strategies adopted by firms with different ambitions and requirements
- Familiarize with the tools used in corporate analysis and resource allocation among different businesses of a firm
- Understand the issues of diversification and how firms maintain focus and identify with inorganic growth trajectories
- Identify the rationale of the firms in strategic decisions of make, buy, ally, swap, or network
- Understand the relevance or irrelevance of core competencies, experience curve, and generic strategies
- Development of the brand.
- Multinational dealer network by expansion to different markets through acquisitions in a target market.
- Harnessing engineering expertise and R&D capability required for growth.
- Strengthening the ecosystem in the automobile manufacturing system of M&M.
- Achieving scale.
- Sourcing advantages.
- Corporate headquarter activity
- Looks to diversification opportunities
- Redefines the firm’s boundary
- Realigns strategic focus by strategic sale of certain businesses
- Allocates resources among different units
- Integrates different functional strategies
- Focus on global and/or macro environmental shifts and trends;
- Alignment of all businesses with one corporate mission and vision
- Considers economies of scale and scope.
Corporate-level strategy is the path that gives competitive advantage for a long period of time to a firm with multiple businesses as against business-level strategy that is for firms with a single business or for individual businesses of a conglomerate. The strategic frameworks, models, and tools defining an overall strategy for companies with many different businesses are different from the frameworks and tools that define strategic issues at business unit level. The main tasks of corporate-level strategy are identifying the business or set of businesses in which the firm would enter, invest, or compete, the organization structure the firm would have, the type of technology it would use, and capabilities the firm would build. The position of corporate strategy is given in Figure 6.1.
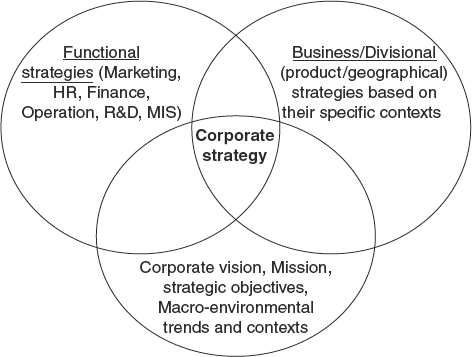
Figure 6.1 Position of corporate strategy
6.1 STRATEGIES AND COMPETITIVE ADVANTAGES IN DIVERSIFIED COMPANIES AND THEIR EVALUATION
The different units or businesses of a diversified company have their own business-level strategy based on each unit’s context, managerial skills, risk profiles, and so on. Resource allocation among different businesses becomes a key corporate strategy issue and there are many frameworks developed such as Boston consulting group (BCG) matrix, GE(General Electric) matrix that became very popular during 1970s to strategists in making resource allocations.
Frameworks are helpful in getting insights into the results of external analysis and internal analysis described in Chapters 2 and 3 and when the insights are, thus, structured that is likely to trigger the creative thought processes in a disciplined, purposeful manner (imagination with intention of crafting a good strategy). Each corporate entity may choose the most appropriate framework from among the available ones or design its own framework to suit its situations and intentions. There is no single best way to design, organize, or manage an organization according to contingency theory, but to maximize performance, an organization should match its resources, strategies, structures, and processes with its environment (Lawrence and Lorsch, 1967; Thompson, 1967; Donaldson, 2001; Sinha and Van de Van, 2005). At the corporate level, getting insights into these contingency factors or variables is important to design strategies that would maximize returns in terms of businesses to choose, production cost, delivery, product quality, production flexibility, leveraging resources, and so on. The integration of resources and activities are also an important element of corporate-level strategy.
6.1.1 Corporate Analysis
Corporate analysis is an in-depth evaluation of a corporate entity, its various businesses, and products in order to gain ‘insights’ into the current business portfolio and then ‘imagine’ a business portfolio for the future. It gives an understanding of the general corporate health, strengths, and the prospects for future growth, through a series of independent evaluations of each aspect of the operation, organization structure, outputs, finances, and growth opportunities. Examples are corporate risk analysis, corporate operational analysis, business growth screen, corporate growth analysis, and so on. The results provide information not only to the inside strategists but also to outside investors on growth prospects of a firm and its businesses.
6.1.2 Make, Buy, Ally, or Swap Decision Making
The benefits of internal production in the vertical value chain, as depicted in Figure 4.2 in Chapter 4, against costs and risks of using market to buy that particular function or utility, are weighed to determine the structure of the firm and what activities to focus on for in-house production (make). Transaction cost economics (TCE) focuses on conditions that lead firms to make rather than buy (Coarse, 1937; Williamson, 1985) or to ally (Williamson, 1999) looking at one transaction at a time. TCE explains why a given transaction may be more efficiently governed through either the market or the hierarchy. Thus, the boundary of the firm becomes permeable and flexible in different ways to interface with customers and suppliers, resulting in different designs of the structure of the firm. Different possible theoretical combinations of make, buy, or ally are given in Figure 6.2.
- ‘Make’ most in the value chain in-house.
- Buy most from market, less made in-house.
- Ally most-make little in-house.
- Make some inputs in-house and buy the same input from market also.
- Make and ally.
- Buy and ally, but make little.
- Make and buy and ally in more or less equal proportion.
- Chaotic –– no clear strategy on make or buy or ally.
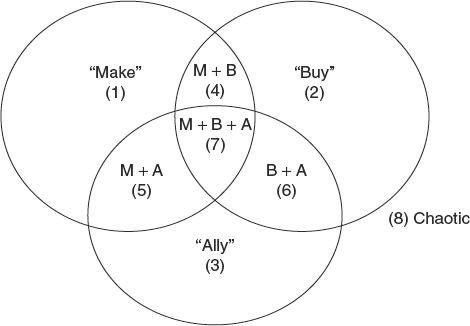
Figure 6.2 Different possible designs of the structure of a firm
Other than transaction costs, there are other considerations also in make or buy decisions. Make, buy, or ally decisions apply to different activities in the vertical value chain and also for the same activities in some firms. When the same input is made with some quantities in-house and some quantities are bought, it may be able to manage the market as a means to check over-pricing by suppliers or distributors. Some of the factors that motivate firms to decide on whether to make or buy, make, and buy or ally are given in Table 6.1.
Table 6.1 Factors affecting make, buy or, ally decisions
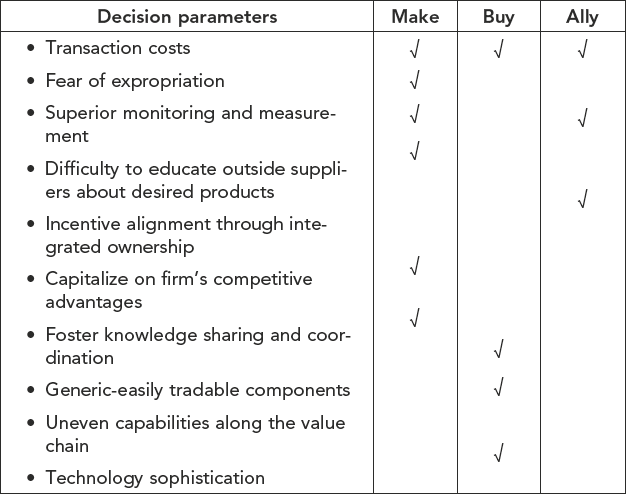
If there is fear of expropriation of value, then a firm makes in-house all its inputs, and depends less on market or other firms. However, a firm buys inputs that are generic and easily tradable, rather than in-house.
6.1.3 Boston Consulting Group Matrix or Growth Share Matrix
It is a framework developed by BCG, categorizing products within a firm’s portfolio as stars, cash cows, dogs, and question marks according to growth rate, market share, and positive or negative cash flow, as given in Figure 6.3. It is based on product life-cycle theory, where cash cows (low growth and high-market share product) are the foundation of a firm.
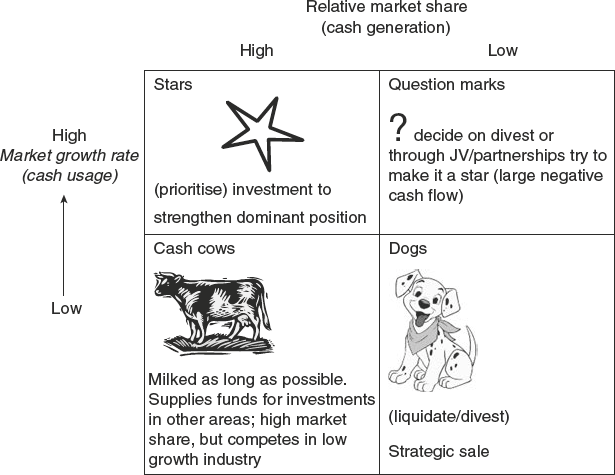
Figure 6.3 Boston consulting group matrix with insights from the framework in brackets
6.1.4 GE McKinsey Matrix or GE Nine-Cell Model or GE Business Screen
It is a corporate strategy framework developed by McKinsey and Co that gives more importance to market attractiveness when compared to the market growth focus of BCG matrix. Each SBU(Strategic Business unit) is assessed on the basis of competitive strength. To apply this tool, the factors that determine market attractiveness and competitive strengths are to be identified for a business in the particular environment in which it wants to operate. The factors of market attractiveness can be given as follows:
- Market segments identified and its size
- Growth of the identified market segment
- Pricing trends and industry profitability
- Intensity of competition
- Overall risk of returns in the industry
- Product differentiation possibilities
- Technological requirements
- Delivery methods
- Service particulars
Then, the competitive strength (business strength) is analysed in terms of competencies’, brand value, customers’ loyalty, product quantity, market share, market share growth rate, cost structure, and so on. Every factor on each of the two dimensions is assigned a weight. The choice of factors and the weights given vary from business unit to unit and involve research.
The analysis would give insights into what products to add and which market to focus on. It is also known as directional policy matrix with X-axis of industry attractiveness and Y-axis of competitive strength and each product or potential product is mapped as a pie chart. The diameter of each pie chart is proportional to the volume or revenue accruing to each. Several adaptations and improvements came to this basic nine-cell model on two dimensions as given in Figure 6.4. Industry attractiveness-business strength matrix (IA-BS) with several additional industry attractiveness and business strength factors, market life-cycle competitive strength matrix (a 12-cell matrix with the four market life-cycle stages of start, growth, maturity, and decline and three levels of business strength) and several other adaptations are employed in corporate analysis.
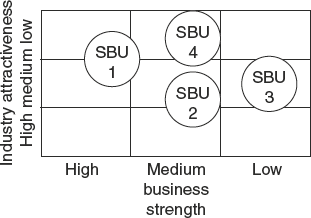
Figure 6.4 GE McKinsey matrix
6.1.5 IE Matrix (Internal–External Matrix)
It is a framework similar to BCG matrix, but positions various divisions of an organization in a nine-cell display (Figure 6.4A) based on two key dimensions: IFE total weighted score on X-axis and EFE total weighted score on Y-axis with low, medium, and high positions (score of 1.0 to 1.99 (low), 2.0 to 2.99 (medium), and 3.0 to 4.0 (strong)). This matrix offers insights whether to grow and build, hold, and maintain or harvest or divest the business.
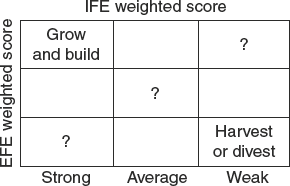
Figure 6.4A IE matrix
6.1.6 SPACE Matrix (Strategic Position and Action Evaluation Matrix)
It has four dimensions, which in turn comprising several key factors, when compared to BCG or GE or IE matrix. There are two internal dimensions: financial strength (FS) and competitive advantage (CA); further, there are, two external factors: environmental stability (ES) or turbulence and industry strength (IS) that together determine the four strategic postures of the firm. These four strategic postures namely aggressive, competitive, conservative, or defensive can be translated to four generic competitive strategies: that is, cost leadership, differentiation, focus, or defensiveness.
The key factors of each of the four dimensions are identified for each firm, assign values between 0 and 6 to each individual factor, and then, plot on a SPACE chart, as depicted in Figure 6.5, the averages of each group factor. The financial strength factors are ROI, leverage, liquidity, working capital, cash flow, and so on. For a firm that has an ES average score of 2.9, IS of 4.1, CA of 2.0, and FS of 3.1 makes a polygon.
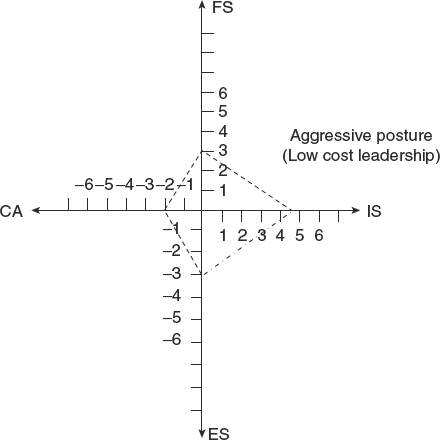
Figure 6.5 SPACE chart for a firm
6.1.7 Grand Strategy Matrix
It is a tool to evaluate alternate strategies based on two dimensions of a firm: competitive position and market growth with each having two levels giving a four-cell matrix, as shown in Figure 6.6. An organization is placed in any of the four quadrants when evaluated on these two dimensions, and then, the organization can choose the strategies appropriate for that quadrant.
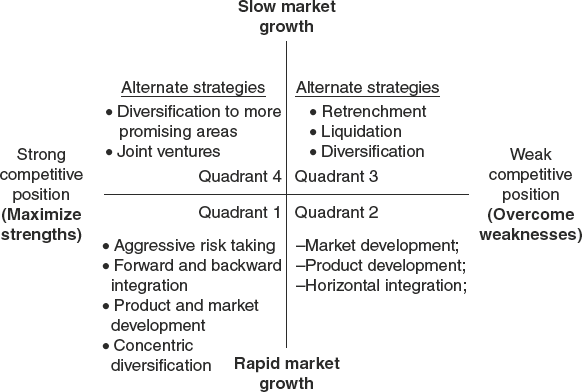
Figure 6.6 Grand strategy matrix
6.1.8 Quantitative Strategic Planning Matrix and Strategic Plan
Quantitative strategic planning (QSP) matrix is a technique used to determine the relative attractiveness of feasible alternate strategies, integrating relevant external and internal factors. Weights are given to a list of key external factors and key internal factors and then determine the attractiveness score to alternate strategies conceived intuitively. Corporate strategic alternatives such as whether to make, buy, or ally can, thus, be evaluated.
6.2 DIVERSIFICATION AND INTEGRATION STRATEGIES
The importance and need for corporate strategy is more in decisions of diversification and in leading multi-business firms. The term corporate strategy evolved for this purpose distinct from the unit-level strategy that is needed to make choices for just one business deciding the basic direction of the company and preparing it to meet future challenges.
- For growth by expansion
- High profitability by synergies
- Empire building
- Pressures of succession planning
- Create media hype to keep up share prices
- As part of pre-emption strategies
- For corporate brand-building
- As part of innovation
- As an overall risk minimization strategy (do not put all eggs in one basket!)
- To be on the forefront of technological changes
- To exploit capital and labour market inefficiencies.
A firm currently engaged in one type of activity proposing to enter into another type of business, with the expectation of adding further value to the whole firm, is said to be diversifying. During the 1960s, conglomerates started growing with numerous acquisitions. The main task of corporate-level strategy is to identify businesses in which the firm would compete and decisions of allocating resources among diversified companies. Corporate leadership is required to understand the relative merits of investment proposals coming from a range of businesses in different sectors with different time horizons, risk profiles, and management capabilities. During the 1970s, BCG developed a portfolio planning technique to resolve capital allocation-related issues. The growth–share matrix is used to classify businesses in terms of their strategic positions and opportunities. During the 1980s, value-based planning, using financial tools such as discounted cash flows, OE spreads, and hurdle rates came into practice to make strategic choices on different business units on the basis of economic returns.
During the 1990s, the issue of how to identify different businesses that should form a core portfolio for a corporation and how to add value to those businesses emerged, as the main issues of corporate strategy. According to Goold and Lukes (2008), the following three main alternative answers provide the basis for diversification.
- Diversification should be limited to those businesses with synergy.
- The corporate focus should be on exploiting core competences across different businesses.
- Successful diversification depends on building a portfolio of business that fits with the managerial ‘dominant logic’ of top executives and their management style.
The evolution of diversification approaches and issues in business is depicted in Figure 6.7, as developed by Goold and Lukes (2008).
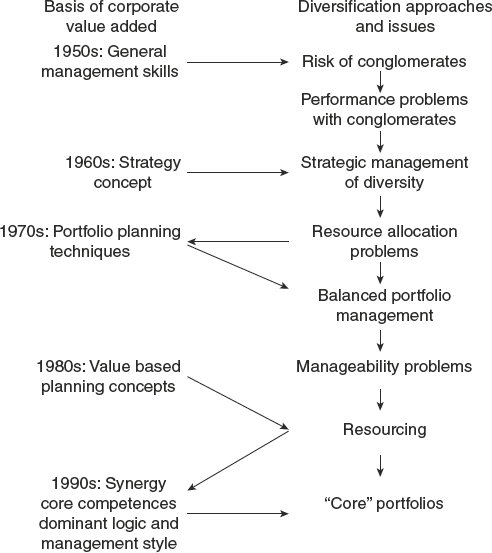
Figure 6.7 Diversification approaches and issues (Source: Goold and Lukes, 2008)
As the firm becomes more diverse, the complexity increases making the task of corporate strategy challenging, and then strategically common methods and approaches can be used in businesses that are similar. How businesses are to be conceptualized and how resource allocation decisions would be made towards advertising, new product development (NPD), delivery, services, HRD, and so on., would be entirely different for different types of businesses. ‘Managerial styles’ and ‘dominant logic’ operating in one firm or business cannot be applicable in another business that has vastly different requirements.
6.2.1 Types of Diversification Strategies
Diversification strategy is classified into seven categories by Rumelt (1982) according to the product or market relatedness of business at the corporate level.
- single business
- dominant vertical
- dominant constrained
- dominant linked unrelated
- related constrained
- related linked
- unrelated business
The diversification can be perceived in various ways as follows:
- Diversification into vertical production chain activities extending vertical boundary of the firm, thus making a product than buying from the market.
- Horizontal diversification into new products or services that may be related or unrelated to the existing products or services.
- Diversification into new markets with existing and/or new products.
- Diversification into new technological fields.
- Diversification into new marketing methods or channels like web use.
- Diversification of in-house production into new production methods.
The conventionally used classification scheme, however, takes into account diversification of products and/or markets. Vertical, horizontal, concentric, and conglomerate are another method of classifying diversification strategies.
6.2.2 Diversification Opportunities
A firm looking for growth through diversification either comes across opportunities or looks for it. According to TerWiesch and Illrich (2008), there are primarily two perspectives in seeking opportunities.
- Flow of opportunities arrives as a result of the firm’s overall innovation process and the arrival of these opportunities is not triggered by the explicit need for them (push perspective).
- Top managers identify gaps in the current portfolio relative to business strategy and want these gaps to be addressed (pull perspective).
Terwiesch and Illrich propose a flow diagram for portfolio planning (where individual opportunities for diversification collide with the firm-level objectives), as given in Table 6.2 that is primarily designed for R&D strategy.
Table 6.2 Portfolio planning process
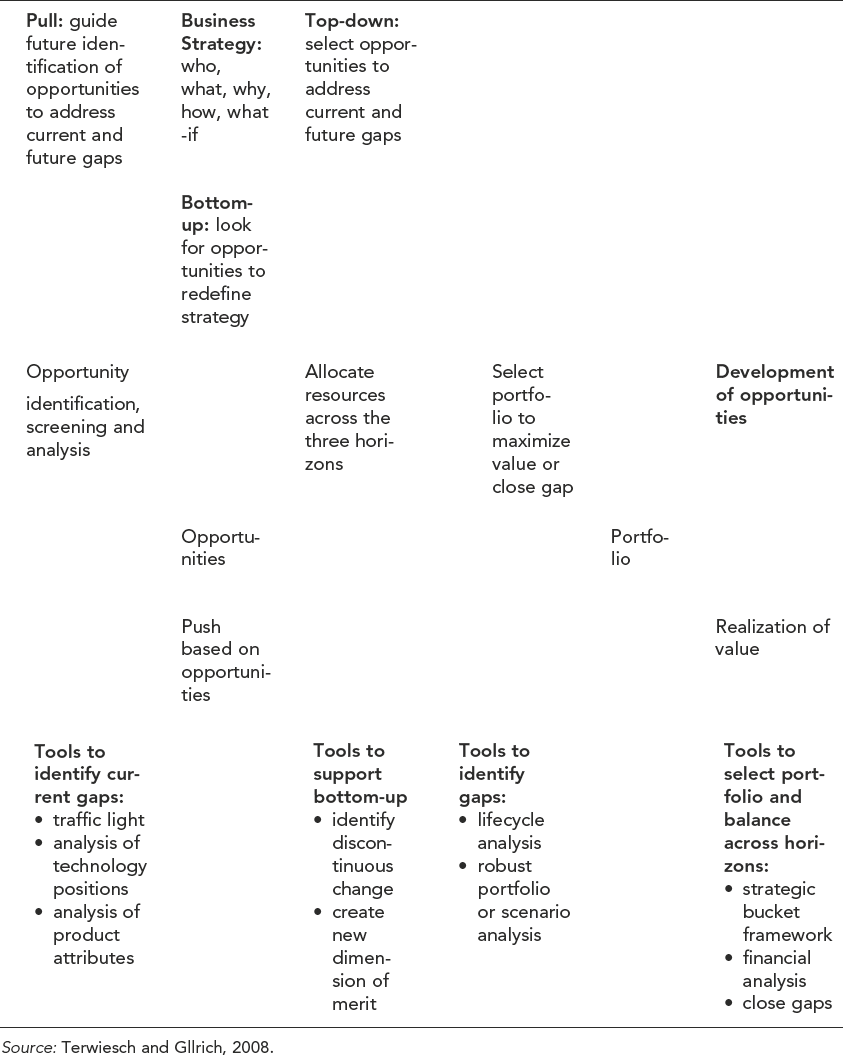
The portfolio strategy is built through five steps as follows:
- identify current gaps relative to business strategy
- identify future gaps
- balance between strengthening current strategic position and exploring future strategies
- create portfolio for each horizon or strategic domain
- seek opportunities in familiar (related diversification) and unfamiliar areas (unrelated diversification)
Opportunities for diversification are also measured with respect to market novelty and technological novelty, as depicted in Figure 6.8, (Terwiesch and Illrich, 2008) from the perspective of an automotive firm.
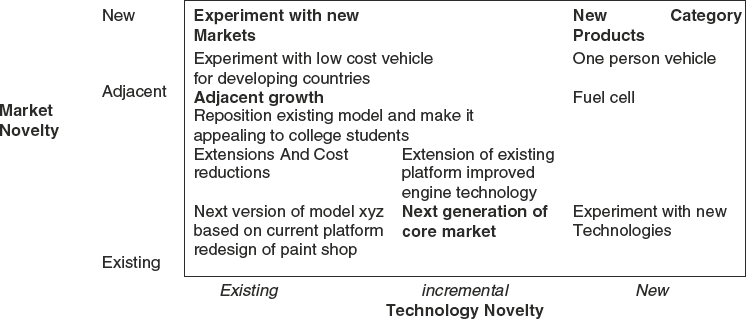
Figure 6.8 Classifying diversification opportunities on two dimensions (Source: Terwiesch and Gllrich, 2008)
- When there is threat to the main product in the long term.
- When a by-product can have bigger market; if that is converted into a new product.
- Making a new product, a partnership or acquisition are possible.
- To tap a new opportunity by using the existing strengths of the firm.
- To remove a key vulnerability of the organization.
- When value of a waste product is detected or technology for making it a product became available.
- When there is surplus financial resources to invest in new ventures.
- When there is marketing experience in a territory for one product, which can be used for marketing another product in the same territory. Market research complements and supports the opportunity.
- When to tie-up raw materials or any inputs needed for the main product, diversify as backward integration.
- R&D process brought out new products, in addition to process improvements in the existing business.
- There are no stars in the product portfolio and all are cash cows generating cash.
- When the functional structure is too rigid, diversify to new products in order to make the organization agile and innovative as a strategy for survival.
The above mentioned Market and Technology Novelty is built on three levels of uncertainty:
- low uncertainty (existing innovations)
- medium uncertainty (adjacent opportunities, related markets, and improved technologies).
- high uncertainty (new opportunities – new market, breakthrough technologies, and blue ocean strategies).
6.2.3 Corporate Entrepreneurship for Diversification
Product or service innovation and proactive initiatives are signs of entrepreneurship and many diversification decisions are akin to entrepreneurial decisions.
Diversification strategy as part of overall corporate strategy deals with the strategic selection of businesses for entrance or expansion based on an examination of their market or product, familiarity to the existing organizational product or market base (Roberts and Berry, 1985).
Even though a certain amount of innovativeness and entrepreneurship are needed for diversification decisions and seeking diversification opportunities, most of diversification strategy conventionally is oriented towards product or market relatedness and the synergy with the existing business except unrelated diversification (seventh-category in Rumelt’s typology). Corporate entrepreneurship strategy is about emergence, creation, and newness departing from customary way of doing business. Entrepreneurship refers to value creation by carrying out new combinations that cause discontinuity. However, corporate entrepreneurship involves not only creation of new business ventures, but also other innovative activities and orientations developing new products, services, technologies, management techniques, and competitive postures (Antoncic, 2006). Thus, diversification strategy sets direction for corporate entrepreneurship strategy making, leading to growth and profitability.
6.2.4 Technological Diversification
It means expansion of a firm’s technology base into a wide range of technology fields making the firm a multi-technology corporation.
Firms sometimes acquire knowledge in different technological fields, not only in the field in which its products or services are embedded. Technology portfolios in which knowledge is spread over many technological fields signal high levels of technological diversification. Just like related and unrelated diversification with respect to products, technology portfolios can be coherent or non-coherent. When different technology fields share a similar underlying knowledge base, a firm’s technology portfolio is considered technologically coherent. If different knowledge domains support the technology fields within a field, the technology portfolio is technologically non-coherent. According to Leten et al. (2007), the technological diversity of a firm’s technology portfolio is due to several reasons.
- Increasing complexity of products and production processes overtime making a firm to invest in a variety of technology fields.
- Effective assimilation of externally acquired technologies needs the presence of absorptive capacity and hence this absorptive capacity is to be maintained within the corporate domain.
- Firms explore and experiment with new technologies to learn about the commercial potential that may not be obvious.
- Firms use the excess R&D capabilities and other learning resources to diversify into promising new technologies.
- Technological complexity and uncertainty about future sources of breakthrough technologies.
- Technological diversification offers opportunities for cross-fertilization and technology fusion that may bring out innovative products.
Organizational design choices depend on composition and organization of technology portfolios. Larger integration, coordination, and communication costs are associated with technologically diversified firms (Grenstrand, 1988).
6.2.5 Parenting Advantage and Parenting Matrix
Multi-business companies comprise two elements: business ‘units’ and the ‘parent’. The business units are directly involved in value creation by producing and selling goods and services whereas the parent is involved less directly and more as an intermediary between the businesses and outside investors. A good fit between the characteristics of the parent and characteristics of the business units make a parent value addition. There are competing parents in the market place and a parent that has the characteristics to unlock maximum value from a business ‘unit’ is the best fit parent. If another parent would create more value, a change of ownership is better for the business.
How a parent should be designed and relate to its business units is as important as the decision about the portfolio of businesses – what should be sold, split, added, diluted, or strengthened. The relationship between parent and its units can be depicted in the parenting fit matrix, as given in Figure 6.9.
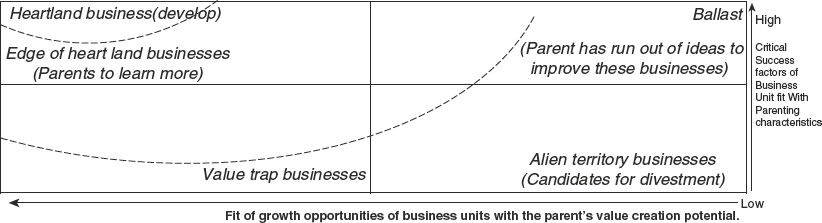
Figure 6.9 Parenting fit matrix
Heartland businesses are at the heart of corporate strategy, on which the parent focuses its attention more or allocates resources to acquire them. ‘Edge of heartland’ are close to the first group; but there are some misfitting characteristics. ‘Alien’ are at the opposite of heartland businesses about which parents have very little knowledge and the influence of the parent is likely to reduce its value. Ballast business provides stability and weight, as core business to a parent, but slows down the parent by taking away time that should have been spent on heartland businesses. ‘Value trap’ have elements of misfit, even though parents have insight about how they can be improved.
6.3 MERGERS, ACQUISITIONS, AND TAKEOVER STRATEGIES
Firms employ various methods to generate economies of scale. A linkage is established between two firms where similarities in the nature of resources associated with two or more value chains permit economies of scope to be achieved through some combination of shared resources. Figure 6.10 proposed by Neil Kay (2007) identifies some broad categories of resources that may be at least partially shared between two value chains of two business units selling different products.
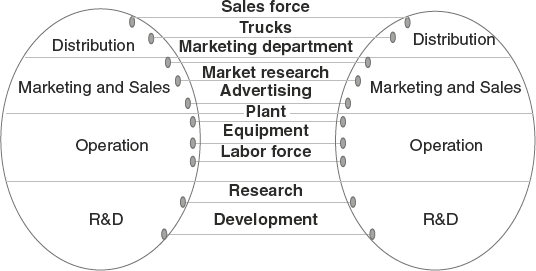
Figure 6.10 Categories of resources that may be shared between two firms (Source: Neil Key, 2007)
If one sales person sells two products than one, or one truck carries products of two firms, there is economies of scale. When physical and human capital are shareable between two firms, there is possibility of economies of scope as well.
There are a variety of ways firms expand through linkages between business units. These include merger, acquisition, joint venture, and franchising.
6.3.1 Merger or Acquisition
Merger and acquisition is one of the significant investment activities since 1990. Haleblian et al. (2009) reviewed the merger or acquisition research since 1990 and proposed a framework for merger or acquisition decisions with four reasons for the firms to acquire other firms as follows:
- value creation
- managerial factors, mostly self-interest
- environmental factors
- firm characteristics
Value creation is sought by the acquiring firm through economies of scale resulting in high pricing power and enhanced efficiency. Value is also sought by reducing costs, redeploying assets, and competency transfers generating economies of scope. Value is also unlocked by turning-around ineffective management of target firms.
Although acquisitions are intended to increase shareholder value, often acquisition destroy shareholder value as managers try to maximize their self-interest like high compensation and using discretionary powers in managing larger firms. There are also exaggerated self-confidence and ego satisfaction efforts leading to performance decline in addition to defence tactics of target managers to increase the value of their own stock, and so on unless the corporate governance structure is vigilant.
Environmental uncertainty and impending government regulations may motivate certain firms to diversify in order to get political clout, thereby influencing policies, preventing imitation, and absorbing needed resources through mergers. Firms tied through interlocking directorships and failure to shift the firm’s strategy with environmental changes are also reasons for acquisition activity.
A firm that experienced recent acquisitions with success is likely to venture out to acquire other firms for horizontal, vertical, or product extension diversification. A firm’s strategy is another firm characteristic leading to acquisitions.
Avoiding failures and sustaining competitive advantages through acquisitions or merger
A firm may be in the lookout for targets to merge or acquire due to its strategy of expansion or diversification, environmental compulsions or manager’s self-interests. Once the strategic decision is taken, the activity can be divided into four phases.
- pre-deal due diligence check phase
- deal negotiation and closing phase
- post-deal integration phase
- post-integration performance and/or merger repair phase
Each of these phases have its own required actions for a merger success. Galpinand Hernden (2008) has made a checklist for the right deal actions as listed in the following.
- Conducted thorough due diligence (operations, finances, systems, people).
- Began the integration planning process before the deal closed.
- Assigned appropriate integration resources early and kept them available throughout the integration process.
- Chose the best top team.
- Aligned executives around the deal goals and strategy.
- Developed and executed detailed integration plans.
- Measured, tracked, and reported progress of implementation activities against the integration plans.
- Top executives made and communicated key decisions as integration progressed in an efficient, timely, and coordinated manner.
- Developed, tracked, and reported balanced integration performance measures.
- Provided timely answers to workforce ‘me issues’.
- Employed a retention and ‘re-recruitment’ plan to keep key talents.
- Put in place a process to efficiently and fairly staff the new company.
- Compared and integrated the companies’ cultures.
- Avoided using the phrases that can kill integration.
- Addressed all of the integration action items in each location.
- Began all of the integration action items within the first 12 months of closing the deal.
Risks in merger or acquisition
Merger and acquisition decisions are risky as research have demonstrated that not all acquisitions lead to value creation to the acquiring firm, even though often value of target firm is increased.
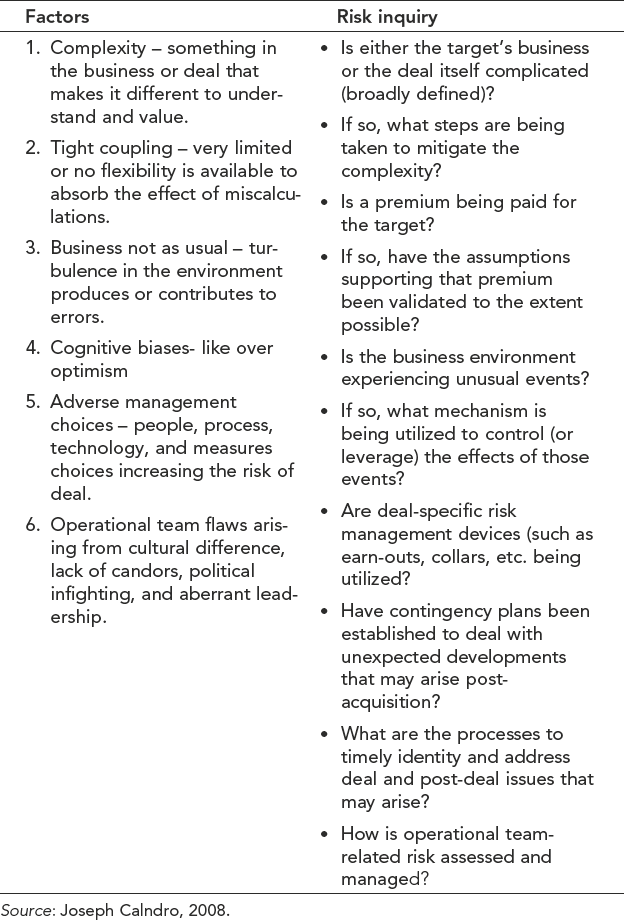
Merger or acquisition has a variety of risks, as proposed by Joseph Calndro (2008), which is listed in Table 6.3. These risk factors are originally proposed by Robert Bruner in 2005.
Table 6.3 Risks in merger or acquisitions
6.3.2 Takeover of Companies
Takeover is a method of purchase of a company called the target, by a firm called the acquirer or bidder by making an offer or bid. There are four types of takeovers: friendly, hostile, reverse, and backflip takeovers. In friendly takeovers, the process is an acquisition with or without due diligence check and transfer of shares and value, where both the shareholders and the board of the target firm agree to the bid.
- Organizational: management style, work culture, organization structure, systems, policies, governance structure, information systems, value systems, decision making structure, and process new hierarchies.
- People: level of salaries, working hours, appraisal methods, promotion policy, terms of appointments, qualification, diversity issues, customs, transfer of knowledge, cross-culture teams, pension funds, fear of who is going out, who is going up, meeting of hearts or a contract.
- Infrastructural: transfer of equipments, buildings, assets, furnishing,
- Political: trade unions, managing government relations, community relations, internal locus of power.
- Strategic: new strengths, key vulnerabilities, capabilities, competitive advantages, new threats, constraints, new opportunities, level of technology, new external environmental analysis, new stakeholders integration, quality standards, new corporate identity.
- Stakeholders: customer expectations, investors’ expectations, media reportage
- Financial: accounting principles, liabilities, cash flow, receipt and payment policies; foreign exchange risks, capital structure, transfer pricing policy, carrying depreciation, exchange rate fluctuations, and working capital requirements.
- Legal: competition law, tax law, VAT, service tax, industrial licenses, land laws, company laws, security law, environmental laws, contracts, tender procedure, PF, accreditations.
A hostile takeover occurs when the bid made by an acquirer is rejected by the target company’s management. Even though the board of management rejects the bid, the acquirer eventually gains control of the management of the target company, and thus, the takeover is effected in a hostile manner. In a hostile bid, the due diligence cannot be done and hence has high risk. There are several ways in which a hostile takeover is effected:
- A publicly made tender offers above the current market price of the shares or firm’s valuation.
- The acquirer quietly purchases enough shares in the open stock market without regulator’s attention or notice.
- The acquirer persuades enough shareholders to get a majority to replace the existing management, and the new board will approve the takeover.
- Enter into a joint venture partnership with the target firm and gradually wrest control.
When a private company takeovers a public company, it is called a reverse takeover and when the acquiring firm becomes a subsidiary of the acquired firm, such a takeover is called backflip takeover.
Takeovers are not always for profit, but for many other reasons and opportunities. It may be to get a distribution channel or technical knowhow or key talents or to eliminate competition.
6.3.3 Due Diligence Check of Target Firms for Merger or Takeover
Successful companies rely heavily on acquisitions to achieve their strategic goals even though the linkage is likely to be risky. It is believed that acquisitions are faster, cheaper, and less risky than organic expansion. To reduce risk, every acquirer needs its own checklist while conducting due diligences review to identify and eliminate major sources of potential risk before the transactions are closed. Bruce Nolop (2007) proposes a checklist with 13 areas that are given in Tables 6.4 and 6.5. Each of these 13 areas are further split into minute details.
Table 6.4 Due diligence checklist
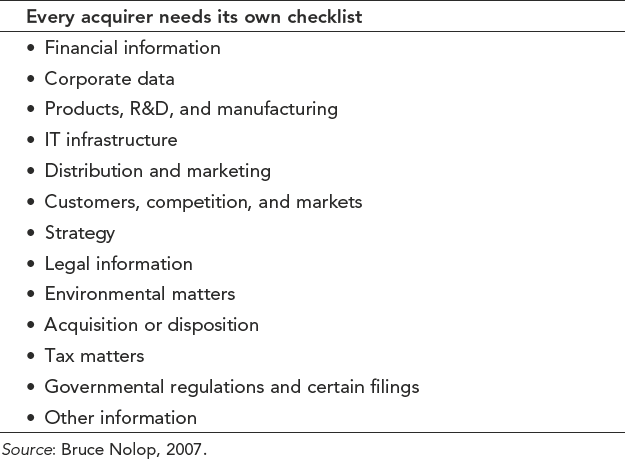
Table 6.5 Due diligence checklist for subarea ‘customers, competition, and market’
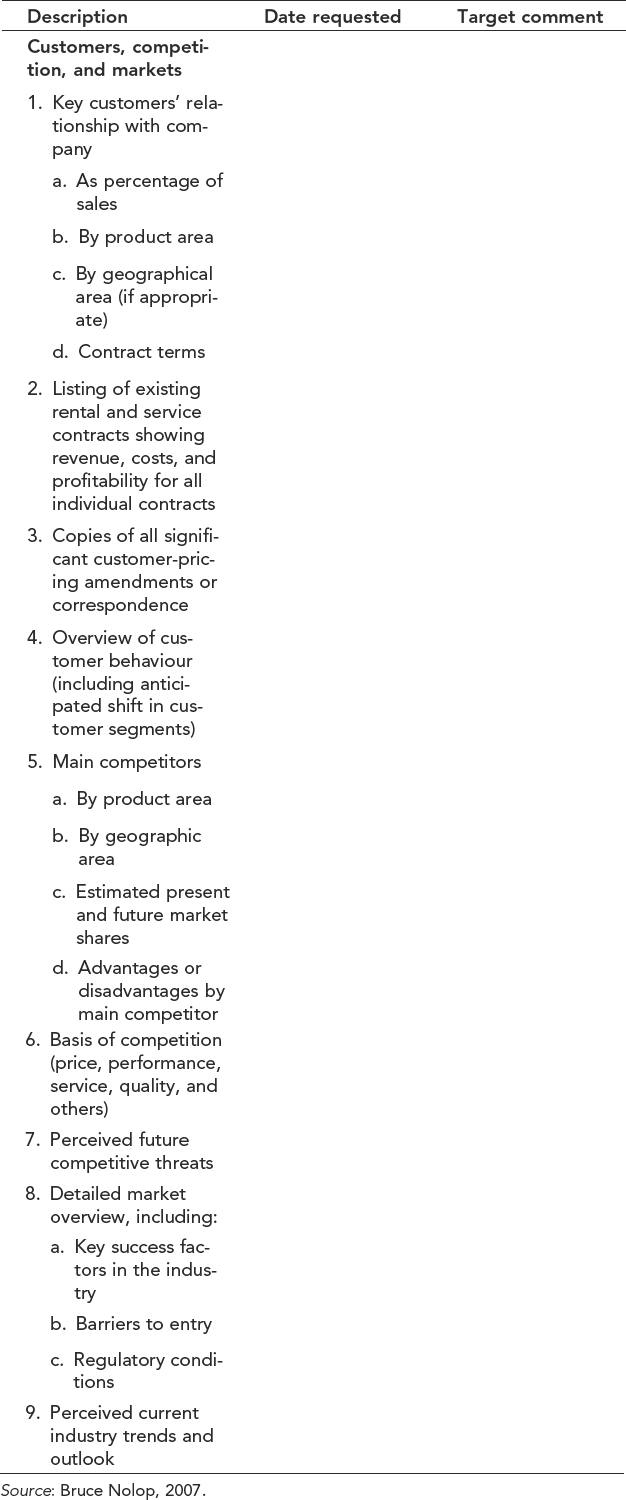
The following small excerpt suggests the level of detail pursued in one of the areas:
The main elements of due diligence check are as follows:
- verifying the accuracy of financial statements, sales forecast, and valuation
- exposing major risks early enough
- likelihood of getting the projected post-merger cash flows
- uncovering any hidden value
- major integration hurdles and solution
A properly constituted due diligence team with functional experts armed with a clear definition of the due diligence scope checklist and questionnaires is likely to uncover all needed information to arrive at correct valuation and effective post-deal integration actions.
6.3.4 Merger or Acquisition Performance Issues
Through merger or acquisition, both the target firm and acquiring firm expect superior value in terms of stock price, profits, turn over, customer satisfaction, and so on. However, as pointed out by Haleblian et al. (2009), the performance is mediated by the following four factors:
- deal characteristics
- managerial effects
- firm characteristics
- environmental factors, especially wave effects
Acquisitions in certain periods have produced particular results.
Bruce Nolop (2007) gives five rules of acquisition for better performance. They are as follows:
- Stick to adjacent spaces – logical extensions of a company’s current business mix, capitalizing on the firm’s tacit strength, and brand consistent in the eyes of customers. However, research has shown that broad diversification moves are successful sometimes.
- Rather than focusing on big game-changing deals, better to make many smaller acquisitions. A portfolio approach reduces risk with a cycle of buy, invest, and profit from small-size firms. However, mega deals get headlines hailing the conquering Hero and many think why not go after game-changing transaction when time and effort needed for a small and big acquisition are the same.
- Having a business sponsor for every acquisition ensures that right deals are made and then kept on track. Sponsorship by business leader leads to talent retention and smooth integration of IT system, HR policies, financial controls, management reporting, and reinforcing good practices.
- Be clear on how the acquisition should be judged in terms of growth potential, market leadership, management teams, and financial objectives. Same norms cannot be used for all acquisitions.
- Seek synergies in opportunities to combine facilities or staff, seeking complementary technology, intellectual property or potential to strengthen the presence in a new market that are different for different target firms.
- Do not purchase when your business is missing an element and there is urgency to fill the gap or an acquisition is thought of to remove an operational weakness. An acquisition should spring from the strategy for growth of the firm.
6.3.5 Symptoms of Malintegration in Merger or Acquisitions
Galpin and Herdon (2008) identify 10 of the most common symptoms when the expected synergies are not achieved in a merger or acquisition necessitating further integration or merger repair actions.
- Service levels are suffering. Front-line employees are still using the merger as an excuse for not having answers for customers.
- Customers are confused and defecting. They do not know which company they are buying from or how to get their questions answered.
- Performance targets have not been achieved. Key cost, revenue, product, and/or productivity targets built into the deal pro-forma are missed.
- Stock price is languishing. Analysts blame the merger or acquisition for poor company performance.
- Integration project milestones have slipped. Key integration activities are behind schedule.
- The organization cannot handle additional acquisitions. Another transaction is identified, but management and employees are visibly and vocally confused and stretched thin dealing with the issues created by the previous acquisition.
- Roles and responsibilities overlap. Management and employees are confused about who should be performing which tasks.
- Key executives and employees are leaving from both acquired and acquiring company;
- Company core values are not being demonstrated by management and employees from acquired company.
- Management and employees keep referring to ‘us and them’, when talking about people from the ‘other organization’.
6.3.6 Areas for Improving Synergistic Benefits in Merger or Acquisitions
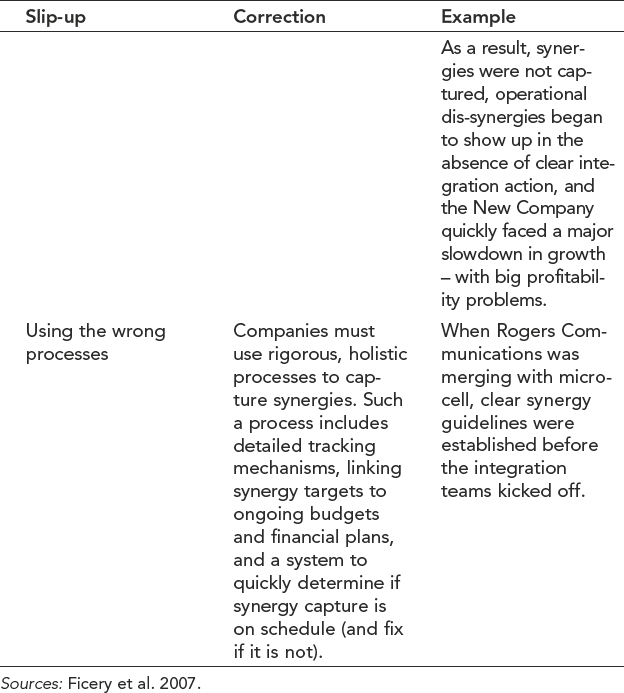
Synergies are the present value of the net additional cash flow that is generated by a combination of two firms that could not have been generated by either firm on its own. Acquiring firms use synergy expectations to justify deal rationales. Synergistic values expected in an acquisition are an opportunity for value and intangible benefits such as access to the markets, skills, technology, and images. Ficery et al. (2007) identify six most common mistakes that acquiring executives make and what can be done to improve the synergistic benefits that are given in Table 6.6.
Table 6.6 Areas for improving synergetic benefits in M&A
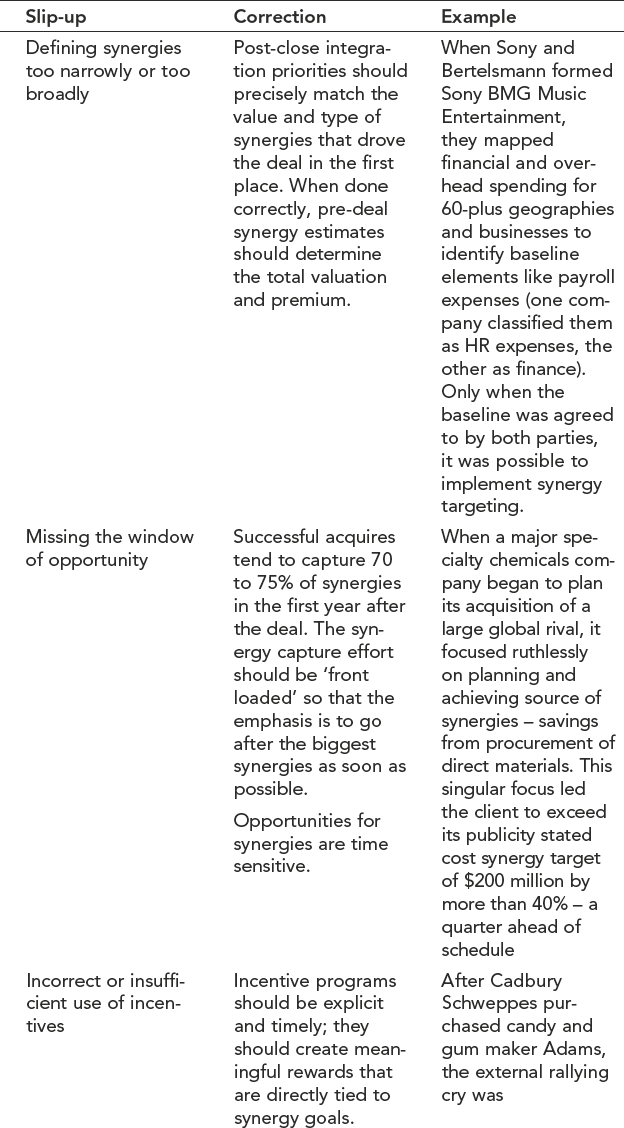
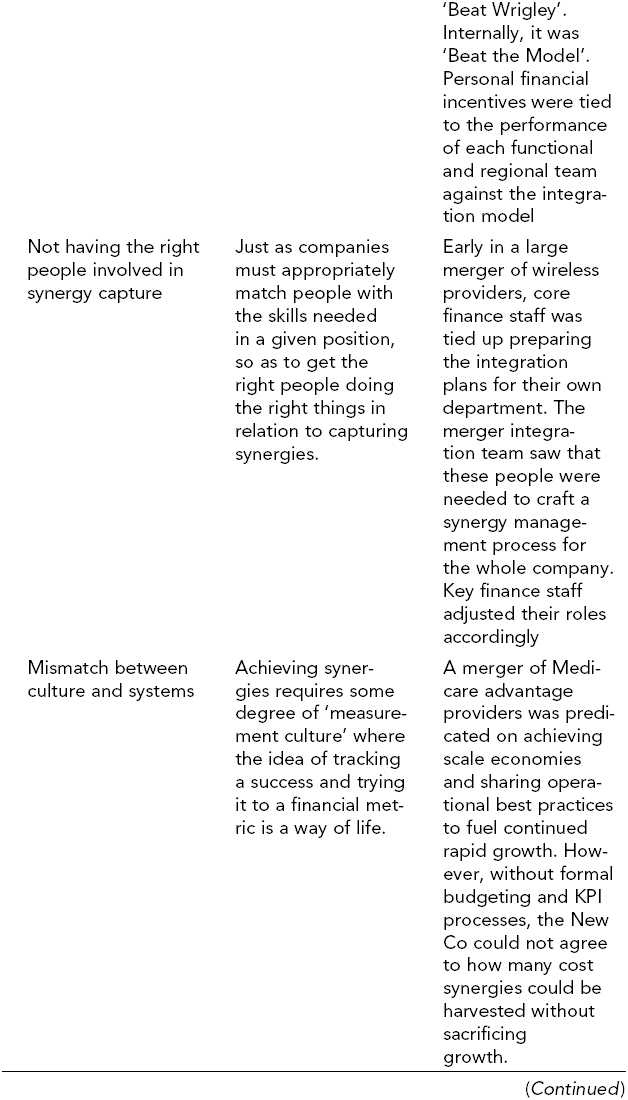
Table 6.6 (Continued)
Net synergy must take into consideration the cost to achieve the synergies and include any dis-synergies that the merger deal itself creates. Synergies do not magically materialize, but are only possibilities. The post-deal systems, processes, and people are expected to work towards realizing the value from the potential synergies.
Galpin and Herndon (2008) propose a deal flow model to integrate two firms, as given in Figure 6.11.
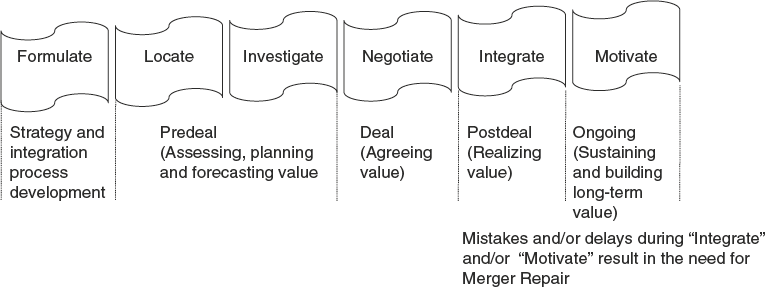
Figure 6.11 Merger or acquisition deal flow model (Source: Galpin and Herndon, 2008)
6.3.7 Characteristics of Target Firms for Acquisition or Merger
Even though there are no universal yardsticks to understand whether a firm is a target for acquisition, the following are some common characteristics of many of the target firms. The presence of any or a few of these characteristics are likely to attract attention of acquiring firms with a bid for friendly or hostile acquisition.
- liquidity problems or high debts or bankruptcy
- CEO change is contemplated or announced
- sharp fall in stock prices
- well entrenched and high growth in a particular emerging market
- possesses strength in one or two brands in a few markets
- possess unique technology
- have favoured access to unique raw materials
- low price-earnings ratio
- low dividend payout
- low growth in equity
- growth-resource imbalance
- inefficient management
- asset under valuation
- low leverage
- magnitude of tax carry forwards
- young companies with potential for future
- firms in disturbed industries
- companies in newly unregulated sectors
However, it is not true to state that poor performance or small size is the real reason for attracting an acquirer, but the acquirer observes some complementarity of assets or identifies some hidden value or under-utilized assets.
6.3.8 Theoretical Basis for Mergers and Acquisitions
A merger is popularly believed to be involving an acquirer with a high asset valuation, purchasing a target firm with low asset valuation (high buys low). Similarly, firms with poor corporate governance are purchased by firms with good corporate governance. Further, high quality managers are taking over poorly run firms. Property rights theory of the firm postulates that complementary assets are bound together under single ownership and mergers do this. Tobin’s Q-theory of investment states that assets of underperforming targets are redeployed towards more profitable uses under the better management of a high performing acquirer. Merger is one type of investment for an acquiring firm.
Rhodes-Kropt and Robinson (2008) assessed a sample of 3100 merger transactions till 2001 of publicly listed companies in USA and found that only 60% of the time, high buys low. However, 40% of the time, the market to book value of acquirer is below the target firm. They also found that mostly like buys like. Both the acquiring firm and target firm have high market to book ratios.
Firms search for a merger partner with potentially complimentary assets. Placing complementary assets under the control of single ownership in a merger reduces the hold-up problems and underinvestment that result from the incomplete contracting. Thus, firms search for other firms having complementary assets and when finds an acceptable partner bargain for merger. Gains from merger are related to how the firms complement one another. This theory of complements proposed by Rhodes Kropf and Robinson (2008) is just the opposite of Q-theory that suggests mergers are about substitution. The acquiring firm substitutes the target’s poor management or inappropriate use of assets.
The best targets and the best acquirers have the best outside opportunities and create the most synergies.
- Assimilation: by dissolving the identity of the acquired company fully.
- Confederation: it is the opposite of assimilation where the merged company preserves its historical identity and tying the organizations loosely.
- Federation: a new layer of identity is created on the existing identity. Here, old identity is not deleted.
- Metamorphosis: identity of the merged company is fused into a new identity and a common shared identity is created. Here, old identity is deleted.
6.4 STRATEGIC ALLIANCES
There are four types of perspectives that firms follow with respect to other firms in the same industry
- Competition for the same market.
- Cooperation to jointly manage some shared aspects of their environment.
- Cooperation to influence industry characteristics.
- No competition, but have a specialized niche market with a differentiated product (rare occurrence or short-term phenomenon).
With respect to the allocation decisions and extent of influence on environment for growth, competitive, and cooperative positions a firm takes can be illustrated in the analysis given in Table 6.7.
Table 6.7 Factors for competition-and cooperation-based strategies
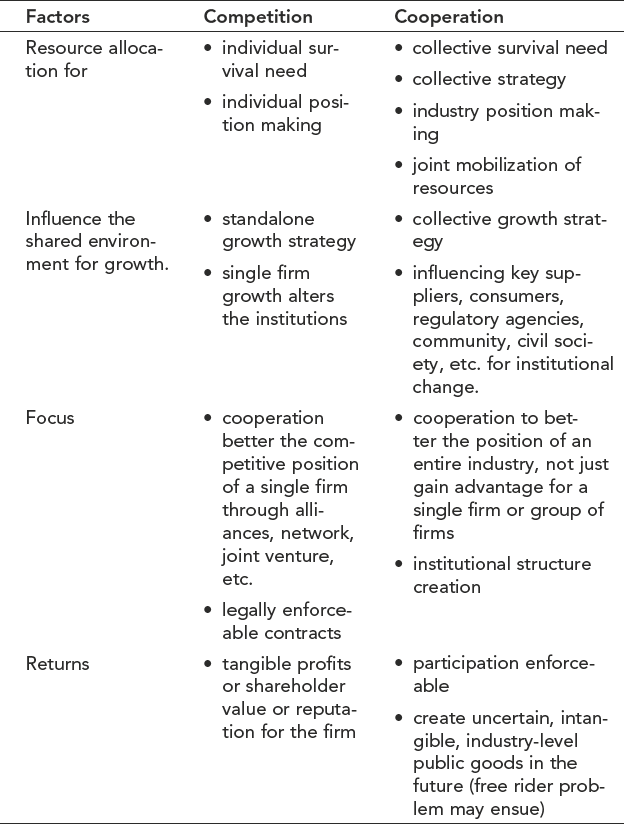
Ratio of resources of each firm allocated to competitive positioning versus allocated to industry positioning is an issue in strategy formulation. Self interest at firm-level aggregates into patterns of industry-level cooperation, and this cooperation in turn produces institutional or rules of the game changes that make the industry attractive for the firms within it.
Example of the cooperative structure of firms is a trade association that conduct the following functions for all firms:
- marketing campaigns
- promoting trade fairs
- collective lobbying
There are other structures also for collective action that are illegal in some countries or informal or formal in other countries:
- cartels
- collusion
- informal leadership
- interlocking directorates
- joint ventures
6.4.1 Communal Strategy
Communal strategy is a bridge between collective strategy and institutional strategy focusing on collective action to bring about institutional (rules of the game) change. Communal strategy contributes to public good from which all firms in the industry benefits.
Peer pressure and trust are the forces unifying the members of the industry. Member firms adhere voluntarily to an industry code of practice, participate in events, initiatives, and contribute membership dues, and other donations. Almost 20% of the firm performance is attributable to industry effect and collective strategy is to harness this 20% additional performance according to research.
6.4.2 Corporate Strategic Alliances
Strategic alliances are contractual business agreements to pool resources and engage in a new business venture with or without an equity investment. Such a business venture has a finite length with partners performing specific tasks and partner contributions be in the area of technology, product development, marketing, licensing, research, or skills. There are two generic types of alliances.
- Vertical alliances vs horizontal strategic alliances (horizontal alliances are more favoured)
- International vs domestic strategic alliances (international is more successful and are across national boundaries)
Growth in alliance activity is due to technology, globalization, and increasing complexity and diversity of markets. Firm with excess cash may also pursue strategic alliances as a method for investing that cash.
Marketing agreements, licensing agreements, research and development agreements, technology transfer agreements, and manufacturing agreements have high frequency than other types of alliances.
A firm can be said to be made from a business plan backed up by different contracts and managing the interfaces with the partners in contract. Hughes and Weiss (2007) identify five principles, to focus, for success of strategic alliances. The following are the principles as what is to be emphasized in alliance management.
- Focus less on defining the business plan and more on how you will work together.
- Develop metrics pegged not only to alliance goals but also to alliance progress.
- Instead of trying to eliminate differences, leverage them to create value.
- Go beyond formal governance structures to encourage collaborative behaviour.
- Spend as much time on managing internal stakeholders as on managing the relationship with your partner.
- marketing agreements
- licensing agreements
- manufacturing agreements
- research and development agreements;
- royalty agreements
- supply agreements
- technology transfer agreements
- cross-transfer
- equity transfer agreement.
Hughes and Weiss illustrate the difficulty in sustaining the alliance because of differences in two firms’ business models, cultures, and expertise with HP–Microsoft alliances, as given in Figure 6.12.
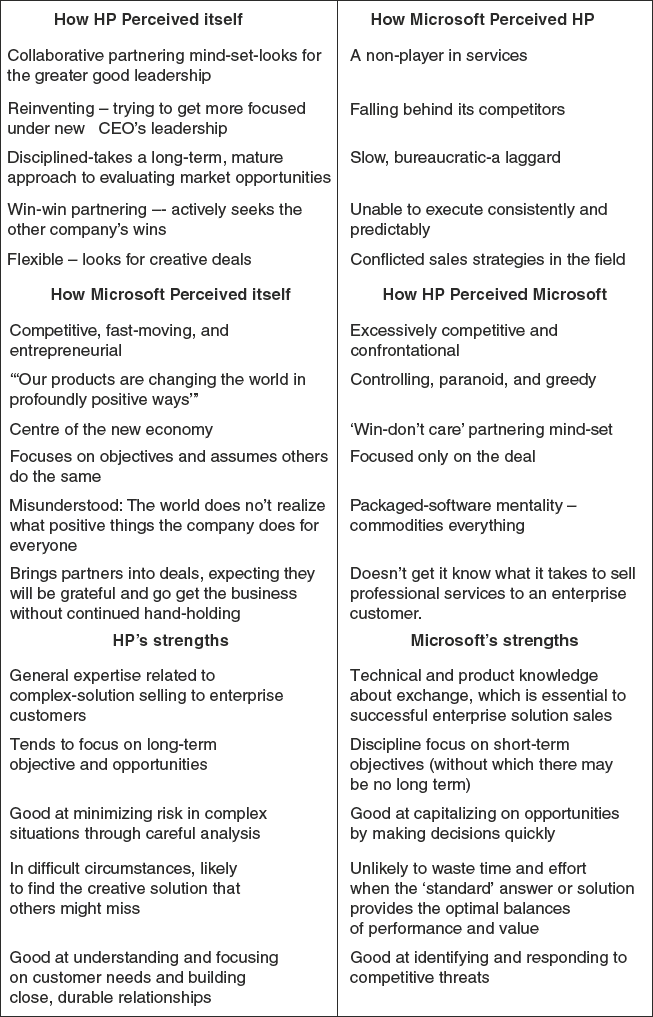
Figure 6.12 Differences between HP and Microsoft (Source: Hughes and Weiss, 2007)
Through the joint exploration of differences, a more constructive and valuable view emerged:
Even though alliances are difficult to succeed, more and more alliances are formed due to advances in technology, globalization, shareholder pressures, and the increasing complexity and diversity of markets. Strategic alliances may be an intermediary phase that may be replaced by merger eventually. The sequences are likely to be as follows.
Alliances through --- equity transfer → strategic alliances → Merger
6.4.3 Alliance Capacity
Strategic alliances are nexus of contracts that surround a firm and are an important source of value. A firm can have unlimited choices to form alliances. Alliance capacity is the maximum number of alliances a firm could have formed. A firm can form any number of alliances, but the number of previous alliances can affect the probability of forming an additional alliance. The potential alliances change over time. Many firms interact in markets where the choice of one firm’s alliance partner precludes that partner from collaborating with a third firm. The risk of stealing trade secrets or proprietary knowledge might preclude some alliances from taking place, especially among firms in the same industry.
6.4.4 Alliance Network Strategy
The position of a particular firm in an alliance network affects firm’s performance. Firms pursue a network strategy that enables them to attain a position of prominence in the network (Kokar and Prescott, 2008). The advantages of forming alliances in a network are as follows:
- access to critical and key information (information volume)
- information diversity
- act as conduit for resources
- affiliation-based benefits provide opportunities for the prominent firm in the network to establish its strategic agenda as the defining norm of the industry or network
- facilitate joint and coordinated action by the partners, thereby giving performance benefits
- legitimacy and reputation benefits through alliance with significant partners
6.4.5 Design of a Firm’s Alliance Portfolio
Firms adopt alliance network strategies to gain competitive advantages. There are two ways the firms design the network strategy:
- attain a position of prominence or being in control in the network
- occupy an entrepreneurial position in the network by acting as bridges between different parts of network, recombining information, and knowledge in novel combinations, and thus getting first-mover advantages.
Direct ties or indirect ties with alliance partners is another dimension in the network. Multiple accesses to valuable and diverse information and other resources prompt firms to enter into multiple direct ties with many partners. Alliances portfolio is determined by the strategy of the firm. If a firm’s strategy execution needs critical and key information, then the firm should form into alliance in a network for flow of information. Lee (2008) found that audit firms with strategic alliances with other firms performed better.
6.5 JOINT VENTURE’S STRATEGIES
Joint venture is one form of collaboration strategy pursued by firms. A seller often possesses private information on its resources and faces difficulties in credibly conveying its resource’s value (Ravenscraft and Scherer, 1987). A buyer also finds it difficult to evaluate the resources of a target firm for acquisition or merger to ensure that it captures value from a deal (Paranam et al. 2006; Caprin and Shen, 2007). Joint ventures are useful under such situations, as it pools together resources on a piecemeal, experimental basis, and offer the possibility of sequential investment. Theories in information economics (Stiglitz, 2002), organizational economics, transaction cost economics, and agency theory are useful in understanding why firms engage in joint ventures and partnerships.
6.5.1 Advantages of Joint Ventures
Joint ownership allows firms to share overpayment risk rather than making lump sum payments. The threat of termination and shared control can facilitate resource sharing (Higgins and Rodriguez, 2006). There are different types of joint ventures and partnerships:
- equity joint ventures that share ownership and control but reduce overpayment risk, offering first-hand access to the firm’s resources.
- minority equity partnerships with less access to the firm’s resources and less control through the board.
- non-equity partnerships: there is no sharing of ownership, but access to resources is contracted. Least risk of adverse selection and no risk of overpayment. A contractual agreement joins together two or more parties for the purpose of executing a particular business undertaking or to achieve an agreed goal.
Joint ventures cease to exist when the goals of partnership are achieved. The advantages of joint ventures are as follows:
- entry into a new geographical market through joint venture
- access to technology or expertise
- gain new capacities
- risk sharing
- do not expose a firm fully to the partner
- offer opportunities to exit from non-core businesses
- a business can be separated or isolated from the main organization through a joint venture.
6.5.2 Collaborative Partnerships
Partnerships and joint ventures are similar in the sense that both are strategic alliances, but can have different business implications. A partnership usually involves a long-term continuing business relationship. Legally in India, a single business can be started and operated by two or more people or entities in partnership under the Partnership Act and then the business is called a partnership business. In US, small business administration also recognizes businesses operated based on a partnership agreement. There are three types of partnerships including joint ventures as a type of partnership.
- General partnerships where the agreement provides for the percentage or proportional distribution of profits, management control, and liability.
- Limited partnerships: these are agreements or alliances where partners have limited liability and decision making roles are different.
- Joint ventures: partnerships for limited period of time.
Limited partnerships are formed by some firms in the value chain such as partnership between a manufacturing firm and a retail chain. There are also partnerships with supplier groups such as a partnership between a firm and a media house or advertising agency on a long-term basis.
In partnerships, every obligation, sharing of expenses, capital, profits, liabilities, and even an exit strategy are documented in detail for preventing conflicts later on.
6.6 INTERNATIONAL BUSINESS ENTRY LEVEL STRATEGIES
Firms pursue a global business strategy for performance promotion. The international entry modes and establishment modes of firms may be different but seeks to have strategy fit, internal fit, external fit, and an overall fit. An overall fit between firm’s organizational capabilities, environmental contingencies, and international strategies promotes performance. While adopting a global strategy in order to gain certain competitive advantages, one of the sources of this advantage is the difference between countries that is exploited as a source of value creation arbitrage. The following are various forms of arbitrage, leveraging the differences for value or advantages.
- knowledge arbitrage – differences in available knowledge
- labour arbitrage – differences in cost of labour and type of labour skills
- tax arbitrage – low tax regime in certain countries
- capital arbitrage – low cost machinery, low-cost financial capital
- administrative arbitrage – different environmental laws or regional trade agreements
- cultural arbitrage – country of origin effects, liability of origin effects
- geographic arbitrage – costs of transportation differences
- specialized input arbitrage – differences in availability of raw material, their cost, and quality of raw materials
Scanning the world for arbitrage advantages that would fit into a firms’ business process is one main reason for crafting a global strategy. There are two types of multinational companies taking advantage of the differences among nations namely:
- Horizontal MNCs: they perform same activities in different counties deriving each country’s advantages for an overall fit.
- Vertical MNCs: their arbitrage differences across counties by geographically separating activities.
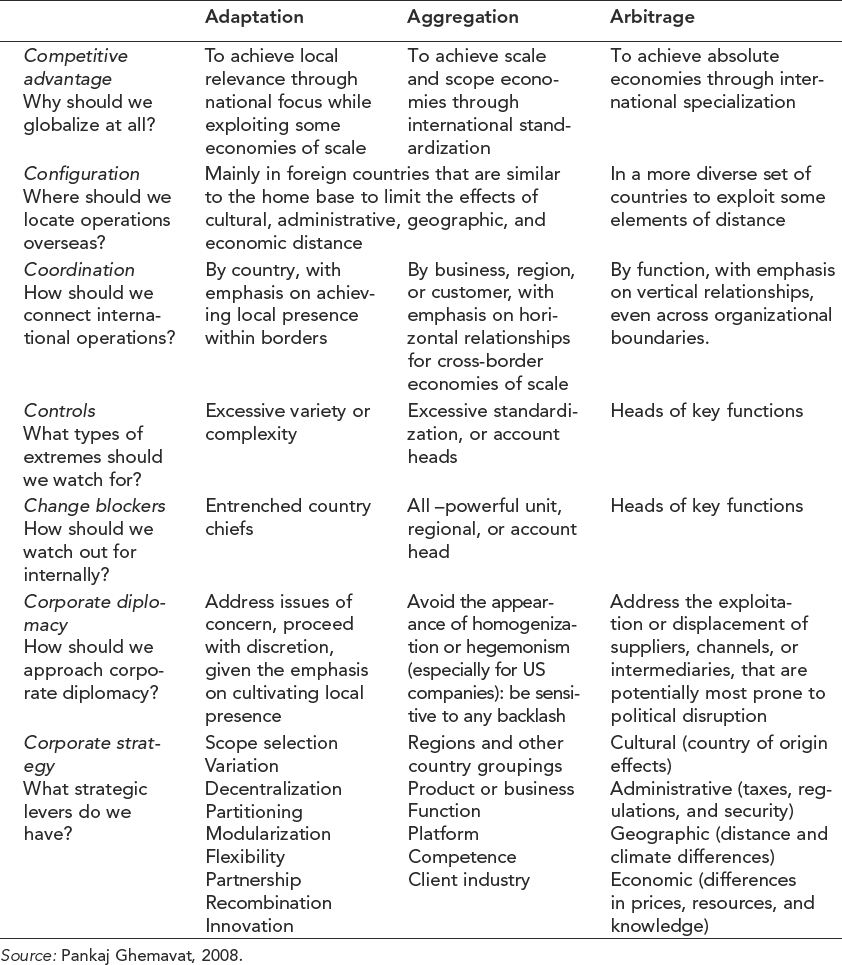
Pankaj Ghemavat (2008) puts forth a three-dimensional logic for international strategy, as shown in Figure 6.13, called ‘The AAA strategy Triangle’.
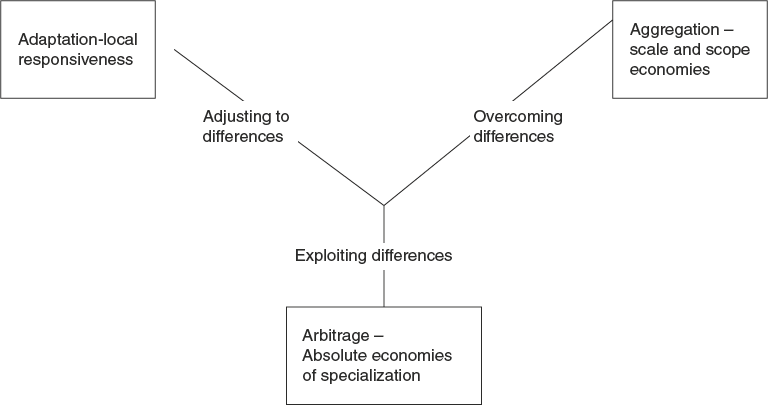
Figure 6.13 Three-dimensional logic for an international strategy (Source: Pankaj Ghemavat, 2008)
The strategic choice a firm makes depends on the focus on any one of these three dimensions or their combinations. While a country is selected for exploiting the low-cost labour, a firm may have to overcome difference in environmental law. A trade- off in the two dimensions of arbitrage and aggregation results as a strategic choice in order to gain advantages of scale or scope economies or economies of specialization depending upon the emphasis applied. Pankaj Ghemavat (2008) gives a comparison of adaptation, aggregation, and arbitrage focus as strategic choices in an international strategy in Table 6.8, demonstrating the competitive advantages of each dimension.
Table 6.8 Comparison of adaptation, aggregation, and arbitrage dimensions
How international firms choose a particular strategy dimension or a combination in order to create value depends on the combination of the drivers that promote performance.There are different international entry modes (wholly foreign-owned establishment or subsidiaries with shared ownership) and international establishment modes (choice of green field or acquisition through foreign direct investment and strategic choices of focus (adaptation, aggregation, and arbitrage)). In trying to build competitive advantage on a sustainable basis by entering a foreign country, a firm has to make decisions on all the abovementioned three areas, after intensive study to achieve overall fit and thereby superior performance.
6.7 STRATEGIC SALE OR DIVESTING SBU
There are various meaning to strategic sale and the most dominant is the sale of a governmental enterprise by auctioning as part of the privatization process. Selling minority shares in state-owned enterprises was in vogue to bring in equity or efficiency in public enterprises. Strategic sale route is followed as a major disinvestment method by fully or partially transferring the ownership so that controlling stake is with the purchaser.
Building companies with high exit values and then selling these small ventures at high valuation is also called strategic sale. Such sales are sometimes at values 100 times their EBIT. Selling a small business that enables a large firm that purchases it to exploit a national or global opportunity or technological breakthrough at many multiples of its current revenue is another strategic sale. Such a purchaser is to be identified and the potential and strategic importance has to be communicated effectively for the sale to happen.
Strategic sale of businesses by large firms is done as part of its reconstructing process or turnaround strategy. By sale of a less performing firm that may use up more of the firm resources and time may help the firm more than proportionately in turnaround. Similarly, by strategic sale of a unit that is not in the redesigned strategy road map would help in achieving coherence in the overall strategy of the firm. Such sales provide strategic or long-term benefits and competitive advantages to the seller. The buyer also gains often, but usually the seller gets sustained cost reduction in his/her firm by strategic sale of one or more units or get strategic alignment of all the units of production by exiting from a misaligned one.
6.8 POLITICAL STRATEGIES FOR COMPETITIVE ADVANTAGE
‘to do nothing is not a viable option’
—Richard Pascale
Government’s influence on business and firm’s influence on governments are increasing. Various political tactics such as lobbying, advocacy advertising, constituency building, financial contributions, coalition formation, and supporting nationalist causes are undertaken by firms to influence the political environment. Traditionally, firms viewed government as a necessary evil or an institutional constraint on a firm rather than a set of opportunities. Strategic political management means a set of strategic actions that firms plan and enact for the purpose of maximizing economic returns from the political environment. Public policy, the economics of political and collective action, stakeholder management, and corporate political behaviour are theoretical perspectives explaining how and why firms choose to manage their political environment. Usually, firms engage in political strategies to create or maintain their value. Oliver and Holzinger (2008) propose a typology of political strategies, as given in Table 6.9.
Table 6.9 Distinctions between four types of political strategies
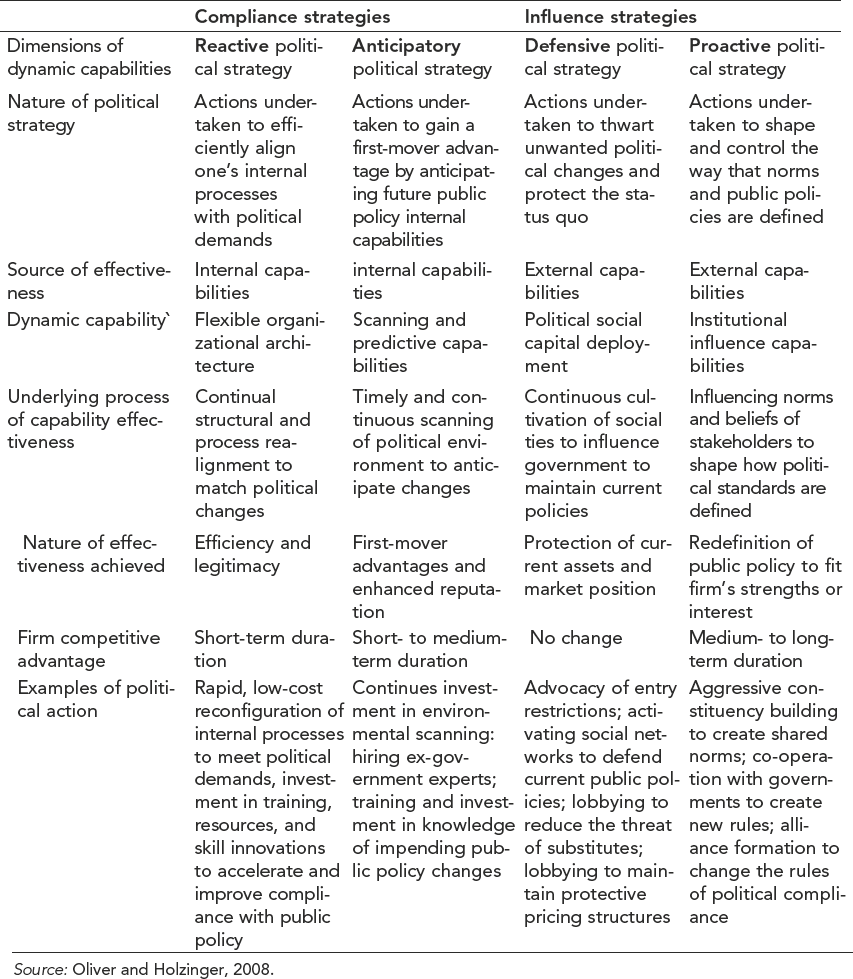
Proactive political strategies are likely to be the most promising of the four strategies since it shapes public policy to fit a firm’s own unique advantages and interests. Figure 6.14 depicts the sustainable competitive advantage through political strategies, as proposed by Oliver and Holzinger (2008).
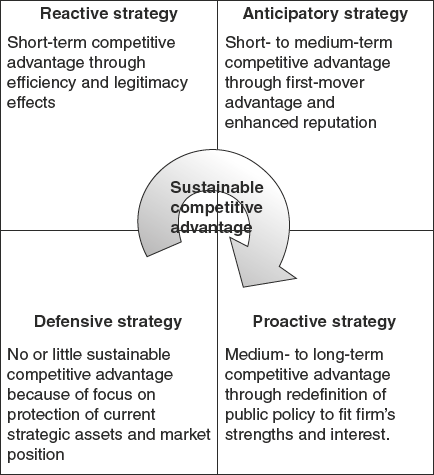
Figure 6.14 Sustainable competitive advantage through political strategies (Source: Oliver and Holzinger, 2008)
Firms engage with policy makers at local level, regional level, federal level and global level to design and execute political strategies that exploit the capabilities most likely to generate firm advantages that are costly for competitors to imitate or avoid. Institutional influence processes, social capital deployment, scanning, and anticipatory knowledge acquisition along with firm -specific capability identification and its enhancement are the key drivers of effective political strategy execution by firms in a changing political environment.
6.9 REVERSE LOGISTICS AS SUSTAINABLE COMPETITIVE ADVANTAGE
Product returns from retailers and customers to the manufacturers are becoming a fact of life and overall customer returns are estimated to be at 6% of sales and may be as high as 15% for mass merchandisers. The traditional value chain starts from the inbound logistics and ends with service, which is a one-directional flow of primary activities. However, innovative companies begin to extend their distribution channels beyond the end customers to include the acceptance and disassembly of final products for reuse and reanalysis. Finally, transforming the returned products into new tangible and intangible values. Reverse logistics is defined as follows.
The process of planning, implementing and controlling the efficient flow of materials, finished goods, inventory and related information from the point of consumption to the point of origin for the purpose of recapturing value or proper disposal
—(Rogers and Tibben–Lembke, 2001)
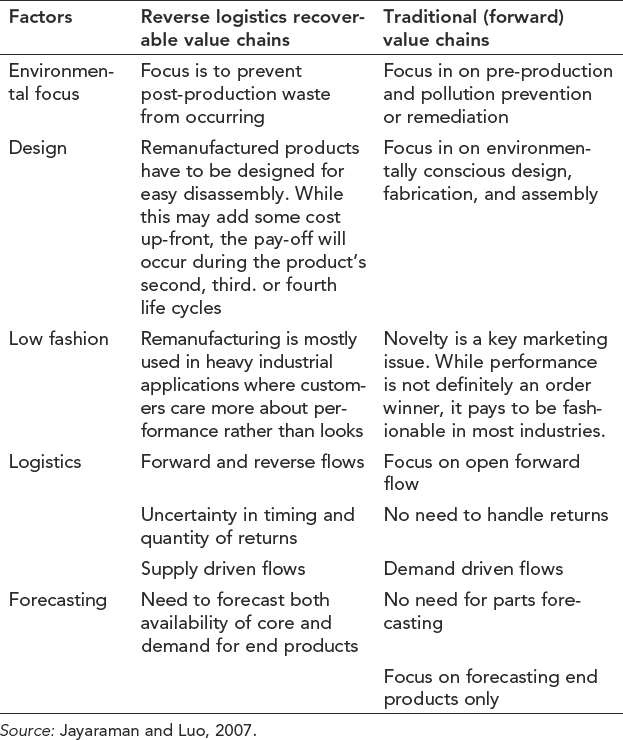
Good reverse logistics program can be a differentiator and provides a means of gaining market advantage. It can reduce material requirements and enhance an environmental image. Better corporate image and increased customer satisfaction levels also are potential benefits. These factors are likely to increase the profitability of such a firm adopting reverse logistics program as an integrated closed-loop value chain of primary activities. The key differences between reverse logistics and forward value chain, as given by Jayaraman and Luo (2007), is given in Table 6.10.
Table 6.10 Key difference between reverse logistics and forward value chains
6.9.1 Reverse Logistics Drivers
There are financial, social, and environmental drivers of reverse logistics offering advantages to a firm. Recovery is cheaper than building or buying new materials. Recoverable and return processing manufacturing systems are not only environmentally friendly and profitable but also improves customer loyalty. Proper disposal of returned products can create customer loyalty. Products recovery offers competitive advantage to a firm when customers perceive that it can return an item if it does not function properly or its use period is over, thus enhancing the image of the firm resulting in customer loyalty. Additional advantage to the firm is by way of precluding other companies to access the technology and a firm’s market by building customer loyalty through an efficient recovery or reverse logistics process. Many products and parts such as disposable cameras, photocopy machines, computers, and cars can be reclaimed and every product or component that can be reinserted into the forward supply chain for sale is one less unit that must be procured a fresh, thus reducing the costs of fresh procurement, environmental compliance, or waste disposal.
Recover, reduce, recycle, and reuse are increasingly becoming the norm of environmental regulations in most of the countries, extending the manufacture’s responsibility to the products after use. Taking back the used products, recycle, and recover value from used products are important elements for building up the green profile of a firm that gives reputation value to the firm. Reverse logistics capabilities also portray good corporate citizenship and the goodwill returns can improve corporate image, boosting its market share.
6.9.2 Developing Reverse Logistics as Strategic Capability
Handling reverse logistics process is a strategic capability starting from customer return collection to feed different parts of the primary activities of the value chain. This is like end customers and after-use, end-product collectors acting as suppliers to the firm with in-bound transportation costs, and storage of used products involved. Remanufacturing, reassembling, reconditioning, disassembling, and reusing of the components from the used product are capabilities that are being developed by firms. After disassembling, the usable components from the returned products are mixed with new raw materials in a remanufacturing process. Through remanufacturing, feeding most parts of the collected used products to the outbound logistics is a strategic capability for a firm, to be developed as an integral part of the business model, to derive the sustainable competitive advantages. The information flow as feedback from the customers in the form of returned products is to be captured right and processed in the most objective manner for strategic decision making, to derive maximum advantages from the reverse logistics program.
6.10 OUTSOURCING STRATEGIES: MAKE VS BUY
While most people understand first order effects few deal well with second and third order effects. Unfortunately virtually everything interesting in business lies in fourth order effects and beyond
—Jay Forrester.
Many of the business capabilities are portable and commoditization is eliminating most of proprietary advantages. Outsourcing is the name of the transaction when all the activities of a firm are placed on a table for identifying the outside partners or suppliers having expertise and scale capability to produce each activity at low cost and acceptable quality. The firm will not have direct ownership of the production process but retain some degree of control in deciding the quality and delivery schedule. Thus, outsourcing is a decision by the firm not to make a product or service internally but to purchase it externally.
Sourcing inputs has evolved into a strategic process for firms. Sourcing was originally limited to procurement of materials and resources. Now, even core functions such as engineering, R&D, manufacturing, and marketing can be moved outside the boundary of the firm, retaining only the control, but not ownership. How to source every single activity in the value chain in the most competitive manner has emerged as capability sourcing. Gottfredson et al. (2005) proposed a model to decide what activities are to be outsourced and what are to be performed in-house, as given Figure 6.15.
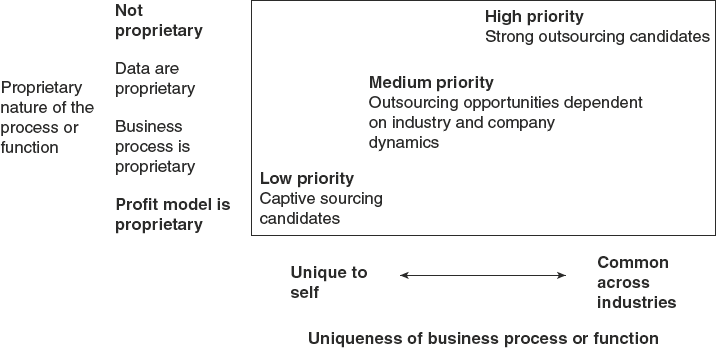
Figure 6.15 Sourcing opportunity map (Source: Gottfredson et al. 2005)
The vertical axis measures how proprietary a capability is for your company. The horizontal axis plots how common the capability is within or outside the industry. The less proprietary and more common a function is, the stronger the candidate for outsourcing.
6.10.1 Benefits of Outsourcing
After determining which capabilities or functions that offer the highest potential value from outsourcing, it is necessary to assess how efficiently each function is performed.
If the cost per transaction is above industry median and company’s ability to perform a function is not good enough, such a function is to be outsourced for better results. In an outsourcing decision, it is normal to explore whether such an activity can be carried out at a distance without any loss of quality and without affecting the process. If an activity, if imitated by rivals, could damage the firm, then such an activity is not a candidate for outsourcing. The benefits of outsourcing are as follows:
- Enables the firm to focus on activities on which it has superior competence and outsource the rest.
- Outsource function from other firms that are most efficient in that function, thereby reducing cost.
- Firms get opportunities to differentiate based on their core competencies.
- Opportunity to create new businesses, adjacent to core business.
- Risk reduction from changing technologies
- Start new projects faster
6.10.2 Various Activities for Outsourcing and Types of Outsourcing
Any activity can be outsourced, provided there are competent firms outside who can perform the required function exactly the way we want and when we want it, at a cost lower than in-house performance. Even the activities that are required to be protected from imitation can be outsourced by drafting the contract in confidentiality clauses that are enforceable. The activities that are outsourced in general are IT enabled services, valuation and legal due diligence, resolution of stressed assets, legal actions, security-related services, market research, cleaning and housekeeping services, and audit. The availability of competent firms to do activities on which we are weak is the basic premise of outsourcing. Different types of outsourcing are as follows:
- a domestic firm outsources functions from dedicated ancillary firms
- a domestic firm outsources through open sourcing on competitive terms
- a domestic firm supplies the plant and machinery in a foreign country, supplies inputs and hires the plant to process the inputs into furnished goods, all the while retaining ownership of inputs
- a domestic firm supplies plant and machinery and inputs, hires the foreign firm to process, and then sell the products in that country
- a domestic firm buys the entire finished products from a foreign firm that collects its inputs on its own
- a domestic firm buys the required finished products from a foreign firm on competitive basis
6.10.3 Outsourcing as Divestiture
A firm has already invested in physical assets and human resources for certain functions and then considering outsourcing those functions is in the nature of divestiture. The ownership of such assets and resources may be transferred to another firm and then buy the products or functions through an outsourcing contract. The specification and price may be renegotiated overtime.
6.10.4 Selection of Outsourcing Firm
The decision of whom to outsource to is strategic since the supplying firm has the potential to become a competitor, and thus may reduce the competitive advantages:
- Some firms have outsourced by spinning off separate independent firms that supply them with outsourced functions.
- Tap into the competencies of established firms and outsource from them. In this case, the outsourced firm is likely to appropriate value more.
- Free access from the market without any long-term commitment from independent firms that can supply as per specifications.
- Produce partly in-house and some quantity is outsourced from the market to have high bargaining power on price.
- Operate autonomous or semiautonomous divisions by conglomerates.
- Outsourcing to a common retailer and then competing suppliers do not have much freedom for price competition between them.
6.10.5 BPO, LPO, KPO
Business process outsourcing (BPO) is a subset of outsourcing where a third-party service provider carries out the operations and responsibilities of a business process for the client on contract. There are mainly two types: back-office outsourcing contracting out HR, finance or accounting functions and front-office outsourcing contracting customer-related services like contact centres. Philippines and India are the leading BPO business centres in the world. Knowledge processing outsourcing (KPO) and legal process outsourcing (LPO) are sub-segments of BPO. The concept of LPO is based on the division of labour principle, where various processes such as due diligence, patent law, bankruptcy filing, contract law, company law, and tax law are contracted out to experts in required contexts.
6.10.6 Shapley Value
The supply terms between an upstream and downstream functions of the firm are bargained face-to-face, especially on the price and quality, forming the supply agreements. The natural bargaining solution is the shapely value. De Fontanay and Gans (2005) demonstrate that outcomes of such bargaining are value maximizing and each firm appropriates its shapely value as would arise in the underlying coalitional game. The downstream resources may be retail outlets or distribution channels and upstream resources may be production facilities.
6.11 FRANCHISING STRATEGIES
A young expanding firm has many options to get capital for expansion. They are as follows:
- sell equity
- sell debt if the firm has collateral and a proven track record or a good business model
- sell franchises
- profits or savings, if any generated in the past
- selling nonperforming assets, if any
Franchising is a method of business growth where the firm sells its brand name in return for a franchising fee and adopting standardized systems and procedures that will not dilute the brand image. The franchisee is an investor who sets up the shop with his/her own capital in the brand name of the franchiser and runs the business. There are basically two forms of franchising with a third hybrid form as it evolved now.
- Product distribution franchising
- Business format franchising: an ongoing business relationship that covers the product, service, trademark, and the entire business concept with a continuous process of assistance, guidance, and supervision. This is an incubator of small businesses.
- Hybrid concepts that are minimum guarantee models.
The franchisee with necessary knowledge about local trading conditions and empowered by a brand name is likely to operate with greater drive and motivation than an employee of the firm (franchiser) operating the business unit. A firm takes a strategic decision whether to convert some of its existing dealer or distributor into a franchise channel for improvising sales.
6.12 PORTFOLIO ANALYSIS
The portfolio of products, projects, or entrance into new ventures or businesses is assessed primarily on the estimated value creation potential. Thus, the profitability or value creation from the new venture should exceed the cost of capital. The cost of capital is calculated as the sum of risk-free rate of return and risk premium (high level of return by assuming risks of investment options). The sources of value creation while considering diversification, alliance, acquisition, or partnership opportunities are as follows:
- economies of scale opportunities
- product differentiation
- cost advantage due to learning curve
- proprietary technology or innovation
- monopoly control of low-cost raw materials
- access to distribution channels
- entry in regulated markets with new technology
- government protection to a business
- redefining a market
- new customer or societal need creation or identification
The attractiveness or value creation potential of new activities or ventures for diversification, acquisition, alliance, or partnerships are assessed through the number of methods that are briefly described in the following sections.
6.12.1 Cash Flows and Selection of Proper Discount Rates
Discounted cash flow method or net present value (NPV) are used to assess the value creation potential of ventures. This is the expected future cash flows generated, discounted at a particular rate, and adjusted to inflation and risk. A discount rate of 12% up to 15% is used. The discount rate is assumed depending upon the prevailing bank interest rates, risk-free rates, industry average rate of returns, and other macro-economic indices.
6.12.2 Cost-benefit Analysis
The anticipated total benefits divided by anticipated total costs gives a ratio. If this is positive, then the venture is viable. Nowadays, environmental and social costs are also added to the costs in the sustainable development paradigm.
6.12.3 Economic Profitability
The profitability level should exceed the cost of capital for considering an investment opportunity or option. When the return on equity (RoE) exceeds the costs of equity capital, then economic profitability results.
RoE = profit after interests and taxes divided by equity
Accounting profit ability results when ROE is positive
Return on assets (RoA) = profit after taxes but before interest divided by assets.
6.12.4 Market to Book Value Ratio (M/B)
This method is based on the presumption that market value of the firm’s shares is a good indicator in measuring financial and economic performance.
Market value of a firm’s shares corresponds to an assessment of future payments generated from existing assets of the firm and from the future investment the firm has opportunity to make (diversification opportunity). The book value of the firm’s shares corresponds to the historical measurements of resources contributed by shareholders, correcting for inflation and charges of certain investments such as advertising and R&D in one period.
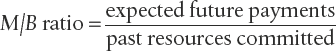
6.12.5 Size of Spread
Spread is defined as the difference of RoE and cost of equity capital expressed as number of percentage points that RoE enjoys above the cost of equity capital. Greater the spread, the greater the economic profitability. Cost of equity capital is estimated by capital asset pricing model, using risk-free rate of return and risk premium. Volatility coefficient (beta coefficient) and average risk premium estimate for the capital markets are used to arrive at risk premium. Number of years during which a firm or venture will enjoy a favourable spread in the competitive business environment is also to be considered before venturing into new investments.
6.12.6 Profitability Matrix
Profitability matrix is an explanatory grid for financial positioning of business units. The ROE of business units in different markets can be compared as a relation between growth of business and the market growth. This matrix is obtained by plotting the business RoE against its corresponding market growth that determines cash generating business and cash users (Marakon, 1981). Modified profitability matrices by changing the two horizontal and vertical cut-off points are also in use.
6.12.7 Portfolio Matrices
These are developed by consulting firms during the 1970s and 1980s displaying the competitive standing of the portfolio of businesses of a firm. It is also possible to do a future projection of the standing of businesses. The matrix positions the business units of the firm in two dimensions, namely overall attractiveness of the industry and strength of the business within its industry. The following are some of the popular portfolio matrices:
- Boston consulting group (BCG) matrix that is also called growth share matrix.
- Life-cycle matrix (Arthur D. Little) plotting industry maturity in four stages against competitive business position in six categories from dominant to non-viable, generating 24 scenarios.
- Industry attractiveness business strength matrix (General Electric and McKinsey & Company). Using industry attractiveness against business strength from critical success factors of a business where each dimension is sub-divided to high-, medium-, and low-making nine possible scenarios.
- Alternate BCG matrix using size of competitive advantage as small or large and ways to compete (opportunities for differentiation) as many or few making four alternate positions for businesses, namely volume, specialization, fragmented, and stalemate.
Portfolio matrices establish priorities for investment depending on the business potential for growth and profitability as understood from its position in the matrix. Portfolio matrices are useful tools for resource allocation among existing businesses and for decisions of divestiture or diversification.
6.12.8 Resource Availability
Availability of strategic funds that is the total source of funds after deduction of dividend payments and debt repayments determines resource availability. If funds are not readily available, a proper debt policy is needed for funding diversification and selection of a portfolio is dependent on fund availability.
6.12.9 Gap Analysis
It is an analysis applied to product or market situation considering the targets for different types of products the firm wants to make and different types of market segments where the firm wants to sell its products. There will be quantitative targets for both the products and market segments. The gaps in terms of products that the firm is not introducing, the market segments it is failing to enter, and how far out the position be are assessed. This gap analysis opens imagination to close the gap through new product or market development strategies, diversification of products, or market and/or a marketing mix strategy.
SUMMARY
- Strategy formulation at headquarter level of a firm or organization and at unit level has different orientations, priorities, and skill requirements. At headquarter level, the firm looks at the industry ecosystem, where both cooperation and competition with other firms simultaneously are a requirement for survival. A firm is dependent on many other firms either for supply of its inputs or to reach the output to its end customers, and nowadays, to collect the used products in the reverse logistics chain. Such dependencies are converted by some firms as sources of competitive advantages by strategic decisions to form different types of alliances and partnerships.
- At the headquarter level, the most important strategic decisions concern which business the firm should pursue, in which business more investments should be made, and which business should be exited. Thus, the decisions of diversification, mergers, acquisitions, and strategic sale are taken as part of corporate strategy. Outsourcing is another form of alliance wherein the firm gets a function or activity performed by another firm that has more competence. Joint ventures and partnerships are also modes of alliances that sometimes start as outsourcing decisions. International business strategies and four types of political strategies are also briefly discussed. Corporate analysis tools such as BCG matrix, GE matrix, and portfolio analysis tools are employed to assess the potential and values of each product, business, and market in which a firm wants to be or do not want to be.
QUESTIONS FOR DISCUSSION
- What are the characteristics of the firms as soft targets for acquisition by other firms?
- What would be the customers switching costs of the customers of a target bank in case of a bank acquisition or merger?
- Identify the political strategies adopted by business firms in your country.
- What are the impediments for a firm in the country to pursue an international growth strategy?
- What are the aspects to be looked into in nurturing a business partnership without conflicts of interest between partners, to get synergistic benefits in the form of superior performance?
- What are the risks in unrelated diversification? What are the methods available to assess the risks and to mitigate the risks?
EXERCISES FOR UNDERSTANDING
- Make a list of industries that became extinct during the last 30 years and trace out the reasons for its extinction. Was it maladaptation to changing environment, change in technology, lack of cooperative strategy, or any other reasons?.
- Identify a firm that you know which make, buy, and ally to carry out all its activities in the production chain and another firm that makes more than 90% of its activities within the production chain and map each firms’ organizational structure.
- Define outsourcing and make a study of two firms in your town on whom they outsource to and advantages and disadvantages of outsourcing.
- From a business newspaper, identify two mergers or acquisition event announcements and its impact on the share price. Identify the reasons for the merger or acquisition decision from the perspective of both the firms.
- Conduct a literature review of managerial self-interest as a motivating factor for merger or acquisition activity.
PROJECT FOR INSIGHTS
- Form groups of 5 to 7 students or staff members and each group select one listed company or organization that the group is familiar with.
- Identify the arbitrage possibilities this firm can use gainfully in other states and/or other countries. See Section 6.6 for different types of arbitrage. Identify arbitrage possibilities in SAARC countries, ASIAN, West Asia, Middle East and North Africa (MENA), Sub-Sahara Africa, Latin America, Europe, and so on.
- Imagine diversification possibilities taking advantage of the arbitrage.
- In order to grow through the diversification, as identified in the above mentioned step, think of alliances, partnerships, or acquisition as corporate strategy.
- Assess the merits and demerits of the corporate growth strategy selected. Make a list of the criteria used in selecting the partners, allies, targets for acquisition, and so on in the strategy.
- Identify what internal changes are required in system capabilities, culture, style, and structure in order to implement the selected strategy.
Table C6.1 Marico growth
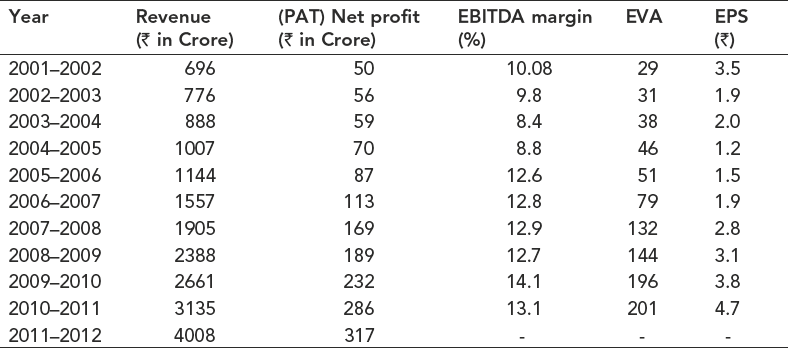
- Identify the generic strategy if any followed by Marico.
- Is there any kind of identity pursued by the firm?
- Why Kaya clinic is making losses despite SSS growth?
- Was there coherence in the strategy of Marico while establishing Kaya in 2002?
- What are the real reasons behind the demerger of Kaya?