6
Question #2—How Do We Measure Success?
You cannot manage what you cannot measure.
—Bill Hewlett, co-founder of Hewlett-Packard

FIGURE 6.1 Success Measures Describe What Each Objective Means
Develop Success Measures and Verifications
Objectives by themselves remain vague until pinned down by valid Success Measures.
Success Measures describe the conditions expected to exist when Objectives are achieved. Clarifying these conditions early strengthens your design and reduces later disagreement over whether project Objectives have been met. At the same time that you set measures, identify the data sources needed to verify the status of each measure. Be thoughtful and selective when choosing these important guides, as they constitute items to monitor on your project dashboard.
The term Success Measures also goes by other names such as metrics, Key Performance Indicators (KPIs), and Key Results Areas (KRAs), among others.
This chapter includes a case study that illustrates how even the most complex Goals can be clearly measured.
Measure What Matters Most
Setting clear Success Measures at the project start does two things. First, it strengthens the project design. Second, it reduces after-the-fact doubts and finger-pointing as to whether a project reached its intended Objectives.
In the LogFrame construct, Success Measures appear in the second column (see Figure 6.1). As you would expect, for each Objective you construct a Success Measure by combining an indicator and its target. The indicator describes the expected type of behavior, action, or event. The target makes the indicators more specific by adding the required numerical value to be achieved and/or a date by when it is to be achieved. It goes without saying that measures must be verifiable to be useful.
One common form of measures is to “Achieve X by Y date” or “Increase X from ___ to ___ by Y date”: for example, Achieve roll-out of new product by September 1, or Increase customer satisfaction by 20 percent within 3 months.”
The best Measures meet these criteria:
- Valid—They accurately reflect the meaning of each Objective.
- Targeted—They include numerical quality, quantity, and time targets that are pinned down.
- Verifiable—They can be verified by nonsubjective evidence or data.
- Independent—There are separate measures at each level in the hierarchy.
Your projects may include hard indicators that can be easily quantified as well as soft indicators that are more subjective. Let's go through the various types of indicators that may apply to your project.
Hard Indicators
The following list provides examples of hard indicators:
- Reduce errors by 20 percent in six months
- Enhance quality by 10 percent by Q2
- Increase net profits by 15 percent this year
- Stabilize performance within one standard deviation by Y date
- Improve funding by 30 percent within six months of project start date
- Increase total # of served clients by 15 percent by the end of the year
- Relocate 50 percent of materials to X location from Y location in one month
- Reach milestone X by Y date with Z resources
These examples show a future expected completion date. You can often break these down into interim targets for ongoing progress monitoring (e.g., 20 percent by end of January, 30 percent by end of February, etc.).
In many cases, rather than locking in a single quantitative target, it makes more sense to state a range (“between X and Y”). That is especially appropriate when there is little data to justify any specific number. You can also set minimum acceptable, desired, and stretch targets. For example, increase website traffic by 10 percent minimum; 15 percent desired; and 20 percent stretch target by June 30.
A good way to begin is to simply specify the types of indicators, but leave blank placeholders for the numeric targets, unless they are readily known. With discovery-type projects, it is common to target each indicator only after further learning, analysis, or consultation.
As you proceed, remember that what is easy to measure is not always important, and what is important is not always easy to measure.
Soft Indicators
Soft indicators are those that are intangible or subject to personal judgment. They lack a clear-cut criterion for their satisfaction, but are considered to have been achieved, or satisfied, when there is sufficient positive and little negative evidence for its claim. But that does not mean they do not get a target date. Some examples include:
- Improve employee morale by 20 percent by end of September
- In the fall, new students to be given more help than last year
- Improve the taste of the gravy next month
- Reduce employee dissatisfaction with the leadership within three months
- Enhance employees’ enjoyment of the annual summer picnic more than last year
- Ensure team communicates effectively
- Strengthen relationships among the crew
- Improve level of being candid in meetings
- Increase psychological safety on teams
- Make progress review meetings more productive
Applying the YouTube test can get you started in identifying soft indicators. Imagine what the video showing that the Objective has been (or is being) achieved would look like?” When you can picture the behavior or phenomenon in your mind, you can more easily choose indicators.
Targeting Your Indicators
Adding numerical values for each indicator is called targeting. Begin with the basic indicator, and then elaborate by describing as appropriate:
- Quantity—How many? How much?
- Quality—How good? What standards of performance?
- Time—By when? For how long?
- Customer—Who are the clients/users/beneficiaries?
- Cost—What resources are required?
Set numeric targets at a level that is sufficient to achieve the impact required at the next-higher level. Selecting appropriate targets can draw from past experience, data analysis, or negotiated agreement to establish what is realistic, achievable, and warranted. When all else fails, make a reasonable guess.
Make sure you have valid indicators that cover each key word in the statement of the Objective. Recall that the measures for Fircrest Purpose statement in Chapter 4 required five different indicators to capture each element of this multifaceted Objective.
How many Measures does each Objective need? It all depends. While a single Measure will sometimes suffice, multiple Measures are usually necessary to pin down all but the simplest Objectives. Choose the minimum number that enables you to monitor the progress toward each Objective with sufficient accuracy.
The easiest measures to monitor are at the Input and Outcomes level, which covers tasks, schedule, costs, and progress made (earned value). However, those that are the most important—those ascending towards Outcomes, Purpose, and Goal—are progressively more difficult. Purpose- and Goal-level Measures should be jointly developed and agreed upon by key stakeholders. Outcome measures are the project team's responsibility to set.
Other Variations and Combinations
The list below illustrates possible variations on the two major types described above.
- Single-point events: Complete ISO certification; Achieve breakeven point
- Time period targets: Achieve X results between Jan. 1 and March 31
- Range of results: Achieve minimum level of X, a target of 1.5X, and stretch target of 2.5X
- Performance targets: Reduce errors in code to less than X
- Minimum acceptable: Reduce customer churn by at least 15 percent
- Maximum acceptable: Customer complaints not more than 2 percent
- Current Indicators: Hotel occupancy rate
- Leading Indicators: Future hotel room reservations
- Lagging Indicators: Three-month trailing average
- Proxy or substitute Indicators: Count relative plant population by pollen count
- Compound Measures: Airline revenue per passenger seat-mile
Make vague indicators clear by adding targets, as shown in Figure 6.2.
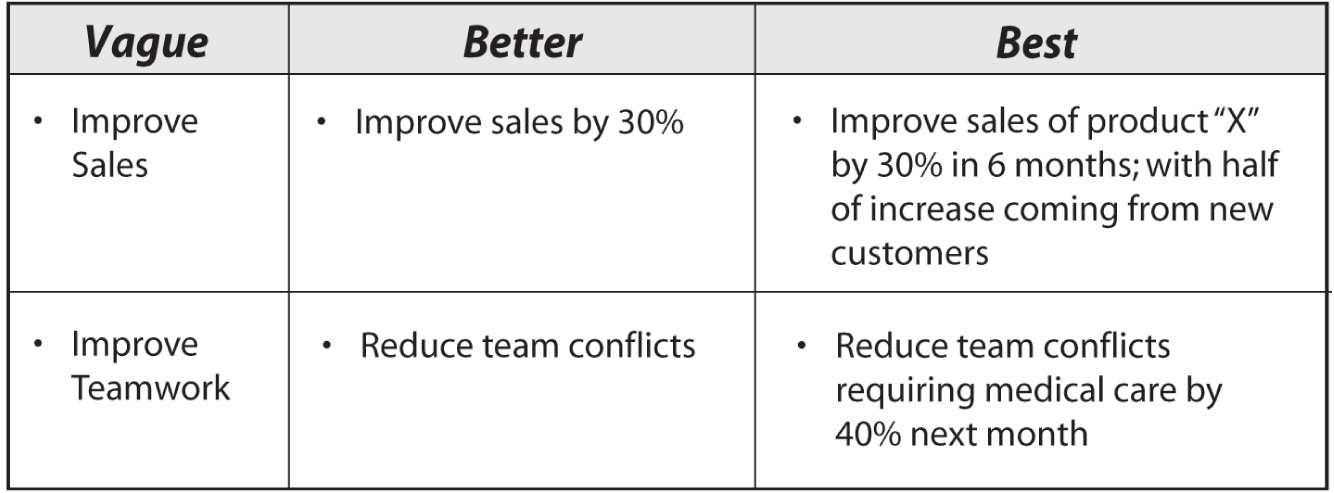
FIGURE 6.2 Make Measures Clear by Adding Targets
Determine How to Verify
The third LogFrame column, Means of Verification, identifies the source of data or other means to efficiently monitor and verify the status of each Measure.
Here are some examples:
Additional verification methods include the results of any measurement or analytical tools used, such as mathematics, statistics, and computer software.
Do not rely only on reports and other system-generated information to keep your finger on the project pulse. Reach beyond databases, computers, and formal status reports, and tap into the informal network. Sometimes an informal conversation yields better insights than the most recent reports. Getting candid information requires that you create a psychologically safe environment, as discussed further in Chapter 11.
Measurement has a cost in time, energy, and resources. So, first look to already existing and easy-to-use methods, and then supplement these as needed. Sometimes getting the information you would ideally like to have is too impractical, too complex, or too expensive. Make sure the cost of identifying and monitoring does not exceed the value of the information.
The Verification column forces you to consider and concisely summarize how status information will be generated, tracked, analyzed, reported, and utilized:
- Who needs what information and why?
- What specific measures provide what is needed?
- How timely and accurate must the information be?
- What format should it be in?
- What's the best way to get and share it?
Just because you can measure something does not mean you should. Give careful thought to choosing the most appropriate measurements.
With that introduction, we will now explore how to expand and Objectives Tree and turn it into a LogFrame with clear measures and Assumption.
Measures Help You Choose Among Alternative Approaches
In Chapter 2, we introduced an Objectives Tree for customer service improvement. Recall we were comparing three different paths and the team chose to eliminate one option, leaving two third-level Objectives to evaluate further (resolve issues faster, and speed up customer learning) We pick up the story at this point.
We can expand these two remaining third-level Objectives down another level, as shown in Figure 6.3.

FIGURE 6.3 Objectives Tree for Improving Customer Service
This offers a better picture of how each of the two remaining third-level Objectives could be achieved. You may decide one or both are necessary to achieve our second-level Objective of improved customer satisfaction and choose to build a project around them.
We have a choice to either include both of our third-level Objectives in a single LogFrame or to divide it into two LogFrames—one project for each third-level Objective. To keep the logic intact, if we divide it, each third-level Objective becomes an Assumption in the other's LogFrame.
For this example, we will choose to leave it all as one project and copy the Objectives to the left column of a LogFrame, shown in Figure 6.4. Then we populate the remaining cells by addressing the other Critical Strategic Questions. The resulting summary document paints a clear picture of the project strategy on a single page.
Special Types of Indicators
Two types of indicators can be particularly useful, if you know how to use them correctly: leading and proxy.
Leading Indicators
In most projects there is a lag time between Outcome completion and Purpose achievement in your project. The seeds that a farmer plants in the spring will not bring forth crops until the summer. But along the way, a smart farmer monitors leading indicators of probable success (or not) in order to adjust the plan. Soil too dry? Increase watering. Hungry birds waiting? Put up scarecrows.
Leading Indicators play an important predictive role. If the sales team is not meeting their weekly customer calls targets, Then the sales targets will not be met, nor will the financial Goal. Thus, knowing early on that targets for calling customers are not being met allows us to adjust as needed.
Have you identified leading indicators? Can you obtain early evidence that the business case is or will be fulfilled? Learn to spot trouble before it strikes, and decide how to prevent it! Action leads; results follow.
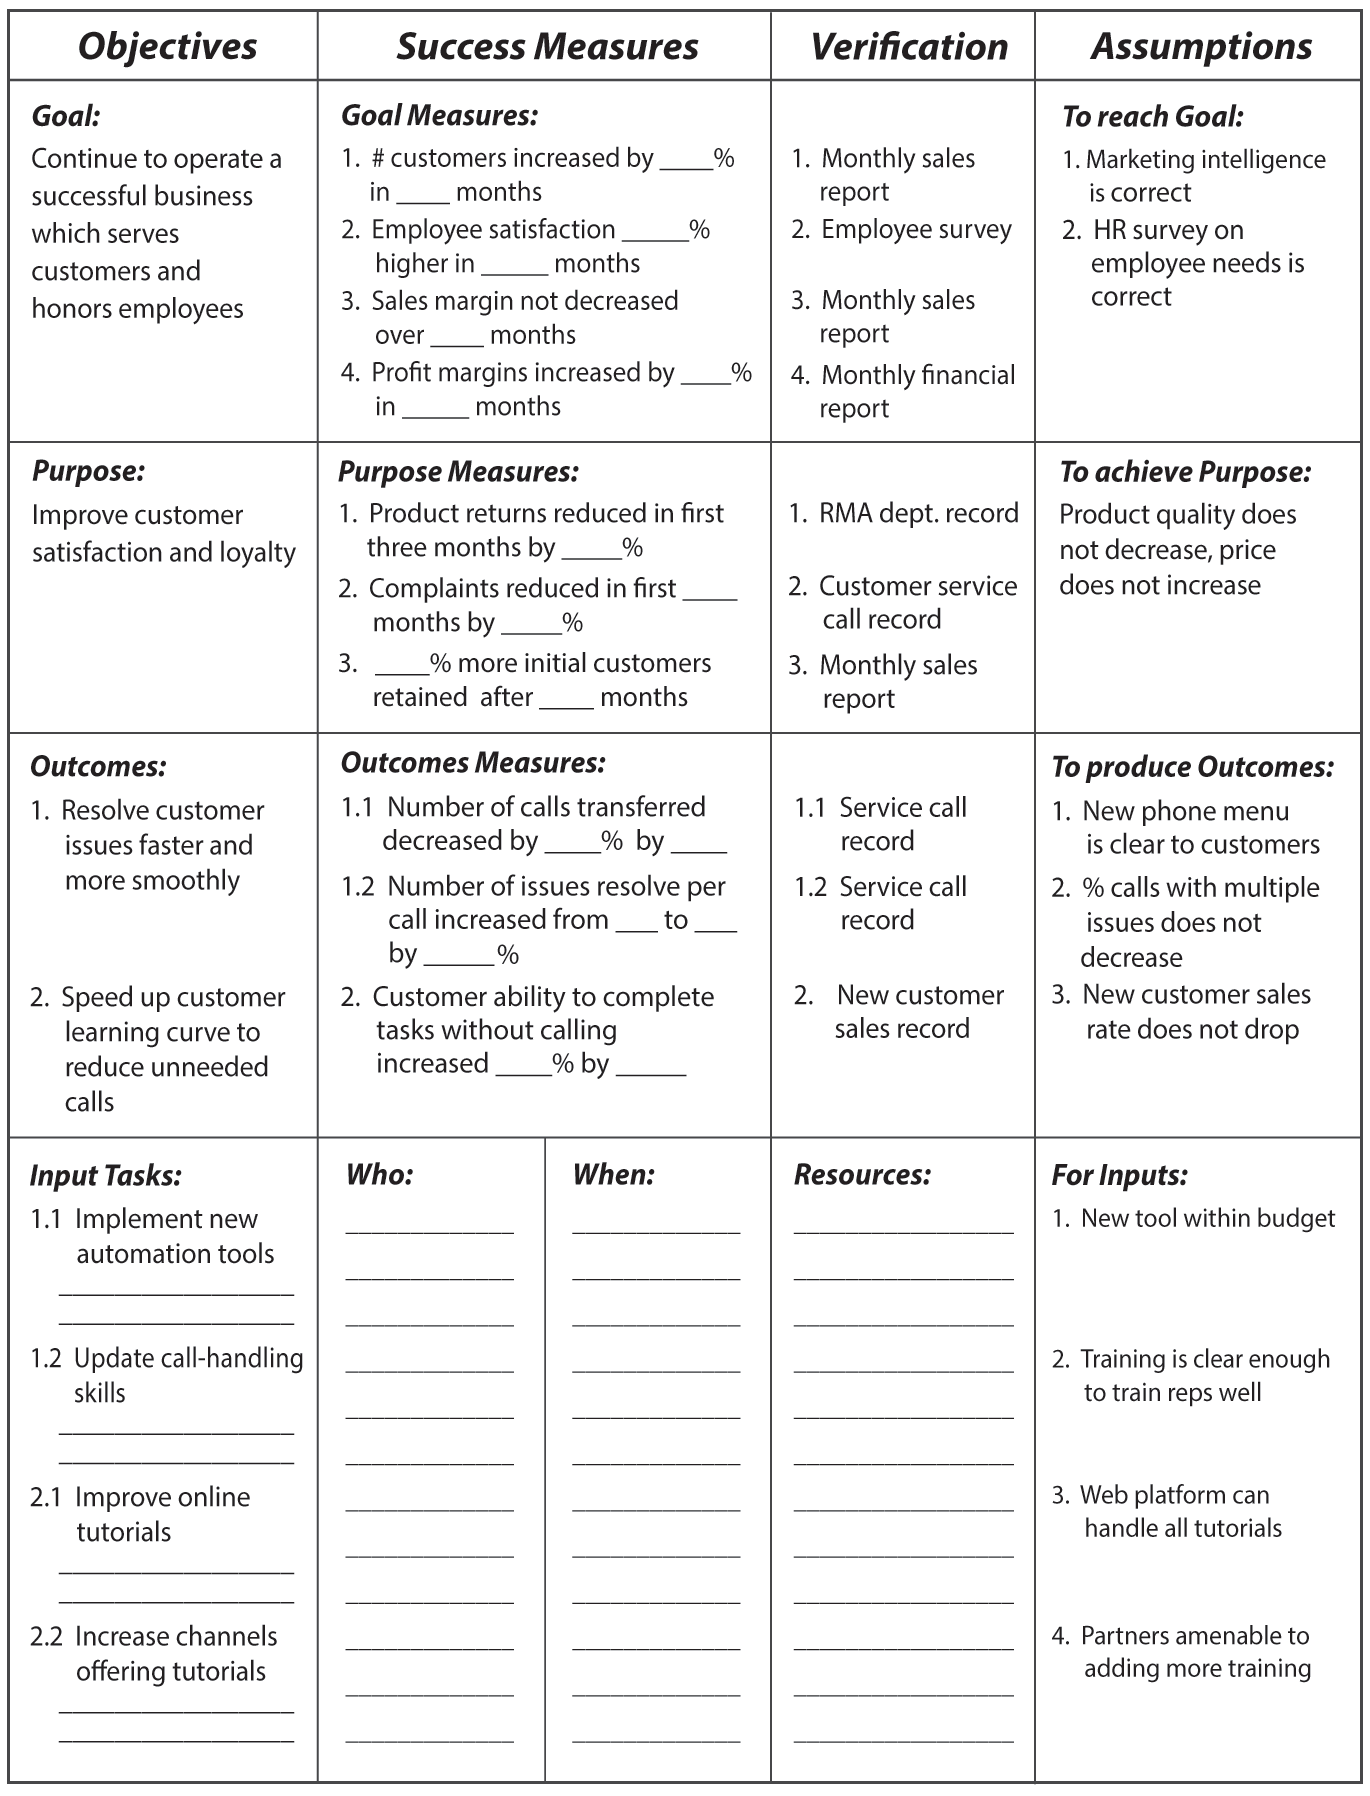
FIGURE 6.4 LogFrame for Improving Customer Service
Those learning-by-doing or agile efforts that involve frequent adjustments benefit highly from leading indicators and ongoing modification in order to redirect the strategy as needed during the project journey.
Proxy Indicators
When the preferred indicators are too difficult, too expensive, or too unreliable, choose a proxy (substitute) that closely correlates with the item of interest. While proxies are never as accurate, they are often the best you can do.
The rock band Van Halen pioneered high-energy rock concerts featuring pyrotechnics and complex special effects along with their legendary music. Several huge moving vans were needed to move their massive amount of equipment from city to city. Setting up the stage correctly in each new venue according to the instructions provided was critical, but not all local crews carefully followed the steps.
So, Van Halen inserted a clause into their contract which specified that their dressing room would contain a bowl of M&Ms, with all the brown ones removed. Upon arriving at a new venue a few days ahead of the performance, they would first check the M&M bowl. If there were no brown ones, they could reasonably conclude the set-up instructions had been followed. If there were brown M&Ms in the mix, the band would double-check all the connections just to make sure the equipment had been set up properly.
What proxies might you use for hard-to-measure dimensions of your project? How will you know that people are engaged and committed? How about team effectiveness? Relations with sponsors? Stakeholder support?
Case Study: Winning the Peace After Winning the War
My appreciation of the LogFrame's power to measure complex Objectives multiplied after I served as a consultant to His Excellency the Wali (governor) of Dhofar in the Southern Region, in the Sultanate of Oman. Oman is a small Arab country tucked beneath Saudi Arabia on the edge of the Arabian Sea. While this example may be far from your field of work, it illustrates how well-chosen measures and cost-effective Verification methods enable leaders to evaluate progress towards the Goal.
In the mid-1970s, Oman was wracked by Chinese-backed insurgents from Yemen, who enticed some of the local population to rise up against the government. Following years of fighting, the war ended after the government finally found a compelling way to convince the rebels to lay down their arms and surrender: They paid them in cash.
Having won the war, His Excellency then shifted his attention to “winning the peace”—a much tougher proposition. At the time, Oman's citizens in the southern region consisted primarily of nomadic herdsmen without permanent homes. The herdsmen had to move their cattle frequently in search of scarce water, as the result of shifting rainfall patterns.
The government's strategy was to put in place a community infrastructure that would encourage stable villages to become established. His Excellency believed that by drilling deep wells and creating several dozen year-round water sources, herdsmen would settle down in permanent locations, thus building communications and contributing to stability. A plausible hypothesis.
In each community, the government would also put in place other Outcomes, such as schools, health clinics, mosques, and markets. This new physical and institutional infrastructure—when accepted and used—would produce a stable environment for social, economic, and political advancement. In brief, the logic was as follows:
This approach had never been tried before, and there was no guarantee of success. However, without the ability to track progress using well-chosen Measures, the government would not know if the strategy was working or if the insurgency was in danger of erupting again.
Over a six-week period, I guided senior government staff in creating a master LogFrame, which was exquisitely hand-drawn by Indian draftsmen on a six-foot tall vellum document, in both English and Arabic. Between working sessions, our project team staff would travel to remote villages by helicopter, armor-plated Land Rovers, or camel to gather baseline data as well as to consult with local residents.
The complexity and multiple dimensions of the Omani Goal required a comprehensive set of Measures and Verifications, as shown in Figure 6.5. The Goal statement is adequately described using three Measures categories that cover social conditions, and a fourth that covers security. Note the specific targets under each category.
His Excellency joined us during the final session when the team briefed him about the strategy using the LogFrame. His Excellency accepted responsibility for influencing certain Assumptions beyond the team's control. The program was successful, and today Oman remains a progressive and moderate Arab nation.
The full Win the Peace LogFrame demonstrates how to capture a complex strategy in just three pages. This is included at www.ManagementPro.com/bookbonus, where you will find other LogFrame examples and additional resource material.
Select the Right Way to Verify
An unusual story from this project shows the importance of a good means of Verification. To stem the possible outbreak of a particular disease in a selected area, Omani Health Ministry officials planned to vaccinate 95 percent of the population of 6,000 in a particular area within 12 weeks. Their Means of Verification was to count the number of inoculations given, as shown Figure 6.6.
Early results were impressive. After four weeks, project data showed 4,500 people were inoculated out of a population of 6,000. In the fifth week, 5,700. At ten weeks, 9,000 people, 150 percent of the estimated population!
Wait! Something was wrong. Those in charge huddled and concluded their population estimates must have been incorrect. Only later, after interviewing villagers, did they discover the true problem.
Here is what happened. Less than 20 percent of the population had actually received an injection. But this same 20 percent returned week after week, under the false assumption if one injection is good, lots of them are even better.
The Omani program managers fell into the trap of measuring what is easy to measure (by counting the number of inoculations given,) rather than what is important to measure and monitor.

FIGURE 6.5 Goal Measure for Achieving a Stable Environment in Oman

FIGURE 6.6 Measures and Verification for the Oman Inoculations
Had they tracked who actually received inoculation by name and village, they would have detected the problem earlier.
Fortunately, there were no serious long-term health effects to those who received multiple injections. Rest assured the managers corrected their methodology after discovering their error.
Chalk it up to inadequate education, poor means of Verification, and the lag time in analyzing collected data. The lesson: Make sure you have a valid way to verify the measures that matter most.
Review Key Points
- Remember that what is easy to measure is not always important, and what is important is not always easy to measure. And you cannot manage what you cannot measure.
- Success Measures consist of indicators and targets. They add clarity to Objectives by describing expected behaviors, actions, or events, including required quantitative values and dates.
- Verifications identify the means by which Success Measures will be tracked and verified. They make you consider and concisely define how status information will be generated, tracked, analyzed, reported, and used.
- Indicators may be quantifiable or “hard,” subjective or “soft.” Measures too tough or too expensive should be changed.
- Purpose Measures describe conditions you expect when you are willing to call the project a success and should be set first. That way, you can set targets at levels that are sufficient to achieve the Purpose Measures.
- Because Goal, Purpose, and Outcomes are independent Objectives, their Measures must be independent as well.
Apply Step #2
To move forward, you need to build on your established objectives.
- Review the Objectives you completed in Applying Step #1. Make sure you have clear statements and valid If-Then logic connecting Goal, Purpose, and Outcomes.
- Beginning with Purpose, develop clear Measures using Quality, Quantity, and Time (QQT) as appropriate (and perhaps include customer and cost). Describe each Measure with complete sentences, phrases, or bullet points. As you set Measures, choose the most cost-effective Means of Verification.
- Make sure each Measure includes indicators and targets.
- Set them aside for a few days, then take a fresh look. Invite input from others. Continue to improve your Measures, and do not prematurely freeze them.
- In addition, identify a few indicators that concern the performance of your project team and management process. These process gears need to turn easily and mesh smoothly to maintain high performance.
Coming Up Next
Multiple factors outside of your control can derail your project. What can you do about these risks? This is where analysis of Assumptions enters the picture. Assumptions always exist, whether we acknowledge them or not. Many project failures arise from not identifying them well enough to mitigate the risks. Ask yourself the third Strategic Question: What other conditions must exist? And discover how they add another puzzle piece into the LogFrame solutions matrix.