
Investment Portfolios of Takaful Undertakings
Although the takaful industry has been gaining substantial growth and interest since the Islamic Financial Services Board began operations in early 2003, there is still an absence of relevant statistics pertaining to the industry. Hence, this research was conducted by the author. The relevant research data gathered and presented in this chapter could be considered as a first step toward understanding the investment behavior of takaful companies.
The hybrid structure of takaful, which is in contrast to that of conventional insurance undertakings, requires special attention once an investment strategy is under investigation. In particular, the investment strategy for each of the funds under the takaful structure should be individually studied. These funds comprise the shareholders' funds of the takaful operator on the one hand, and the funds of takaful participants (policyholders) on the other hand. Moreover, the latter include underwriting or risk funds and, in the case of life (or family) takaful, the participants' investment funds. The underwriting or risk funds include mortality risk funds in family takaful and, in the case of general (non-life) takaful, the relevant underwriting funds (for example, that for motor insurance) referred to below as “general funds.” The reason for the need for individual study lies in the different nature of the liabilities under each fund, which calls for a different investment strategy or composition.
For the purpose of the study conducted, under the family takaful, the participants' special (risk) fund and the participants' investment fund are, in fact, combined under one fund called the “family fund.” The reason for combining them was the difficulty in segregating the data for these funds, as the IT system used by many takaful companies cannot provide the needed detailed information accurately. In any event, in terms of size, the investment fund largely dominates the mortality risk fund; moreover, the latter risk is long tail.
To date, there has been no study conducted on the investment behavior addressing each of the funds individually. Likewise, detailed statistics about investment portfolio composition for each fund are not available. Therefore, this study was conducted with the aim of exploring the asset classes comprising investment portfolio composition of the shareholders' fund, general funds, and family funds of takaful companies. Moreover, the study compared the current and desired levels of the investment portfolio composition for each of the above-mentioned funds.
Finally, an investigation was performed on some factors that might affect the investment composition of takaful undertakings. The study was confined to two geographical groups, namely the Gulf Cooperation Council (GCC) countries and Malaysia, for several reasons. First, the majority of takaful undertakings in the world are concentrated in the GCC countries1 and Malaysia.2 Second, the Islamic finance industry, which includes banking, insurance, and capital markets, has been established in these regions, which represent the hub of this industry. The data was collected from major takaful undertakings in these markets which represented 95 percent of the market in Malaysia and 90 percent of the GCC market. The data for the study were collected in 2006, covering the years 2002–05. In this chapter, the focus will be on the exploration of investment portfolios for takaful undertakings, with a comparison between GCC and Malaysian takaful undertakings.
11.1 TOTAL INVESTMENT PORTFOLIO OF TAKAFUL UNDERTAKINGS FOR ALL FUNDS
Overall, the total investment portfolio of takaful undertakings for all funds amounted to US$2.3 billion at the end of 2005 compared with US$1 billion at the end of 2002, an increase of 130 percent during the years of the study. As shown in Figure 11.1, for all the years of the study, Malaysian takaful had a dominant share of the total overall investment portfolio. The contribution of the GCC countries' takaful to the overall investment portfolio gradually increased to reach its maximum of 36.5 percent by the end of 2005.
Figure 11.1 Comparison between size of investment portfolio for shareholders', general, and family funds in GCC and Malaysia (US$ million), 2002–05
Source: An Analysis of the Investment Portfolio Composition of Takaful Undertakings in the GCC and Malaysia, PHD, Dr. Abdulrahman Tolefat, University of Durham, 2008
Figure 11.1 summarizes the comparison between the sizes of investment portfolios for each of the funds in GCC and Malaysia from 2002 to 2005. The comparison shows that the family takaful investment portfolio was the main component of the overall Malaysian takaful investment portfolio, while shareholders' funds were the main contributor to the GCC takaful investment portfolio. In the analysis for each fund to be covered next, it will be shown that the combined family fund figures were dominated by the Malaysian undertakings, while the shareholders' fund figures were dominated by the GCC undertakings. With regard to the general fund, the GCC and Malaysian undertakings contributed almost the same to the overall investment portfolio. The composition of each fund is discussed in detail in the following sections, with special emphasis on the comparison between the two groups: GCC and Malaysia.
Over the entire period of the study, the takaful in the GCC countries dominated the contribution to the total shareholders' funds investment portfolio, since the total shareholders' funds investment portfolio of the GCC countries exceeded that of Malaysia by an average ratio of 3.17 times. In 2005, the investment of the GCC countries' shareholders' funds was proportionately much higher, accounting for 85.8 percent of the total combined shareholders' funds investment portfolio, which means that the total investment of takaful shareholders' funds in the GCC countries was more than six times that in Malaysia. There are several factors that seem to have contributed to this dominance. These include the size of the capital of the companies and the nature of the investment composition in both market groups, which will be explained later.
Before studying the investment portfolio of the shareholders' funds, it is crucial to understand the role of capital under the takaful structure. As discussed in the previous chapters, the role of capital under the takaful structure is a matter of debate among Shari'ah scholars and market players, as well as the regulators.3 While some believe that the role of capital is just to satisfy regulatory requirements, others insist on the importance of capital to support the takaful funds, especially in the case of deficits arising from takaful operations.
The differing views on the role of capital under the takaful structure were clearly seen in the survey results when takaful companies were asked whether they believed that shareholders' funds under the takaful structure should be regulated by the regulators and should be subjected to the solvency margin requirements.4 A majority of the takaful companies surveyed, representing 72.7 percent of the total respondents, believed that shareholders' funds should be regulated. However, they added that the requirement for takaful fund regulation should be lighter. They reasoned that, while, theoretically, shareholders' funds do not bear any risk, in practice, they should provide a back-up to takaful funds, in the form of a qard (interest-free loan) facility to cover any deficit.
The other 18.2 percent of the total respondents took the position that shareholders' funds should not be regulated at all as they do not bear any risk, according to the Shari'ah rules. They stated that the takaful operating company acts as an intermediary to collect the contributions, pay claims, and so on, without bearing any underwriting risk. The remaining 9.1 percent of the total respondents held a very strict view that regulation must be the same for shareholders, funds and participants' funds. It can be argued that the view taken on the role of capital of a takaful operating company would affect the investment strategy applied to shareholders' funds. Therefore, it is interesting to explore the investment portfolio composition of shareholders' funds in order to determine the attitude of the takaful operating companies as regards the management of the investments of these funds.
In practice, there are different approaches to regulating shareholders' funds. In GCC countries, except Bahrain, there are no specific regulations pertaining to the takaful industry. However, the activities of both the conventional and takaful insurance companies are governed by insurance laws. These laws, being based on the structure of conventional proprietary insurers, do not recognize any distinction between shareholders' funds and participants' funds and consider the funds as one entity—that is, as belonging to the shareholders. In contrast, Bahrain and Malaysia have special regulations for the takaful industry and treat the funds distinctly. Both countries follow the approach favored by the majority of takaful companies—namely, regulating shareholders' funds with lighter regulations than apply to participants' funds.
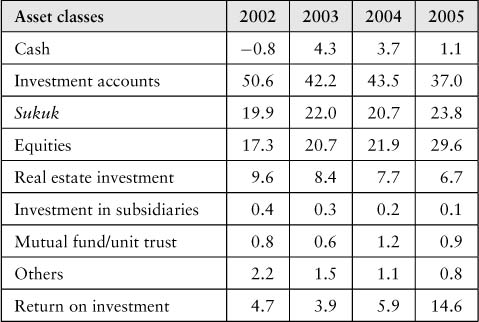
During the four years of the study, the total shareholders' funds investment portfolios of takaful companies increased at an average annual growth rate of 91.3 percent. The highest growth rate of 154 percent was observed in 2005, up from US$301.6 million in 2004 to US$766.1 million in 2005. This was largely due to the dramatic increase in investment accounts, equities, and especially investments in subsidiaries, which grew by 150 percent, 150.9 percent, and 2,225.3 percent, respectively. With regard to the composition of the shareholders' funds investment portfolio, as shown in Table 11.1, the two dominant asset classes from 2002 to 2005 were investment accounts and equities, which together represented an average of 65.8 percent of the total shareholders' funds investment portfolio during these years.
Table 11.1 Composition (%) of Shareholders' Funds Investment Portfolio, 2002–05
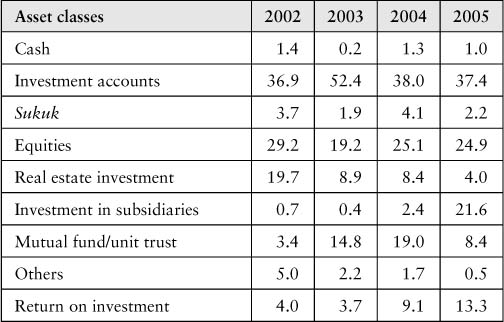
Source: An Analysis of the Investment Portfolio Composition of Takaful Undertakings in the GCC and Malaysia, PHD, Dr. Abdulrahman Tolefat, University of Durham, 2008.
The third-largest asset class in the shareholders' funds investments varied from real estate (19.7 percent) in 2002 to mutual fund investment in 2003 and 2004. However, due to the expansion and consolidation caused by one large company in the GCC, investments in subsidiaries (21.6 percent) became the third-largest asset class in 2005. It should be noted that the three major asset classes represented more than 80 percent of the total investment portfolios for shareholders' funds in each of the years of the study.
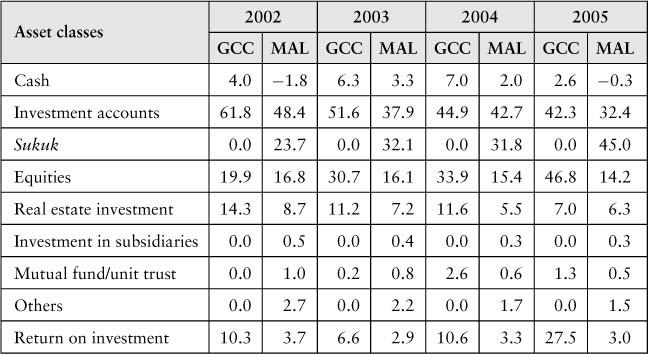
A comparison was made to explore the differences between GCC companies and Malaysian companies in managing the shareholders' funds investment portfolio. As presented in Table 11.2, the largest asset class for takaful companies in both the GCC countries and Malaysia was investment accounts, although its share of the total shareholders' funds investment varied. In Malaysia, investment accounts showed an increasing trend and accounted for almost 48 percent of the total by the end of 2005, compared with 35.7 percent in the GCC countries. While the largest asset class was the same for takaful companies in the GCC countries and Malaysia, the second-largest asset class was different in these groups.
Table 11.2 Composition (%) of Shareholders' Funds Investment Portfolio—GCC Countries Versus Malaysia, 2002–05
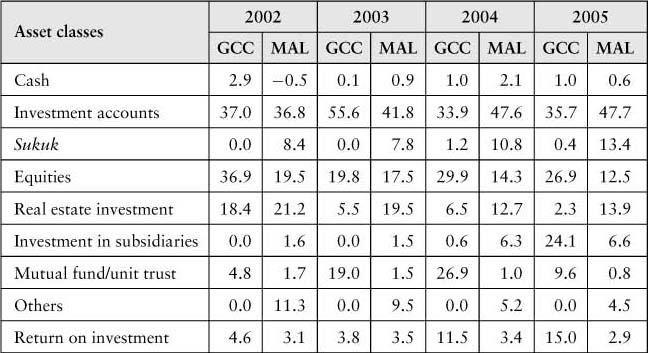
Source: An Analysis of the Investment Portfolio Composition of Takaful Undertakings in the GCC and Malaysia, PHD, Dr. Abdulrahman Tolefat, University of Durham, 2008.
The investment in equities represented the second-largest component of the investment portfolio of the shareholders' funds in the GCC companies over the entire period of the study. In contrast, for the Malaysian companies, real estate investments were the second-largest asset class, except in 2004 when equities were the second largest. The third-largest asset class fluctuated in both the GCC countries and Malaysia. In the former group, the investment in mutual funds class tended to be the third largest, while in Malaysia the fluctuation was between investment in equities and in sukuk. It should be noted that in both the GCC countries and Malaysia, investment accounts were used for short-term investments. However, for long-term investments, there is a difference between the two groups. Malaysian takaful companies invested almost equally in equities, sukuk, and real estate, while GCC takaful companies invested in equities and mutual funds. As shown in Figure 11.2, generally in Malaysia there was a larger gap in the proportions in the portfolio compositions between the largest asset class (investment accounts) and the second- and third-largest asset classes, compared to the gap in the GCC countries, where the three major asset classes in the composition were closer in proportion.
Figure 11.2 Comparison between the compositions of the three major asset classes—GCC versus Malaysia, 2002–05
Source: An Analysis of the Investment Portfolio Composition of Takaful Undertakings in the GCC and Malaysia, PHD, Dr. Abdulrahman Tolefat, University of Durham, 2008
11.3 ANALYSIS OF SHAREHOLDERS' FUNDS BETWEEN THE GCC COUNTRIES AND MALAYSIA
The differences in the composition of shareholders' funds investments between the GCC countries and Malaysia were mostly to be found in their level of liquidity in the fund, in their investments in sukuk, and in their return on investment (ROI). With regard to the level of liquidity, one feature of the companies in both the GCC countries and Malaysia is the higher proportion of their investment portfolio held in the form of investment accounts, all of which investments are on a short-term basis. This indicates that the companies utilized investment accounts as their main tool for managing liquidity. Although takaful operating companies do not bear the underwriting risk that conventional proprietary insurance companies are subject to, and are in theory not liable to cover underwriting deficits, practically all takaful operating companies still want to be liquid enough to provide the necessary qard facility whenever takaful funds are in deficit.
However, the levels of liquidity varied between the GCC countries and Malaysia. The takaful companies in Malaysia were more likely to be liquid by keeping the level of composition of investment accounts almost at 48 percent of the total shareholders' funds portfolio. This was due to the small size of shareholders' equity in Malaysia, relative to the amount of business managed by them. Unlike those in Malaysia, the GCC companies are over-capitalized with regard to the level of gross contributions underwritten, as well as the volume of investments handled by them. Therefore, there is no incentive in the GCC countries to keep the investments of shareholders' funds more liquid by placing more funds in investment accounts, especially in companies with a large amount of capital.
Other differences between the GCC and Malaysian companies that were confirmed by inferential analysis relate to investments in sukuk and ROI. Using the Mann-Whitney U Test, a non-parametric equivalent of the t-test, it can be concluded that there is a significant difference between the companies in the GCC countries and Malaysia in terms of the proportion of sukuk in their investments (at a 95 percent level of confidence in 2005 and 2004) as well as their ROI (at a 95 percent level of confidence in 2005).
The proportion of sukuk in the shareholders' funds investment portfolios of the Malaysian companies was relatively high, compared with those of the GCC companies where the proportion of this asset class was close to zero. There are several reasons for this investment behavior. The first is the absence of a secondary market for sukuk in the GCC countries, in addition to a limited primary market. Second, some takaful operating companies in the GCC countries have tended to avoid investing in sukuk even when they are available in the market, because of the lower levels of return obtainable from sukuk compared with other more volatile or illiquid but booming asset classes in the GCC countries, such as equities and real estate.
Moreover, it should be noted that the sukuk positions that the Malaysian companies held in their shareholders' funds portfolios consisted of corporate sukuk only. The reason for not buying any government sukuk was the tendering system used by Bank Negara Malaysia (BNM) for government sukuk. This system also allows conventional insurance companies, which are subjected by BNM to a mandatory minimum investment in government securities, to bid for government sukuk. As the conventional insurance companies are much bigger than the takaful companies, they are able to acquire substantial amounts of government sukuk at good prices. If the takaful companies want to acquire these sukuk, they have to buy them later from the conventional insurance companies at higher prices.
Regarding the return on investment, while the Malaysian companies generated a single-digit ROI with a declining trend, the GCC companies obtained a double-digit ROI with an increasing trend, which reached 15 percent by the end of 2005. This difference between the GCC countries and Malaysia was supported statistically at a 95 percent level of confidence in 2005. This difference could be attributed to the dominance of investment accounts in the Malaysian portfolios which produced a lower rate of return than other asset classes, particularly due to the diminishing interest rates on securities denominated in Malaysian ringgit which was pegged until 2005 to the U.S. dollar. Unlike the Malaysian takaful companies, the GCC companies invested a lower proportion in investment accounts and offset the lower returns coming from investment accounts by investing in other asset classes that produced higher rates of return but with higher risks, such as equities.
In summary, there are different strategies in managing the investment of shareholders' funds between the GCC countries and Malaysia, which can be summarized in two points. First, since the takaful operating companies in Malaysia manage a large volume of business with a relatively small amount of capital, priority was given to the liquidity of the shareholders' funds by investing in investment accounts on a short-term basis in order to be ready to support the takaful funds in the case of a deficit. However, on a long-term basis, investments were made almost equally in equities, real estate, and sukuk. Compared with the Malaysian takaful operating companies, some GCC companies are over-capitalized. Therefore, there is less need to keep the shareholders' funds in more liquid assets. In addition, GCC companies tend to invest in equities and mutual funds to offset the lower returns obtained from investment accounts.
Second, the takaful companies in Malaysia invested a reasonable proportion in sukuk compared to those in the GCC countries, as the sukuk primary and secondary markets are in more advanced stages in Malaysia. However, the Malaysian companies did not invest in government sukuk, for the reason given above. It can be concluded that although the regulation of takaful companies in the GCC countries and Malaysia does not place any restrictions on the investment of shareholders' funds, a relatively conservative approach to the investment of these funds was observed.
The gap between the GCC countries and Malaysia in terms of the size of their total general fund investment portfolio has been gradually reduced. At the end of 2002, the general fund investment portfolio in Malaysia totaled US$104.3 million, while that of the GCC companies was 5.2 times smaller, at US$20.1 million. However, the gap gradually diminished during the four years of the study, and was almost nil by the end of 2005, as more takaful companies had emerged in the GCC countries and the amount of non-life business underwritten by the takaful companies in this region had grown.
The total general fund investment portfolio in the two geographical areas recorded an average annual growth rate of just under 40 percent during the years of the study, reaching US$333 million at the end of 2005, as compared to US$124.4 million at the end of 2002. As shown in Table 11.3, investment accounts, equities, and sukuk dominated the investment portfolio composition for the general fund, with a total share representing 90.4 percent of the total by the end of 2005. Investment accounts remained the first major asset class in the portfolio. However, their share fell from 50.6 percent in 2002 to 37 percent in 2005 in favor of other asset classes, particularly equities and sukuk. It is worth mentioning that investments in sukuk were the second major asset class during the earlier years of the study, while investments in equities took this place in the last years. This was due to the dominance of Malaysian companies, which preferred to invest in sukuk, in the earlier years of the study, as against the rise in weight of the GCC countries, with their preference for investing in the general fund in equities, in the later years.
Table 11.3 Composition (%) of Total General Fund Investment Portfolio, 2002–05
Source: An Analysis of the Investment Portfolio Composition of Takaful Undertakings in the GCC and Malaysia, PHD, Dr. Abdulrahman Tolefat, University of Durham, 2008.
When a comparison is made between the GCC and Malaysian companies, substantial differences can be observed in the composition of the general fund investment portfolios, as shown in Table 11.4. In the GCC companies, investment accounts, equities, and real estate were the three major asset classes, representing on average 94 percent of the total portfolio during the years of the study. By comparison, investment accounts, sukuk, and equities represented on average 89 percent of the total portfolio in Malaysia.
Table 11.4 Composition (%) of General Fund Investment Portfolio—GCC Countries Versus Malaysia, 2002–05
Source: An Analysis of the Investment Portfolio Composition of Takaful Undertakings in the GCC and Malaysia, PHD, Dr. Abdulrahman Tolefat, University of Durham, 2008.
As shown in Figure 11.3, the three major asset classes in the GCC countries and Malaysia were stable, except in 2005, when the order changed and the proportions of equities and sukuk, respectively, overtook that of investment accounts to become the largest asset class in the GCC countries and Malaysia, respectively. Moreover, as for the shareholders' fund, companies in both the GCC countries and Malaysia invested in investment accounts and cash on a short-term basis. In contrast, a difference was seen between the two groups on long-term investments. The takaful companies in the GCC countries invested mainly in equities as the primary asset class (83.7 percent of long-term investments by 2005) and in real estate as the second asset class (12.6 percent of long-term investments by 2005). However, in the case of the Malaysian companies, sukuk were used as the primary asset class (61.6 percent of long-term investments by 2005) and equities as the second asset class (19.4 percent of long-term investments by 2005).
Figure 11.3 Comparison between the compositions of the three major asset classes for general fund—GCC versus Malaysia, 2002–05
Source: An Analysis of the Investment Portfolio Composition of Takaful Undertakings in the GCC and Malaysia, PHD, Dr. Abdulrahman Tolefat, University of Durham, 2008
11.5 ANALYSIS OF GENERAL FUND BETWEEN GCC AND MALAYSIA
The differences in the general fund investment composition between the GCC countries and Malaysia were mostly to be found in (a) the level of liquidity of the funds, (b) the composition of the two major asset classes in 2005, (c) investments in sukuk, and (d) ROI. Regarding the level of liquidity, takaful companies in both the GCC countries and Malaysia were keeping their general funds liquid by investing in investment accounts rather than in any other asset classes. However, the GCC companies tended to be more liquid than the Malaysian companies.
The short-term investment portfolios for general funds in both groups gradually decreased from 65.8 percent in 2002 to 44.1 percent in 2005 in the GCC countries, and from 39.7 percent to 26.9 percent in Malaysia during the same period. The difference between the two groups in the level of short-term invested assets could be attributed to the nature of the long-term investment portfolio. In the GCC countries where equities dominated the long-term investment portfolio, the companies recognized the market risk of liquidating equities by utilizing higher investment accounts positions on a short-term basis in order to keep the general funds liquid for meeting any future claims. In contrast, in Malaysia where the sukuk market is relatively liquid, takaful companies were making fewer short-term investments and investing mostly in sukuk on a longer-term basis in order to generate more income than would be earned on investment accounts.
It should be noted that both groups preferred to utilize investment accounts as an asset class for liquidity owing to their perception that investment accounts are viewed as the safest, the most liquid, and the most suitable asset class for meeting claims on the general funds. This was confirmed by the results of the qualitative analysis of the perception of the leaders of the companies surveyed.
Another difference was seen in the change of the first asset class in 2005 in both groups, as shown in Figure 11.3. The first two major asset classes in Malaysia—namely, investment accounts and sukuk—changed places from 2004 to 2005. Investments in sukuk represented 45.0 percent in 2005, up from 31.8 percent in 2004; while investment accounts amounted to 32.4 percent, down from 42.7 percent in 2004.
The reason behind these changes could be the decline of the profit rate on investment accounts in Malaysian ringgit due to the pegging of the ringgit to the U.S. dollar. In particular, takaful companies in Malaysia were trying to enhance their returns on their general fund investment portfolios, while at the same time remaining liquid by investing in sukuk.
Unlike Malaysian takaful companies, the proportion of investment by GCC companies in equities (46.8 percent) overtook the proportion invested in investment accounts (42.3 percent) and became the largest asset class in general fund portfolios by the end of 2005. The GCC takaful companies tried to offset the lower returns generated from investment accounts by investing aggressively in equities. While investment in equities might not be a serious issue for shareholders' funds, the existence in the general fund portfolios of aggressive positions in this asset class could be perceived as a matter of high concern. This is due to the fact that the liabilities for claims on the general funds are, in most cases, of a short-term nature (short tail). Hence, aggressive investment in equities could expose the companies to market risk, in the form of equity position risk (price volatility in the stock market). However, it could be argued that in the GCC, the increase in the companies' investment in equities might not be due to the acquisition of new shares in the equities portfolios, but rather to increases in the prices of the shares held by the takaful companies, as prices on the stock exchanges in the GCC countries registered a substantial increase during 2005.
Another possible reason for this aggressive investment behavior in the GCC countries is the absence of efficient primary and secondary markets for sukuk in that region. The absence of a sukuk market in the GCC countries left the takaful companies with no option but to invest in volatile and illiquid asset classes such as equities and real estate, to enhance the returns on their portfolios. However, based on the qualitative analysis and meetings conducted with top leaders in the GCC takaful companies, in some of these companies, an aggressive investment attitude was found with regard to investing in equities and real estate, which had been experiencing substantial growth in the GCC region. In particular, some of the leaders of the takaful companies would favor the above-mentioned investment strategy even if sukuk markets were available. Also, the demand from the shareholders of the takaful companies for higher returns on equity (ROE) would lead some takaful companies to adopt this aggressive investment behavior to meet their shareholders' expectations.
Moreover, the average ROI on general fund investment portfolios for the GCC companies was far higher than the average ROI for the Malaysian companies. The GCC companies overperformed and generated double-digit ROIs, particularly in 2005 when the ROI reached 27.4 percent. On the other hand, the takaful companies in Malaysia underperformed, with an average ROI of 3.0 percent in 2005. The significant difference in the ROI in 2005 between the two groups was confirmed statistically by a Mann-Whitney U Test at the 95 percent confidence level.
The unusually high rates of return in the GCC countries compared to ROIs in the conventional general insurance industry may be explained as follows. First, we may note the aggressive investment strategy of GCC takaful companies which involved investing a higher proportion of the general fund investment portfolios in equities, coupled with the fact that many stock exchanges in the region reached their peak in 2005. Second, we may note the lack of advanced regulation in the GCC countries, where there were just basic regulations included in their insurance laws.5 These basic regulations do not restrict the companies from investing aggressively in volatile or illiquid asset classes such as equities and real estate; nor do they impose risk weights on assets, which would limit investments in riskier asset classes.
Furthermore, as mentioned earlier, a major difference between the GCC countries and Malaysia was seen in the investment in sukuk. This was confirmed statistically by using a Mann-Whitney U Test in which the difference was significant at the 95 percent confidence level during all the years of the study. This was due to the lack of active primary and secondary markets for sukuk in the GCC countries, in contrast to the relatively active market in Malaysia.
Although the companies in Malaysia had a nil position of government sukuk in their shareholders' fund portfolios owing to the high acquisition cost, this type of sukuk could be found in the general fund portfolios where the cost issue is still relevant. The reason behind this was the regulation imposed by Bank Negara Malaysia. In this regulation, there is a mandatory requirement to invest at least 15 percent of the total value of the assets of the takaful fund in government securities. According to the survey conducted, some takaful companies in Malaysia would like to decrease the current level of the government sukuk in their investment portfolios from 26.5 percent to 18.5 percent of total general fund investment portfolios. This desire was also confirmed by some leaders of takaful companies in Malaysia during the interviews conducted.
In summary, the investment behavior of takaful companies in Malaysia approximates closely the behavior of conventional insurance companies. In contrast, the GCC takaful companies behave differently from conventional insurers by holding larger positions in equities. However, although the GCC takaful companies have very large positions in equities, it could be argued that these companies are not exposed to such extreme risks, as the shares could have been purchased initially at very low prices so that the liquidation of the shares might not expose the company to risks of sales below the purchase price. Still, the author has substantiated worries about this behavior, based on the results of the qualitative analysis which confirmed the prevalence in the GCC countries of this aggressive behavior which focuses on the returns to be earned, rather than on the ability to meet the liabilities of the general funds. If the regulators in the GCC countries continue to regulate the industry with the current basic regulations, which neither restrict takaful companies from aggressive investment behavior nor subject them to solvency margin requirements, this behavior will continue and could eventually lead to serious problems for the industry. (Bahrain could be an exception—see note 5.)
The total combined investment portfolios of the family funds recorded an average annual growth rate of 17 percent during the four years of the study, reaching a total of US$1.2 billion at the end of 2005, compared with US$0.7 billion at the end of 2002. It should be noted that Malaysian companies have dominated these statistics, as their investment portfolios collectively represent almost 97 percent of the combined total. This was due to the fact that the family takaful business in the GCC countries is still undeveloped and the penetration rate for insurance overall, and particularly family takaful, is very low. By contrast, in Malaysia the penetration rate is high compared to the GCC countries and the level of awareness of insurance, particularly the family takaful products, is very high. As the takaful companies in the GCC countries had a negligible amount of family fund investments, a comparison between GCC and Malaysia is not feasible. Therefore, the analysis will concentrate on the Malaysian companies' family fund investment portfolios.
The top three asset classes in these funds were sukuk, investment accounts, and equities, which collectively accounted for more than 92 percent of the overall family funds portfolios during the years of the study. As shown in Table 11.5, the proportion of investments in sukuk overtook that in investment accounts during the four years of the study. While the proportions of these asset classes were quite close to each other in 2002, the difference between them grew during the years of the study, to reach 50.8 percent of the total portfolios for investments in sukuk, as against 28.2 percent for investments in investment accounts, by the end of 2005.
Table 11.5 Composition (%) of Family Fund Investment Portfolios for Malaysian Companies, 2002–05
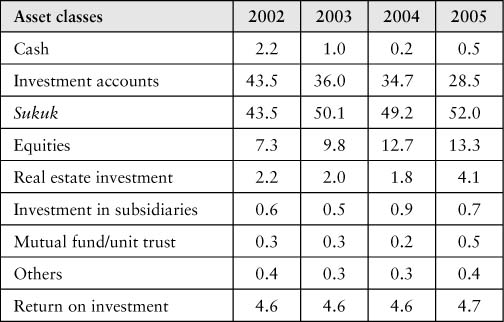
Source: An Analysis of the Investment Portfolio Composition of Takaful Undertakings in the GCC and Malaysia, PHD, Dr. Abdulrahman Tolefat, University of Durham, 2008.
This trend toward sukuk can be attributed to the nature of the family takaful policies offered by takaful companies in Malaysia. These policies comprise two elements: risk protection and savings. However, the savings element largely dominates the risk protection element in these policies, and the contributions are invested mainly in non-linked funds. As a result, the takaful companies invested the majority of these funds in sukuk to ensure a flow of fixed income for the savings policies. However, the investment accounts asset class was used for short-term investments to meet the liquidity requirements of the risk protection fund.
The takaful companies in Malaysia were using the same investment strategy as that implemented for general funds, whereby cash and investment accounts were used entirely for short-term investments, while sukuk were the main form of long-term investments followed by investments in equities. Corporate sukuk represented more than 60 percent of the total sukuk portfolio, the remainder being invested in government sukuk. Although the companies in Malaysia had a nil position of government sukuk in their shareholders' funds portfolios for reasons of cost, this type of sukuk was to be found in the family funds investment portfolios although the cost issue was still relevant. The reason for this was the regulation imposed by Bank Negara Malaysia, which requires that at least 15 percent of the total value of the assets of the takaful fund be invested in government securities. According to the survey conducted, the takaful companies in Malaysia would like to decrease the proportion of government sukuk in their investment portfolios from the current level of 20.0 percent to 18.1 percent of the total investment portfolio for the family funds, and to maintain the nil position of government sukuk in the shareholders' funds. This wish was also confirmed in interviews with a number of leaders of takaful companies in Malaysia.
The Malaysian takaful companies considered investments in sukuk as a major asset class, and the ROIs were almost stable at 4.6 percent per annum during the four years of the study.
11.7 INFLUENCE OF RELATED PARTIES ON THE INVESTMENT PORTFOLIOS OF PARTICIPANTS' FUNDS
One of the main factors affecting the investment composition of takaful companies could be the influence of related parties6 on investment decisions. The rationale behind addressing this issue is the dilemma arising from the fact that many takaful companies are controlled by Islamic banks or by groups of investors who are connected to each other. Therefore, the following question was addressed by the study: “Does the holding of ownership stakes in takaful companies by related parties affect the amounts of participants' funds that are invested in these related parties?”
The reason for choosing the participants' funds rather than the shareholders' funds is the element of conflicts of interest that can arise in the case of investment of the former funds under a takaful structure. As the takaful company is an agent, or mudarib, working on behalf of participants, the investment of participants' funds in a related party could be made in the interests of the relevant shareholders rather than those of the participants. In particular, investments in related parties could be made even though such investments were excessively risky. In contrast, the shareholders' funds do not exhibit this element of conflicts of interest, since the fact that they belong to the shareholders implies that there is in principle no incentive to place them in unsuitable investment opportunities.
In order to address the influence of related parties on investment composition, two approaches were identified in this study. The first approach was to compare statistically each takaful company level to determine the significant differences between the actual and desirable proportions invested with related parties for both the shareholders' and participants' funds. The second approach was to study the proportions of both the shareholders' and the participants' funds invested in each related party, regardless of the company. To implement the second approach, three groups of related parties were identified depending on their level of participation in a takaful company's capital. The first group includes any related party owning up to 10 percent of the company, while the second and the third groups included related parties who owned between 10 percent and 50 percent, and over 50 percent, respectively. It should be noted that, owing to the small sample size obtained in Malaysia, a comparison between the GCC countries and Malaysia cannot be achieved for this factor. Therefore, the data presented below consolidate both the GCC and the Malaysian takaful companies.
A non-parametric Wilcoxon Ranked Signed Test was used in connection with the first approach. The result indicated a significant difference between the actual and desirable proportions of participants' funds invested in related parties, at a 95 percent confidence level. The significant difference for the participants' funds indicates a high level of control exercised by the related parties over the investment of participants' funds. It was observed that in some takaful companies surveyed, and particularly those in the GCC countries, the desirable level of investment in related parties was nil, while in reality, these companies had invested substantial amounts in their related parties. The influence of related parties in the GCC countries is greater than that of those in Malaysia, owing to the basic regulations imposed by the regulators in the former countries which currently do not address the issue of related-party investments.
Figure 11.4 shows the distribution of asset classes in the participants' funds invested in the identified related parties' groups. As shown in the figure, for all related parties' groups, equities were the major asset class in which the takaful companies invested. Also, it was noted that there is a positive relationship between the percentage of the takaful company's capital held by a related party and the amount invested in the shares of the related party. In other words, the greater the participation in the share capital of a takaful company by a related party, the greater the amount invested by the management of the takaful company in the shares of that related party. This suggests that related parties use their influence to induce takaful companies' managements to invest in their shares as part of their participants' fund investment in equities. As a result, related parties may be considered to have an unfortunate influence over the investment of participants' funds.
Figure 11.4 Related parties' investment ownership groups and participants' funds
Source: An Analysis of the Investment Portfolio Composition of Takaful Undertakings in the GCC and Malaysia, PHD, Dr. Abdulrahman Tolefat, University of Durham, 2008
The analysis presented above sheds an interesting light on the investment behavior of takaful operating companies in the GCC countries and Malaysia, given the Shari'ah constraints on investment. One may note, in particular, the influences of the market environment and the regulatory environment. In the first place, family takaful is much less developed in the GCC countries than in Malaysia, which results in differences between the investment behavior of the takaful companies in the two regions. Because the sukuk market is more developed in Malaysia, the Malaysian companies invest extensively in these securities, and particularly in corporate sukuk which are cheaper for them to purchase. By 2005, 52 percent of family takaful funds in Malaysia were invested in sukuk. In contrast, the GCC companies invest substantially in equities and real estate. But even for the general takaful funds, Malaysian companies invested substantially in sukuk which represented 45 percent of the funds in 2005. By contrast, in the case of shareholders' funds they invested only about 8 percent of such funds in this asset class, preferring investment accounts and real estate. The level of investment in sukuk is partly explained by regulations requiring a certain percentage of general takaful funds to be invested in government securities. There were no similar regulations in the GCC countries, although Bahrain was introducing regulation to be implemented in 2006.
The GCC companies invested more extensively in equities. Equities represented 46.8 percent of their general funds portfolios in 2005, with 42.3 percent being placed in investment accounts. Their rates of return on general funds investments were substantially higher than those of the Malaysian companies, ranging from 6.6 percent to 27.5 percent for the GCC companies, as against between 2.9 percent and 3.7 percent for the Malaysian companies. For the GCC companies' shareholders' funds, equities also represented between 20 percent and 37 percent of the total portfolios (26.9 percent in 2005), but a greater proportion was placed in investment accounts. The GCC companies were much more highly capitalized than their Malaysian counterparts, but their rate of return on shareholders' funds investments was higher, especially in 2004 and 2005.
In general, therefore, the GCC companies achieved higher returns on investment and held more risky portfolios, but were more highly capitalized. Issues for potential regulatory concern were the levels of their investments in real estate, an illiquid and potentially volatile asset class, and the level of investments of their general funds in equities (46.8 percent in 2005), also a volatile asset class, as well as the evidence that their investment policies in equities were influenced by related parties.
Finally, it is noteworthy that there was evidence in both regions that takaful operating companies were holding relatively liquid assets in their shareholders' funds portfolios, so as to be able to provide liquidity to the takaful (underwriting) funds by means of a qard facility in case of solvency problems.
Notes
1 Although Saudi Arabia is the biggest insurance market in the GCC, it was not included in the study, for several reasons. One of these included (at the time the study was conducted) the absence of regulation of insurance, as a consequence of which all operating companies in Saudi Arabia were either unregulated or registered as offshore companies in Bahrain, or as divisions operating under existing licensed banks. Also, Oman was not included due to the non-existence of takaful companies in that country.
2 Although there were many takaful companies in Sudan, this market was excluded due to the difficulties faced in gathering the required information.
3 Bank Negara Malaysia does not impose in the regulation a mandatory requirement for takaful companies to provide qard hasan to cover a deficit in takaful funds. However, the Central Bank of Bahrain (CBB) requires takaful companies to cover a deficit in takaful funds, which is enforced in the CBB's rulebook.
4 The survey was conducted by the author as part of qualitative data collected from the surveyed takaful companies in both GCC and Malaysia.
5 Bahrain is the first country in the GCC to introduce advanced regulation for the insurance industry. In 2005, the Central Bank of Bahrain introduced a comprehensive rulebook to regulate the insurance industry with special regulations pertaining to the takaful industry. The effect of this regulation cannot be determined quantitatively as it was implemented in 2006. However, a big impact of this regulation was noted qualitatively during the researcher's meetings with the top leaders of the takaful companies in Bahrain.
6 Related party is defined here as “any entity or individual owing 10 percent or above of the overall capital of a takaful company.”