The Fukushima nuclear power plant accident
the main sequence of events
M. Fuchigami1; N. Kasahara2 1 Komatsu Ltd, Tokyo, Japan
2 The University of Tokyo, Tokyo, Japan
Abstract
This chapter starts by explaining the primary facilities for cooling boiling water reactors after shutdown. The main part of the chapter lists the sequence of events from the earthquake and tsunami, to station blackout, hydrogen explosion, and finally how personnel succeeded in keeping the multiple reactors cooled. The accident continued for about 1 week with four reactor units, Units 1 through 4, of Fukushima-1. Units 1 and 3 exploded in that order. Unit 2 did not have a hydrogen explosion; however, its core damage released the largest amount of radiation. Unit 4 then exploded with hydrogen leakage from Unit 3. The chapter also reviews preparedness of overseas nuclear plants and basics of nuclear fission for basic understanding.
2.1 Introduction
This chapter explains, primarily from a technical viewpoint, analyses of the causes and progress of the Fukushima-1 nuclear accident for 1 week starting from March 11. We start the chapter with an overview of primary facilities involved with the accident and follow it with the main part of the chapter, “overall process from earthquake to station blackout (SBO)” and “processes with each unit.” Our explanations follow the timeline. The chapter then discusses the hydrogen explosions and water injection to the spent fuel pools. We then close the chapter with a technical evaluation of the possibility of avoiding the accident and supplemental basic material for better understanding of this accident.
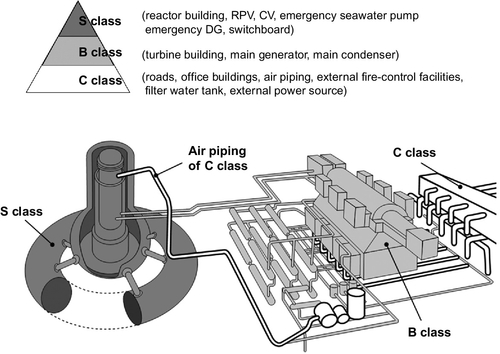
2.2 Outline of primary facilities at the Fukushima plant
2.2.1 Reactor building facilities and components
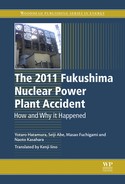
Figure 2.1 shows the cross section of the reactor building and the turbine building. The reactor building housed the nuclear reactor and had five floors and a basement. The building reached about 45 m above ground and contained the reactor pressure vessel (RPV), containment vessel (CV), spent fuel pool (SFP), and other equipment. Many of the pumps for emergency cooling systems were located in the basement of this building. The cooling facilities for Unit 1 isolation condensers (ICs), in contrast, were on the fourth floor, higher than the RPV because the IC operated with natural convection. The safety relief valves (SRVs) were within the CV, whereas the vent valves were outside it. The turbine building contained the turbine generator, main condenser, and most of the electrical power supply facilities. The turbine building basement housed six of the eight emergency diesel generators (D/Gs) for Units 1 through 4. They were destroyed with this accident. Most of the switchboards were on the first and basement floors. It is well known that the direct cause for worsening the accident was the submergence of these switchboards under the tsunami waves. We will briefly discuss each primary facility that played a role in this accident. Each facility is described in normal state except when otherwise noted to discuss the behavior during the accident.
Drywell (D/W)
The D/W, shaped like an inverted lightbulb, and the suppression chamber (S/C), compose the CV. The D/W and S/C are connected with eight thick vent pipes. When gas travels to the S/C from the D/W, it bubbles up in the S/C pool. The name drywell comes from the absence of water in contrast to the S/C, also called the wet well.
Suppression chamber (S/C)
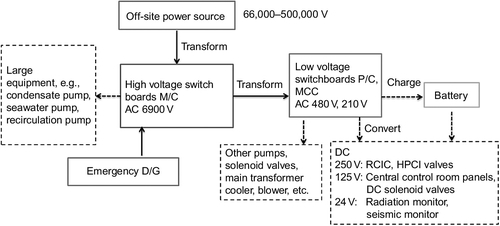
The S/C is the toroidal vessel that makes the lower part of CV. The Unit 1 S/C contains as much as 1,750 tons of water and those of Units 2 through 4, 2,980 tons. After accidents like a pipe rupture or SRV activation, high-temperature steam discharges into the S/C, and the cooled steam condenses to water to control the CV pressure from rising (Figure 2.2). S/C is also called the pressure S/C. The chamber also supplies water to emergency systems like reactor core isolation cooling system (RCIC) or high-pressure coolant injection system (HPCI) and is also called the wet well or torus.

Safety relief valve (SRV)
Safety relief valves activate to reduce the RPV pressure when it exceeds the allowable value (see Section 2.11.3 for details). Each reactor has eight SRVs (four in the case of Unit 1), which share a number of functions among them.
Vent valve
Vent valves open to vent the steam inside the CV to the outside in case of excessive CV pressure during a severe accident. The vent line has two different types of valves that both had to open for venting.
Diesel-driven fire pump (D/DFP)
D/DFP are fire pumps driven by diesel engines. Each reactor has one unit to back up the electrically driven fire pump.
2.2.2 Electrical power facilities
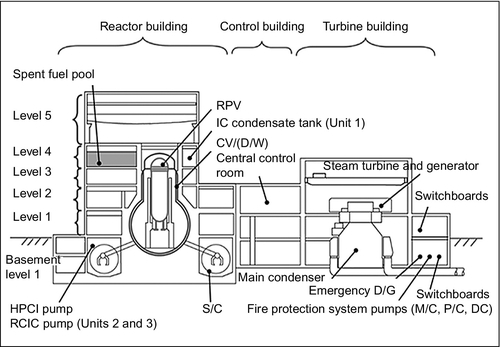
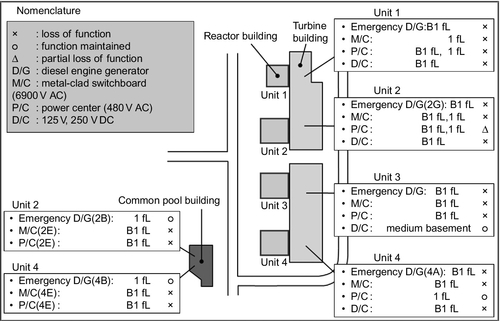
A nuclear power plant during normal operation uses the electricity it generates itself; however, when the generation stops, it uses external power sources. If the external power sources are unavailable as well, it will rely on emergency diesel power generators. Figure 2.3 shows the Fukushima-1 NPP electricity system.
Metal-clad (M/C) switch gear
This is a switchboard for high voltage of 6900 V. The power drives large-size equipment like the seawater pumps and condensate pumps. M/C, as Figure 2.3 shows, is the primary equipment of the electrical power systems.
Power center (P/C)
P/C is the switchboard for distributing AC low-power voltage of 480 V. Many machines throughout a power plant are driven with power from this switchboard.
Direct current (D/C)
D/C systems transform the AC power from the P/C to D/C and charge batteries as needed. D/C supplies power for control and instrumentation and driving D/C motor-operated (M/O) valves and is the most important power source for power plants. D/C, backed up by batteries, was believed to have low risk in its loss; however, this accident destroyed many of them. There are three types of D/C: 250, 125, and 24 V.
2.2.3 Cooling systems
Systems to cool the core of a nuclear power plant apply to statuses from “normal operation with power generation” to “severe accidents that may lead to core damage.” Their functions are most important when the reactor is stopped, either for scheduled maintenance or unexpectedly in the case of an accident. Figure 2.4 shows all the nuclear reactor cooling systems. Fundamental knowledge about these systems is important in understanding the progress of the accident described in the remainder of this chapter. Next we will explain the minimum knowledge necessary for that purpose.

Core cooling systems during normal operation
Steam with high temperature and high pressure from the nuclear reactor turns the turbine, is routed to the main condenser, and returns to the reactor as water. Nuclear fission in the reactor core during normal operation generates a large amount of heat. About one-third of the heat turns into electricity, and the main condenser has to remove the remaining two-thirds so it has a large cooling capacity. The heat is then removed at the heat exchanger and discarded into the sea.
Core cooling systems during normal shutdown (including after emergency shutdown [SCRAM])
Nuclear fission stops after normal shutdown for periodic maintenance or emergency shutdown following causes like an earthquake. The core, however, continues to generate decay heat. Without cooling, the reactor has no place to discard its heat, so the residual heat removal system (RHR), although with a capacity smaller than the main condenser, starts running to cool the core.
Emergency cooling systems
Normal shutdown is a condition of normal operation. SCRAM that might be caused by an earthquake is also a normal operation designed to take place in such emergency situations. For preparation against abnormal emergency events like RHR inoperability, which was experienced with this earthquake, or loss of coolant accident (LOCA) (see Remarks) from a piping failure, the reactor is equipped with a number of emergency cooling systems. Some may require electricity for their operation, but others like isolation condenser (IC) with Unit 1 and RCIC with Units 2-4 work without electrical power. High-pressure systems can inject water even when the reactor is at high normal operation pressure of about 7 MPa, whereas the lower pressure systems can only do so when the reactor pressure is at 1 MPa or less. These emergency cooling systems offer a variety to counter various situations.
Isolation condenser (IC)
lC is a condenser for the emergency situation of core isolation. This type of core cooling system was only present with Unit 1. It operates even with high reactor core pressure with natural convection without any power sources (Figure 2.5). The system can withstand an extended operation by supplying cooling water to the condensate tank.
Reactor core isolation cooling system (RCIC)
Units 2–4, instead of IC, have high-pressure isolation core cooling systems. Steam from the reactor core drives a turbine to turn a pump; thus it operates even under loss of AC power. It is designed to run for about 8 h. Its start-up and control requires D/C power, and Unit 2, which lost D/C power with this accident, had no control over RCIC.
High-pressure coolant injection system (HPCI)
HPCI is an emergency cooling system present with all units. This system injects water into the reactor core even when it is at high pressure. Similar to RCIC, the steam in the RPV drives the system. It has a large water injection rate giving it the position of the most powerful cooling system to counter severe accidents like LOCA. During this accident, only the system in Unit 3 worked.
Fire protection
Fire systems for nuclear reactors are prepared to provide core cooling if necessary. The system can only inject water when the reactor is at about 0.5 MPa; thus the reactor pressure has to be lowered before the system can operate. During this accident, however, almost all fire pumps within the turbine buildings were inoperable, and fire engines injected water from outside the turbine buildings through water injection inlets on the outer walls to cool the reactor core.
2.3 The sequence of events from earthquake and tsunami to station blackout (SBO)
2.3.1 Events immediately after the earthquake
March 11, 2011, about 14:46: magnitude 6-strong earthquake hits
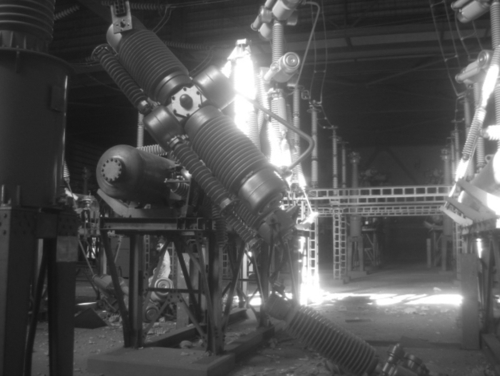
When the earthquake hit, Units 1 through 3 were in normal operation, and 4 through 6 were in scheduled shutdown. Upon the earthquake attack, Units 1 through 3 automatically SCRAMed, and the operators switched the electric power to the site to an external power source. Almost at the same time of the switching, external power was lost (Figures 2.6 and 2.7), and the emergency D/Gs (Figure 2.8) kicked in automatically. As part of the fail-sale function, the main steam isolation valves (MSIVs, valves to close the main steam line to the steam turbine) automatically closed. The series of processes following the SCRAM proceeded normally.


March 11, about 14:50: Unit 2 RCIC started manually
With the SCRAM, the feedwater pump for Unit 2 stopped, and following the manual, the operator manually started the RCIC with remote operation (turning the switch in the central control room). The RCIC, however, after about a minute of running, automatically stopped because it detected a high water level in the nuclear reactor. The high water level was due to the injection capacity of 95 ton/h with the RCIC, which had started injecting water from the external condensate storage tank to the RPV. Eleven minutes later, the operator restarted the RCIC remotely with his eyes on the reactor water level.
March 11, 2011, 14:52: Unit 1 IC started automatically
The MSIV closure with Unit 1 resulted in a reactor pressure rise, which triggered the IC to automatically start. At about 15:03, however, the operator, worried about the rapid reactor temperature drop (see Remarks), remotely stopped the IC. From that time until 15:30, the operator started and stopped the IC three times, controlling the reactor pressure at 6-7 MPa.
March 11, 15:05: Unit 3 RCIC started manually
In the same manner as with Unit 2 the operator started the Unit 3 RCIC remotely. At about 15:25, however, on detecting high reactor water level, the RCIC stopped automatically. At this time, the reactor pressure values with Units 2 and 3 were too high, and the pressure relief functions of the SRVs had already started to discharge RPV steam into the S/C.
March 11, about 15:27: first tsunami wave
The first tsunami wave arrived; however, it was low enough to not cause damage that led to the SBO.
March 11, about 15:35: second tsunami wave
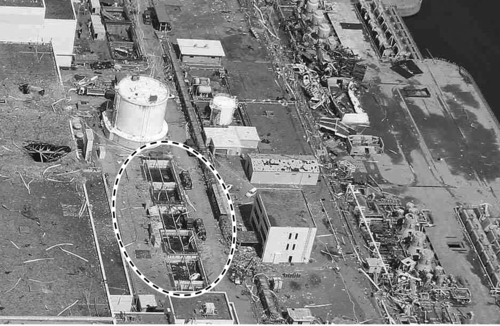
The second tsunami wave reached the coast. The inundation height reached 11.5-15 m and even 17 m at some places. First, the seawater pumps for emergency D/Gs, located near the coastline at an elevation of 4 m above sea level, suffered water damage (Figure 2.9). The details of the damage are unknown, but they lost all functions.
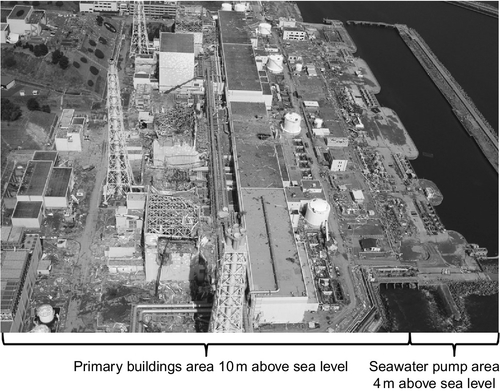
The plant main area with the reactor building and turbine building was at 10 m above sea level; thus, they suffered a maximum inundation of 7 m. The water entered the buildings through doors and air ventilation holes, and most facilities in the basement of the turbine building, including the switchboards, were submerged. This wave caused the loss of almost all electric power sources and was the starting point of this severe accident. The plant response headquarters were set inside the seismic isolation building in a room with no windows and no cameras to look outside; thus, for a time after the SBO, headquarters staff could not tell that the problems were caused by the tsunami.
One report after another reached headquarters with the news of loss of AC power with all units and even DC power with Units 1, 2, and 4. Headquarters staff was stunned by the scope of a catastrophe beyond any imagined scenarios. The plant manager realized that the situation was beyond any hypothesized severe accidents, but could not decide what immediate action to take. He thus followed regulations and reported the SBO to the ministers and agents.
The states of water submergence were about the same for Units 1 through 3; seawater entered the turbine buildings from the equipment hatch and ventilation holes to flood the basement and the concourse floor between the basement and first floor of the turbine, control, and reactor buildings. The basement of the turbine buildings contained the emergency generators and the regular and emergency switchboards; the control building basements contained the DC power systems (Units 1, 2, and 4); and the reactor building basements were where the pumps and other equipment for the emergency cooling systems of RCIC and HPCI were staged (Figure 2.10).
When the seawater pumps fail, the nuclear reactor loses its heat sink (where to dump excessive heat) to the ocean. The Unit 1 IC was designed to release steam to the atmosphere. Units 2 and 3 with RCIC could transfer the heat to the S/C; however, they had lost their ultimate heat sinks. The Unit 1 IC also failed to function; thus, all units that were up and running at the time of the accident had lost their ultimate heat sinks other than venting the CV to release the heat into the atmosphere.
March 11, about 15:39: Unit 2 RCIC started manually just before the tsunami damage
At about this time, an operator opened the Unit 2 RCIC valves remotely. This action was immediately followed by the SBO. If the opening had been delayed by seconds, the Unit 2 RCIC would have been lost (see Remarks), and situations with Unit 2 would probably have been worse than the actual trace of events. The runaway Unit 2 RCIC kept running for about 3 days.
March 11, 15:37-42: loss of all AC power
Except for the Unit 6 air-cooled emergency D/G (6B), all AC power sources for Units 1 through 6 were lost. Units 1 and 2 lost their DC power as well. Unit 3 had its DC power on the concourse level between the basement and first floor. The unit was covered with water, but managed to retain its function; Unit 3 allowed operation of its RCIC and HPCI for a few days.
2.3.2 Loss of electrical power
Each of Units 1 through 4 had two sets of emergency D/Gs making the total count eight. The B-system of Unit 2 and B-system of Unit 4, added in 1999 to enhance plant safety, were located on the first floor of the common spent fuel pool building at 10 m above sea level. All the other six were in the basements of the turbine buildings.
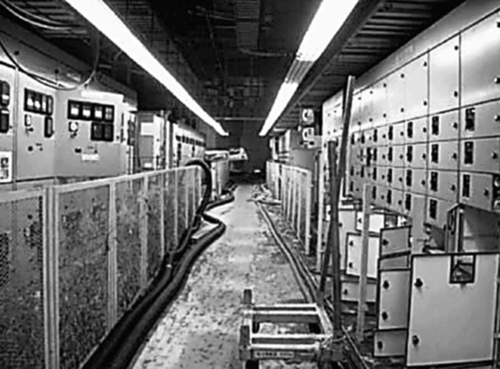
The two D/Gs in the common pool building were covered with water; however, they were not submerged and survived the flooding. These two were air cooled; thus, they were not affected by the failure of destroyed seawater pumps near the coast. The fatal problem was not the loss of D/Gs themselves; it was the sub-mergence and loss of the switchboards (Figure 2.11). The two emergency D/G systems in the common pool building had D/Gs on the first floors, but their switchboards were in the basement. The two, thus, similar to the other six D/G systems, lost their functions, and Units 1 through 4 lost all their AC power.
The scenario of SBO is often described as “the earthquake destroyed the external power source, and then the tsunami submerged the emergency D/G to cause the total loss of AC power”; however, this description is wrong. Among the switchboards of Units 1-4, all M/C switchboards and most of the P/C switchboards were submerged and had lost their functions. For this reason, even if the external power had reached the entrance of the plant switchyard, the state of loss of all AC power during the initial stage of the accident would probably have been the same. Unit 6, in contrast, had one emergency D/G available, and its M/C was functional. Furthermore, it could spare the electricity to Unit 5, and these two, Units 5 and 6, did not have to face SBO. The definite difference with Units 1 through 4 was not the emergency D/G but the high-voltage M/C switchboard.
The electric systems were designed so that the Units 1 and 2 pair and the 3 and 4 pair could spare electricity for each other. Therefore, if the switchboards were available, the two emergency generators that survived the tsunami attack could most probably have supplied the minimum flow of electricity to prevent severe core damage.
2.4 Possible damage caused by the earthquake
2.4.1 Primary facilities in the reactor building
The Investigation Committee Report (Interim [1] and Final [2] Reports by the Investigation Committee on the Accident at Fukushima Nuclear Power Stations of the Tokyo Electric Power Company [TEPCO]) questioned the possibility of earthquake-induced “damage to affect the containing function” during the 50 some minutes from earthquake to SBO. The relevant facilities are shown in Table 2.1, i.e., RPV and its attachments, CV and its attachments, IC and its piping, RCIC, and HPCI (Unit 3 only). The report also confirms that for Units 1 and 2, “HPCIs have low possibility of suffering damage to lose their water injection functions.” Table 2.1 summarizes these evaluations.
Table 2.1
Findings of earthquake-induced damage to primary facilities
| Facility | Unit | Findings |
| RPV | 1-3 |
(2) Instrumentation piping feed-through and their connection to RPV (3) SRV flange gasket and other attachments to RPV have no possibility of damage to affect the containing functions |
| CV | 1-3 |
(2) CV flange, electrical wire feed-through, equipment hatches, personnel airlocks, instrumentation piping and their attachment had no trace of damage to largely affect the containing functions |
| IC | 1 | Could not find traces of breakage in piping and condensate tank to have impaired the IC function |
| RCIC | 2, 3 | Possibility was denied for severe damage to have impaired water injection function |
| HPCI | 1, 2 | Possibility of damage to have impaired the water injection function was low |
| 3 | Possibility was denied about damage to affect the water injection function |

The “possibility” the Investigation Committee denied was “damages that disabled the containing functions,” in other words, “damages with openings of significant size.” This denial does not mean there were no smaller cracks. There remains the possibility that “small cracks caused by the earthquake might have widened later with the SBO.” It is another fact, nevertheless, that traces of such sequences have not been identified with the equipment either.
The main reasons for claiming that there was no serious earthquake-induced damage to the primary facilities follow (e.g., for Unit 1):
(i) RPV
Figures 2.12 and 2.13, respectively, show the traces of Unit 1 RPV water level and pressure from before the SCRAM to SBO. Transitions in these charts support the sequence of SCRAM → MSIV closure → IC start → IC stop. If the RPV or piping that penetrated it (e.g., IC piping) had large cracks, the charts would have shown a rapid drop in water level or pressure. We could not find such traces. Also, signals of LOCA (trips on large loss of cooling water) to trigger HPCI, emergency D/G, or core spray systems could not be found either.
Furthermore, later at 20:07 on March 11th, the RPV recorded pressure of 6.9 MPa. This value in the normal range over 5 h after the earthquake backs the low possibility of earthquake-induced RPV damage that impaired its containing function. The pressure records were directly read by a worker from a mechanical gauge on the second floor of the reactor building and thus were judged to be highly reliable with hardly any reasons for misreading.
Moreover, the Containment Atmospheric Monitoring System (CAMS) marked the lowest level of radiation up to the point of SBO for both the D/W and S/C, and there were no signs of leakage to the CV.
All the preceding records show that the RPV maintained its containing function up to the point of SBO.


(ii) CV
Records of D/W pressure and temperature, S/C pressure, and water temperature all show no sign of CV damage to largely impair the CV containment function before the tsunami attack.
In addition, during this time period, the standby gas treatment system (SGTS; see Remarks) operated to exhaust the reactor building air from the exhaust tower; however, the exhaust tower radiation monitor did not record a significant rise in radiation. This fact also supports that there was no significant radiation leakage from the CV to the reactor building, thus, the CV’s containing function was intact.
So far we have explained that Unit 1, and Units 2 and 3 (although with the difference of IC and RCIC), for similar reasons, did not receive possible large damage caused by the earthquake to the primary facilities of RPV, CV, RCIC, HPCI, and their attachments to impair the containing function.
2.4.2 Other facilities
Starting with Unit 1, the accident response repeatedly had to face the lack of compressed air. If the AC power was available, the stationary compressors could have provided that function, but they were unavailable with this accident.
All the vent operations required compressed air; however, the air bottles stored in the buildings were not sufficient, and the workers had to rely on portable compressors or borrow them from contractors of Fukushima-2. All these compressors gathered for the urgent situation, however, did not have sufficient capacities, which caused delays in the vent operations. In case of Unit 2, the venting, after all, most likely had failed. Whether the failure was due only to the capacity of compressors or if there were leakages from the compressed air piping is still unclear. In any case, we have identified a problem that seismic class S venting facilities required seismic class C air piping (Figure 2.14).
The fire protection systems piping outside the buildings were also only classified as Class C. During this accident, workers connected fire engine hoses directly to the turbine building water inlet; however, the original accident management (AM) response (see Remarks) had specified to use the filtered water tank as the source. The distance from the filtered water tank to the primary facilities was over 500 m, and after the earthquake, some fireplugs were seen shooting out water. Plant manager Yoshida stated that he thought “diesel-driven fire pumps (D/DFP) relying on filtered water tank as a water source was unreliable.”[8].
The auxiliary facilities, if they are needed at times of severe accidents, need reevaluation of their seismic classification. The reevaluation should look at severe accidents caused by external events like earthquakes and also tsunami attacks, mudslides, airplane crashes, and terrorism attacks with discussion on the overall response of the plant.
2.5 The condition of Unit 1 after SBO
2.5.1 March 11, up to 23:50 when abnormal CV pressure was recognized
March 11, about 15:37: IC isolation valves closed with fail-safe function
Unit 1 lost all its electrical power including DC. The central control room was pitch dark, and the loss of DC power stopped displays of all instruments. The most critical reactor water level and pressure became unknown.
The isolation condenser (IC) was in normal operation with the operator turning it on and off. The loss of DC power, however, caused the fail-safe logic to send “close” signals to all four valves. High-temperature steam from the reactor stopped feeding to the IC to be condensed into water to run back to the reactor. The cooling function of the IC was almost completely lost. The Unit 1 IC was designed that on failure (an abnormal condition), all flows were stopped to prevent possible radioactivity leakage and to contain the pressure vessel. This concept, however, had the contradiction that shutting off the IC cooling function could lead to a more dangerous situation.
Around this time, Plant Manager Yoshida was not sure whether the Unit 1 IC and Units 2 and 3 RCIC were properly operating, but at the same time was not aware of the Unit 1 IC stoppage with the fail-safe function.
Unit 1 lost both the DC for control and AC for driving power, and when the “valve close” signals were sent, the driving power to make those actions (480 Vac for the two valves inside the CV and 125 Vdc for the two outside) were also lost. Thus, whether the valves actually closed or stopped midway is unclear. The fact of rise in radioactivity recorded only 2 h after the SBO at about 18:00, and other evidences confirm that the IC was not functioning after the SBO (see Section 2.5.3 for details).
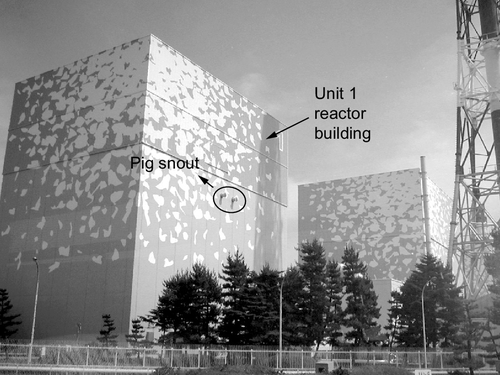
Another root cause for failing to recognize the IC stoppage, in addition to the preceding design problem, was the lack of education and training for the hypothetical situation of loss of DC power. Furthermore, for this March 11 accident and the hours that followed, none of the people that were responding to the accident, in the plant response headquarters, main office response headquarters, Nuclear and Industrial Safety Agency (NISA), or Nuclear Safety Commission (NSC), recognized the IC stoppage. One of the reasons why the operator on duty did not recognize the fact was because no one had ever experienced the IC in operation. The best knowledge that anyone had was having heard from former operators that when IC was in operation, steam from the condenser cooling water would blow out horizontally from the exhaust openings (the so-called pig snout) to produce lightning-like static and large thunder-like sounds (Figures 2.15 and 2.16). The reason why no one had experience of the event was because Unit 1 was the oldest among those with MARK-I containment. There was only one other reactor, Tsuruga-1 of The Japan Atomic Power Company (JAPC), that had adopted IC for its cooling system in the event of reactor core isolation.

The Unit 1 operator was puzzled by the small amount of steam from the IC condenser, but did not have a good understanding of the situation. He thus switched Valve 3A from “Open” to “Close” and “Open” again three times between 18:00 and past 21:00. Because the three valves other than 3A remained (almost) shut due to the fail-safe function, operating Valve 3A was meaningless. As a result, Unit 1 was in an abnormal situation with no water injected into the core until water injection from a fire engine started at 4:00 the next morning. This is how the core melting progressed rapidly with Unit 1, for which water injection had stopped at only 1 h after its SCRAM when the decay heat was still high.
March 11, 16:42: drop in water level detected
At about this time, operators recognized that the indicator of the wide range water level monitor (one of the three types of reactor water level monitors) was working, but the reason for this sudden recovery remains unknown. The indicator at first was pointing at “−900 mm,” and 14 min later after showing “−1500 mm,” it went off scale. During this time period, the water level monitor was probably working normally, and the plant response headquarters, given information about the rapid drop in water level, estimated the time for the water level to drop to top of active fuel (TAF) to be an hour; however, in the midst of all confusion, headquarters did not recognize the IC stoppage.
March 11, 17:12: use of water injection from fire engines evaluated
Under SBO, the AM procedure designates the only alternative method for water injection other than IC to be D/DFP driven water injection. The water source in that case was the “filtered water tank (see Remarks 1).” Plant Manager Yoshida was worried about piping from the filtered water tank to the reactor building. He then ordered evaluation of water injection from a fire engine, although it was not prepared as an AM procedure. On March 12th and later, this water injection from fire engines turned out to be the lifeline. At this time there were three fire engines on-site; however, one was unusable with damage from the tsunami, and another was parked near Unit 6, with its way to Unit 1 blocked by tsunami rubble. That left only one engine available for the purpose (see Remarks 2). To make things worse, alternative water injection with a fire engine was not written in the AM procedure, and no team was assigned to take responsibility for the action. The plant manager had given orders but no progress was made until before dawn on the next day, March 12th.
March 11, 17:30: doubts about the operation of IC
Some operators on duty in the central control room had doubts about the operation of IC. In preparation for alternative water injection, the operator checked the D/DFP start-up and put it on standby. Later, at 20:50, he started the D/DFP engine to prepare for the change of situation.
Later in the afternoon, four 6 V batteries from a neighboring company and two 12 V batteries from large buses arrived. They were hooked up to the back of the control panel in the central control room to start monitoring water levels of Units 1 and 2.
March 11, 17:50: first abnormal radioactivity detected
A worker approached the reactor building to check the water level of the IC condensate tank; however, near the double door (see Remarks), radiation dosage read as high as 2.5 μSv/h, and he had to retreat. This high-dose reading was much smaller compared to later large readings. However, it was out of normal range, and probably at this time, part of the fuel was exposed above the top of cooling water.
March 11, 18:18: IC valves 2A and 3A closed
In the central control room, the operators realized the IC lamps that had been off were illuminated showing “Valve 2A and 3A Closed.” At this time the operator on duty thought that all IC valves might be closed with the fail-safe function, but hoping they were not, he remotely opened valves 2A and 3A. He then reported to the response headquarters about the opening. The operator left the central control room to visually check the steam ejection from the reactor building. The operator only saw a small amount of steam at first, and then no more steam followed the initial exhaust.
March 11, 18:25: IC valve 3A remotely closed
Seeing the small amount of steam from the IC, the operator who had doubts about the IC function began to worry that “steam not blowing out from the IC may be a sign of low condenser cooling water level, and keep running the IC may cause damage to the IC piping,” [9,10] and at 18:25 he remotely closed Valve 3A. This operation, however, was not reported to the response headquarters.
March 11, 20:07: RPV pressure acknowledged
A worker entered the reactor building and found the RPV pressure at 6.9 MPa. Around this time, the SRV might had been open with its safety function because the Unit 1 SRVs were set to open at 7.7 MPa and remain open until the RPV pressure drops to about 6.9 MPa. Up to this time, however, workers were allowed in the torus in the basement of the reactor building; thus, a large amount of radioactivity release through the SRVs to the S/C had been unlikely. Within the reactor, therefore, a certain amount of fuel damage at the time cannot be denied; however, it is natural to assume that the core had not reached significant core damage to release a large amount of radioactivity.
March 11, 21:19: water level gauges started to give misreadings
The water level gauge again read “TAF + 450 mm.” The water level at this time, however, was unlikely to be above the TAF, so it is most likely that from this point on the water level reading was wrong.
March 11, 21:30: IC reopened
At around this time the operator on duty recognized that the IC Valve 3A indicator lamp showing the green “closed” status was about to go off. The operator was concerned about the risk of being unable to restart the IC due to battery drain. In addition, by this time he had learned that the condenser cooling water would not run out with several hours of operation and reasoned that the small amount of steam from the “pig snout” was not due to the drop of water level in the condensate tank. Although the operator thought that probably the fail-safe function had closed the valves, he also thought there still was a chance of activating the IC and so turned the Valve 3A switch to open. Upon this action, sound of steam release was heard for a while, but then again it faded away. The operator believed that IC was not operating and reported that he had opened Valve 3A to the response headquarters. The response headquarters, not aware of the “close” operation at 18:25, could have found the report puzzling, but no one did.
March 11, 21:51: apparent rise in the radiation dosage
A rise in the dosage led to an order to ban entry into the reactor building.
March 11, 22:00: wrong water level information
Water level measurement gave a value of TAF + 550 mm. This report was a sign of worsening misreading of rising water level despite no reason for the water level to rise.
March 11, about 22:30: large increase in the radiation dosage
An operator on duty tried to enter the reactor building, but in front of the double door, his pocket dosimeter indicated 0.8 mSv within about 10 s, and sensing the risk, he returned to the central control room. This reading was equivalent to as high as about 300 mSv an hour. For information, the standard safe exposure for a person throughout his life is about one-third of this value at 100 mSv.
March 11, 23:50: IC problem finally recognized
The staff measured the D/W pressure using a portable generator from a contractor in the central control room. The reading was extremely high at 0.60 MPa. Plant Manager Yoshida, on hearing this report, finally recognized that the IC was not properly working and that the steam that had leaked into the CV D/W from the RPV had produced the abnormal rise in D/W pressure.
The reason for this D/W pressure rise could have been caused by hydrogen and rare gas, which do not condense to water, discharged into the S/C from the RPV, and with other gas then entered the D/W; however, there was also the possibility of damage on the pressure vessel to let gas escape into the CV.
2.5.2 Further progress
March 12, about 00:06: first order to prepare for venting
Plant Manager Yoshida, upon receiving the report of D/W pressure at an abnormally high value of 0.6 MPa, realized that the IC was not working. With the possibility of even higher pressure, without hesitation, he ordered the power generation team and recovery team of the response headquarters to prepare Unit 1 for venting. At the same time, he ordered to prepare Unit 2 for venting as well in case of worst-case scenario.
March 12, around 01:30: all parties agreed to the venting
At the main office response headquarters, President Shimizu had agreed to the venting of Units 1 and 2. TEPCO also requested approval for the operation from the Prime Minister’s Office and NISA and soon received approval from Prime Minister Kan and others.
March 12, 01:48: D/DFP stoppage and evaluation of the alternative fire engine
D/DFP of Unit 1 was running from the day before in preparation for its use; however, it was found to have stopped by this time. The reason for the stoppage is still unknown. The response headquarters reasoned that the only alternative left was to use a fire engine to inject water and started to evaluate that procedure. Water injection to the reactor with a fire engine was a procedure never evaluated before and, thus, faced a number of difficulties. First, none of the TEPCO employees knew how to operate a fire engine. TEPCO had to request a contractor on-site to perform the work, which was outside their contract. The response headquarters did not know where the inlet for injecting water into the reactor was, and extra time was needed to locate a contractor employee with such knowledge. Furthermore, the only nearby water supply was the fire reservoir, which had insufficient water for extended water injection.
March 12, about 02:30: sudden rise of D/W pressure
The D/W pressure was reported to be at 0.84 MPa (abs). Most persons involved would have thought that such a high pressure could cause explosive damage to the CV.
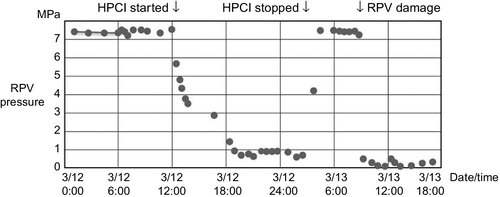
March 12, 02:45: sudden RPV pressure drop
At about this time, the RPV pressure was measured at 0.8 MPa. That was a large drop from 6.9 MPa, measured about 7 h earlier at 20:07 on the previous day (Figure 2.17). No depressurization was made with SRVs during this time, and without doubt, there was a large leakage from the pressure vessel (see Remarks). The rise in the D/W pressure to about the same 0.84 MPa backs this conjecture.

March 12, 03:06: press conference about the venting
The Minister of Economy, Trade and Industry, Banri Kaieda, and a TEPCO Executive, Akio Komori, held a press conference to announce the plan to vent. Up to this point, the response headquarters had erroneous optimistic information about the situation with Unit 1 due to misunderstanding the IC status and misreading of the water level monitor. On the other hand, until about after 02:00 on March 12th, because of not knowing the RCIC operation and having no water level reading, officials had thought that Unit 2 was the reactor in most danger. Immediately before this press conference, the government received the news that Unit 2 had its RCIC running, and its water level and pressure were stable. Executive Komori took the stand in the press conference without hearing the news, and when asked, “Which is the first unit to vent?” he gave a confusing reply.
March 12, after 04:00: freshwater injection started
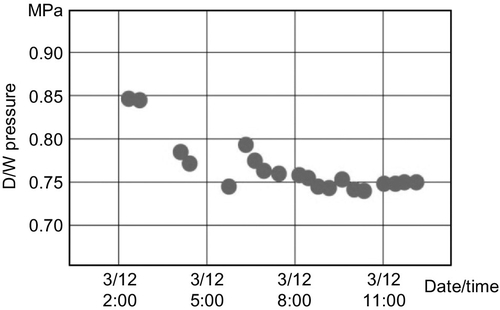
Started to inject freshwater using a fire engine. The water was first supplied from the fire engine tank and then collected from the fire reservoir and poured into the fire engine tank. This intermittent injection amounted to only 1-2 ton every several tens of minutes. At this time, as shown in Figure 2.18, the D/W pressure was going down. Because D/W cooling (D/W spray), S/C cooling (S/C spray), nor venting were not made, the only reason for this pressure drop was leakage from the CV.
March 12, about 04:23: rise in radiation dosage
The radiation dosage at the monitoring post near the main gate (Main Gate MP) rapidly rose to 0.59 μSv/h and to about 1.8 μSv/h at around 05:20 (the reading was around normal at about 0.069 μSv/h at 04:00). Also the central control room for Units 1 and 2 was located on the second floor of the control building between the two units. The dose reading there was high at around 05:00. In addition, the dose measurement was higher where closer to Unit 1. The operators moved toward the Unit 2 side and waited. It was a sign of serious core damage in the Unit 1 reactor located at an elevation higher than the central control room.
March 12, 06:50: concern about not completing the vent
The Minister of Economy, Trade and Industry Kaieda ordered a vent in accordance with regulations. Around this time, the authorities in Tokyo expressed concern about the progress of the vent, and some even speculated that the operators were hesitating in the task. The reality was that a number of difficulties occurred in performing the vent.
March 12, 07:11: Prime Minister Kan’s visit to the site
Prime Minister Kan and NSC Chair Haruki Madarame arrived at the scene. Vice President of TEPCO Sakae Mutoh and Plant Manager Yoshida alone from the plant greeted them and explained that they intended to perform the vent at around 09:00.
March 12, 9:15: preparation for opening the vent line
At about this time, a worker went into the second floor of the reactor building and opened the motor-driven vent valve by about 25%. This work, as we described earlier, was necessary to open the vent line.
The radiation level on the second floor of the reactor building at this time was not so high, and a worker could reach there to manually open the valve by turning its handle (Figure 2.19). Then, however, the other air-operated (A/O) vent valve needed compressed air, and insufficient air further delayed the process. In all, it took another 5 h to succeed with the vent.

March 12, about 09:24: opening of the vent line further delayed
At about this time, an operator headed toward the basement of the reactor building to manually open the A/O valve (small). The basement floor at the time, however, had a high radiation level, and the worker had to retreat to the central control room.
March 12, about 10:17: misconception of vent success
The operator gave up the manual operation and tried to remotely open it from the central control room. He hoped that compressed air in the instrument air system (IA, see Remarks) piping might open the vent valve (A/O small valve). After this trial at about 10:40, the response headquarters received a report of radiation increase at the main gate and monitoring post and thought that the vent had succeeded; however, at around 11:15, the radiation level went down again, and headquarters had to correct this earlier conclusion.
March 12, about 12:00: decision made to switch to seawater
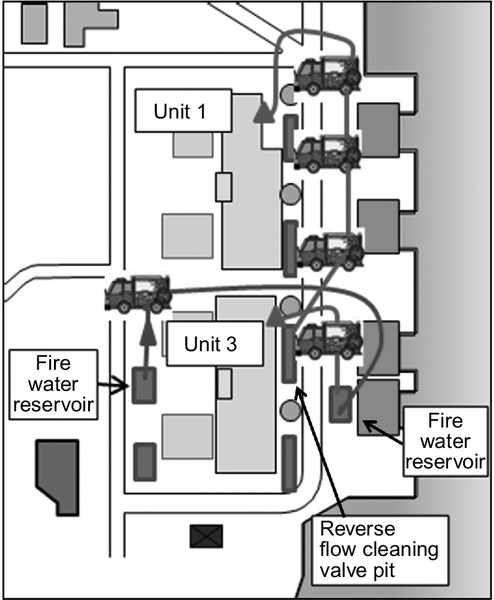
At about this time, Plant Manager Yoshida decided to switch to seawater in case the freshwater was used up, and he ordered the building of a seawater injection line with hoses. TEPCO employees and contractors searched for accessible seawater near the buildings. They soon spotted a large amount of seawater in the reverse flow cleaning valve pit (see Remarks; Figure 2.20).
At about this time, TEPCO staff, including VP Mutoh and NSC chief Madarame understood that the seawater injection process was the only choice and had no opposition to it.
March 12, about 12:30: vent preparation completed
Around this time, the workers finally obtained a portable air compressor from a contractor. It was needed to open A/O valves. This compressor, however, had a small capacity and had to be set close to the A/O valve and in an area with relatively low radiation. After evaluation, they decided to set it near the reactor building large equipment hatch. The operation, however, took efforts for not having prepared the adaptor and other reasons, but around 14:00, the connection was complete, and the compressor was ready to supply air. The process of opening the A/O valve required opening the solenoid valve on the air piping as well. The central control room, therefore, after starting up the portable compressor, applied AC current from the small generator for the temporary lamps to energize the solenoid.
March 12, 14:50: venting judged to have succeeded
With all the aforementioned work, the D/W pressure dropped to 0.58 from 0.75 MPa, and the image on the TV showed white smoke coming from the exhaust tower. Plant Manager Yoshida judged that the “vent was successful back at about 14:30” and forwarded the information to Ministries and Agents at 15:18.
March 12, 14:53: preparing for seawater injection
At about this time, the freshwater in the fire reservoir was used up, and there was no alternative source of freshwater at hand then. Plant Manager Yoshida thus ordered to inject seawater, and the line construction was almost complete at about 15:30.
March 12, 15:36: hydrogen explosion
Unit 1 had a hydrogen explosion, and five workers in the field were injured (Figure 2.21). For a while, the effect of the explosion had to be evaluated, and until safety was confirmed, the recovery work had to be put on hold. The new seawater injection line was damaged and could not be used.

The three fire engines luckily were found operable. The explosion, however, forced the team to restart the electricity recovery work, which had almost been complete, from scratch. Plant Manager Yoshida was greatly disappointed at the setback caused the hydrogen explosion. The workers at the time had to take cover in the Seismic Isolated Building.
March 12, about 17:20: discussion about the effects of seawater injection
After checking the damage, the field restarted work for seawater injection. At about the same time in the Prime Minister’s Office, Prime Minister Kan, Assistant Goshi Hosono, NSC Chief Haruki Madarame, Assistant Manager Eiji Hiraoka, and TEPCO Fellow Ichiro Takekuro had gathered in the prime minister’s office. When Prime Minister Kan asked about the effect of seawater injection to the reactor, both Chief Madarame and Fellow Takekuro answered, “Even if it is seawater, we have to put priority on injecting water as soon as possible.” Prime Minister Kan then asked Chief Madarame, “Will injecting seawater cause re-criticality?” and Chief Madarame answered, “You do not have to worry so much about a possible re-criticality.” However, Kan was not satisfied with the answer.
March 12, 19:04: seawater injection started
The seawater injection, whose preparation had been once blocked by the hydrogen explosion, finally started at 19:04.
Fellow Takekuro, who was not aware of the start, strongly requested Plant Manager Yoshida to “Halt the seawater injection because they are discussing it in the prime minister’s office now.” Yoshida was worried about worsening the situation by stopping the seawater injection and consulted with the TEPCO main office and VP Mutoh at the off-site center. They gave him the same reply: “We have to halt the injection because we do not have the blessing from Prime Minister Kan.” Yoshida then judged, however, that he should not stop the seawater injection and whispered to those on duty in a voice low enough to escape detection by speakerphone, “By whatever means, never stop the water injection,” and then, in a loud voice that reached all corners of the response headquarters room, he ordered, “Stop the seawater injection.”
Later, at about 19:30, discussion resumed in the prime minister’s office. Prime Minister Kan, unaware of the process, immediately approved the seawater injection, and Fellow Takekuro lost his chance to explain the situation to Prime Minister Kan. At 20:20, the order to restart seawater injection was given, and the water injection up to that point was recorded as “water injection test” to agree with the time of offical approval.
March 13, past 08:00: radiation increase
For about an hour after this time, radiation levels around monitoring post 4 (MP-4) went up rapidly. The rate, which was 35 μSv/h at about 8:01, rose to 1204 μSv/h at 8:33 (Figure 2.22). This value had 2 more digits compared to the data around the main gate just a few hours earlier.

The reason for this rise was probably not due to the Unit 1 hydrogen explosion or its venting. Most likely it was due to radiation leakage from the CV after core damage of Unit 1, Unit 3, or maybe both.
Unit 1 is estimated to have suffered damage to its CV by about 22:00 on March 11th, and the damage grew by the dawn of March 12th; however, the damage could have expanded more by this time.
March 14, about 01:10: seawater injection halted
At about this time, water withdrawal from the Unit 3 reverse flow cleaning valve pit was disabled, and seawater injection to Unit 1 stopped. The workers then started to build a seawater supply line using a newly arrived fire engine to withdraw seawater directly from the ocean and pour it in the reverse flow cleaning valve pit. The line was completed shortly after 09:00; however, injection to Unit 3 had priority then. To make things worse, Unit 3 had its hydrogen explosion 2 h later, and the fire engine stopped its operation. Water injection to Unit 1, thus, did not restart until about 20:30, meaning that injection to Unit 1 had stopped for over 19 h.
March 14, about 06:00: further radioactivity leakage
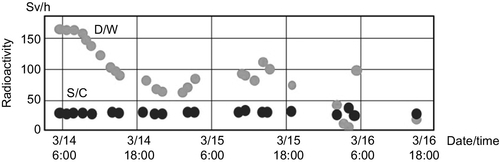
Data from CAMS was available by this time. The data showed higher γ-ray values in the D/W than in the S/C from this time on to late afternoon of March 15th. High γ-ray measurement inside the CV despite the already started leakage from the CV means that core damage was still in progress, and levels higher in the D/W than in the S/C were an indication of a high possibility of leakage from the RPV directly to the D/W (Figure 2.23).
March 14, 11:01: Unit 3 hydrogen explosion
The situation on and after March 15
The CAMS report of high radiation in the D/W during March 15th largely subsided in the night of March 16th, and the situation with Unit 1 had calmed.
There was no water injection into the spent fuel pool of Unit 1 until March 31. The spent fuel there had been cooled for over a year, and its cooling had not been an urgent matter (Section 2.9 will discuss water injection into the spent fuel pools of Units 1 through 4).
Summary of damage to the reactor primary equipment
Table 2.2 shows the damage to the core, RPV, and CV of Unit 1, as they were confirmed by the Investigation Committee. The expressions are based on evidence and have been selected carefully. The locations of leakages from the RPV and CV have not been identified.
Table 2.2
Summary of damage to Unit 1 reactor
| Confirmed damage to Unit 1 | |
| RPV | • Natural to believe damage was present from 20:07 on March 11th to 2:45 on March 12th |
| • Further damage may have taken place afterward | |
| CV | • Possible damage by 21:51 on March 11th |
| • Further damage may have taken place afterward |

Damage: damage that impairs the containment function.
2.5.3 Reason to believe IC did not function
Unit 1 had two IC systems, System A and B. Figure 2.24 shows System A only. Each IC system had four valves, and all of them had to open for IC to function. Of the four valves, two (1A and 4A) were inside the CV, and they were driven open and closed with AC 480 V. The other two (2A and 3A) were outside the CV and were driven with DC 125 V. The power to control the opening and closing of the valves was DC 125 V for all four. To repeat the IC on and off, the normal procedure was to only operate valve 3A while the other three were kept open.

As described earlier, the control power and driving power to the valves were lost at the same time; thus, although the closure signals were sent out, whether the valves closed or not remains unclear. For the following three reasons, however, we believe the IC was barely functioning.
TEPCO’s check of the actual IC isolation valves
(1) On April 1, 2011, TEPCO investigated the IC MO valve circuits. If the fail-safe function “failed” to work and the valves were left as the operator intended, valve 3B should be at “closed” and the others at “open.” The operators did not turn the valves to the “closed” side on or after March 11. The investigation revealed that the electrical circuits of 1A and 4A of System A and 1B and 4B of System B were all indicating “partially open.” These indications were probably caused by the fail-safe function sending out “close” signals, but with the driving power to realize the “close” operation lost at the same time, the closing motions had stopped midway.
(2) TEPCO further, on October 18, 2011, checked the actual openings of the four valves outside the CV. The investigation found that valve 2B was closed, verifying that the fail-safe function worked. Reports say that after the SBO, valves 2A and 3A, which the operator hit open after the fail-safe function, were actually confirmed open.
Cooling water left in the condensate tank
On October 18, TEPCO checked the remaining water in the IC condensate storage tank. The tank for System A was 65% full and that for B at 85%. Normally, the amount of cooling water to store is about 80%, and compared to that level, System A was 15% less and System B at the initial state. The IC operation duration to consume 15% of cooling water is, from calculation, about 1 h, and this number backs the assumption that System B was not used, and System A ran intermittently for about 50 min before the tsunami attack and later hardly functioned at all.
Loss of natural convection due to hydrogen
The IC takes in high-temperature steam, cools and condenses it in the condenser, and recycles the water back into the RPV. The driving force, similar to convection, is the difference of specific weights of steam and water. When hydrogen gas lighter than steam mixes in the system, the lightweighted hydrogen stagnates in the upper part of the piping to stop the circulation. IC is a cooling system; however, it stops functioning when core damage takes place and hydrogen is produced. It has a problem in countering severe accidents.
2.5.4 Delay in venting Unit 1
The reasons for the delay in venting Unit 1 from the morning of March 12th to the afternoon follow:
(1) Training of the vent operation had been made only remotely from the central control room, venting under SBO had never been trained, and there was no manual for it. Thus, the staff had to determine from the beginning which valves could be opened by turning handles, where they were located, and what the routes were to reach the locations.
(2) Compressed air was needed to open A/O vent valves; however, no portable compressors had been prepared (Table 2.3).
Table 2.3
Types of vent valves (for S/C vent)
| Type | Driving power | Manual handle | Location | Notes |
| M/O valve | AC 480 V | None | 2 F | |
| A/O valve large | Air | None | Basement 1 (torus room) | |
| A/O valve small | Air | Unit 1 only | Bypass valve | |
| Rupture disk | None | None | 2 F | Rupture pressure 0.448 MPa (gauge) |
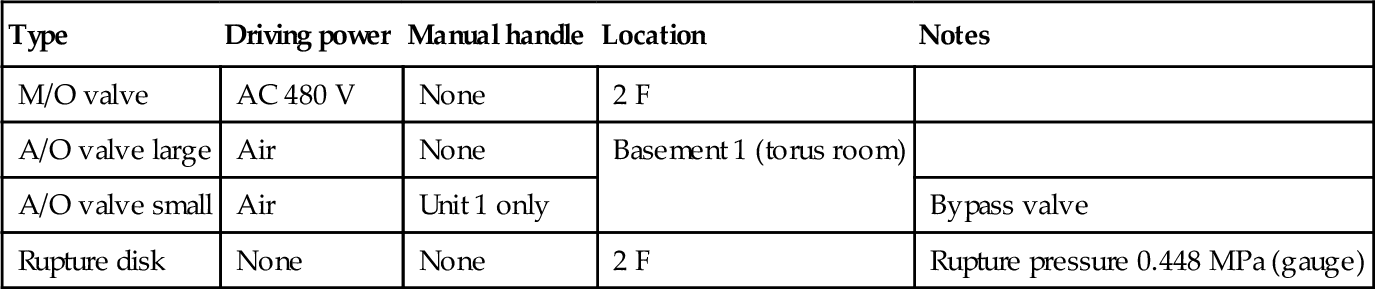
Note: Rupture pressure for Units 2 and 3 were 0.427 MPa (gauge).
(3) Supplying air to the A/O valves required AC power for opening the air piping valves; however, the AC power had been lost. The workers had to carry in the emergency AC power source originally prepared for temporary lighting.
(4) The workers needed to enter the reactor building to hook up the air; however, high radiation in the building blocked their access.
Venting is an emergency procedure to protect the CV from damage. Historically, the Nuclear Regulatory Commission (NRC) decided to equip reactors with vents in 1989 following remarks that said “Mark-I CV volumes are too small” [4] after the Three Mile Island accident. The purpose is to protect the last boundary, CV, from damage with the sacrifice of releasing some amount of radioactivity.
For venting Unit 1, whether from the S/C route or D/W route, the following three conditions had to be met (Figure 2.25).
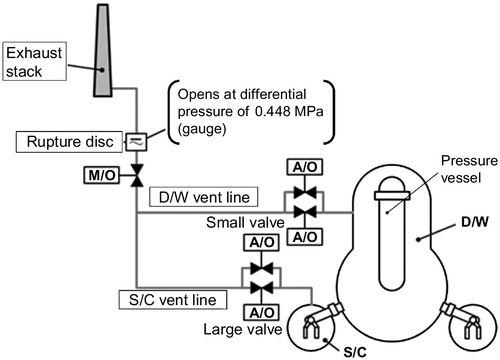
(1) A/O valve large or small (bypass valve) is open
(2) M/O valve is open
(3) CV pressure pushed the rupture disk from the inside at pressure 0.448 MPa (gauge) or larger.
The large and small A/O valves were both in the torus room on basement 1. The small one in Unit 1 had a handle for turning it, but the large one did not. (No handles are installed on either the large or small valve with Units 2 and 3.) When the workers started the venting process with Unit 1 after 09:00 on March 12, the radiation level in basement 1 was too high, and they could not enter it to open the small A/O valve. They had to connect a compressor to send air from a location with relatively low radiation levels. The solenoid on A/O further needed AC power. The M/O valves, on the second floor of the reactor building, had handles for manual turning, and in fact, the operator on-duty on March 12th opened them after 09:00.
To open two vent valves under SBO, the workers needed both a portable AC power and an air compressor. The fact that none were stored in Fukushima-1 indicates poor AM planning. Section 2.10 will return to this point later.
The rupture disk is a type of safety valve that ruptures at 0.448 MPa (in case of Unit 1) or higher. It is a type of fail-safe function to prevent venting when it is not really needed. It is designed to break before the CV pressure reaches the design strength. When both the A/O and M/O valves are open, the rupture disk breaks before the CV pressure reaches its design value to vent the CV. This, however, means that the CV cannot make the first vent at lower pressure. Injecting water into the RPV from an alternative source of D/DFP (discharge pressure about 0.4 MPa) would require lowering the RPV pressure using SRVs, and this requires lowering the CV pressure by venting it. In some situations, there might not be enough slack time to wait for the CV pressure to reach the rupture disk set point. In such cases, the fail-safe function works in the other dangerous direction. “What is safe” depends on the situation. This issue was similar to the fail-safe function of the IC isolation valves.
2.6 The condition of Unit 3 after SBO
2.6.1 Up to 02:42, March 13, when an operator manually stopped the HPCI
March 11, about 15:38: Unit 3, SBO
All AC power was lost due to water submergence caused by the tsunami. DC power survived. The central control room shared with Unit 4 was pitch dark. Unit 3 had its DC power switchboard and batteries on the concourse floor (between the first floor and basement); thus, this equipment did not receive water damage and allowed the operators to monitor the RPV pressure, water level, and other crucial parameters. RCIC had started at 15:25 with the “reactor water level high” signal at 15:25 before the loss of AC power.
March 11, 16:03: RCIC manually started
At about this time, the operator on duty manually started the RCIC (remotely). Because DC power had survived in Unit 3, the central control room was able to operate the RCIC and other equipment as well as read parameters off the indicators.
The RCIC of Units 2 and 3 each had a rated capacity of injecting 97 ton of water per hour. The capacity of the condensate storage tank was about 2500 ton; thus, running the RCIC at full capacity would drain the condensate storage tank in about a day. Water in the condensate storage tank had other tasks and could not spare all its water for the RCIC. The operator had to control the RCIC so it could last through the long hours to come.
March, 12, 11:36: RCIC automatically stopped
The RCIC stopped for some reason, still unknown as of today. The operators looked for the cause and tried to restart it from the central control room, but did not succeed.
March 12, 12:35: HPCI automatically started
The HPCI automatically started on detecting the lowered water level in the reactor (HPCI, like RCIC, used the condensate storage tank or S/C as its source of water). HPCI is also driven by steam from the reactor and thus does not require AC power for running its pump. HPCI is the last resort of emergency core cooling that can inject water into the RPV, even at high pressure. Its rated capacity is 965 ton/h. This high performance quickly raises the reactor water level and stops automatically. Such repetition of ON and OFF will quickly exhaust the battery. The operator, worried about draining the battery, built a bypass route so part of the water discharged from HPCI would run back to the condensate storage tank to control the amount of water injected to the RPV.
The HPCI water injected effectively cooled the reactor, and its pressure gradually dropped. This pressure decrease lowered the HPCI pump discharge pressure. At this time, however, the reactor water level had not been read, and the effect of water injection was not known. This uncertainty caused concerns in the operator’s mind about malfunction of the HPCI, which was forced to run in a state different from normal operation.
March 12, 17:30: early preparation of vent line ordered
The D/W pressure at this time was at about 0.3 MPa (abs), about twice the normal pressure. Plant Manager Yoshida, with the experience of taking long hours to vent Unit 1, felt the need to ready the vent line quickly before the radiation level rose in the reactor building and gave orders to hurry in preparing for the vent.
By that time, the plant emergency headquarters, having learned from the experience with Unit 1, were looking into the procedure for venting Units 2 and 3. The investigation revealed that the two units, unlike Unit 1, did not have handles on the large and small A/O valves for venting the RPV. In other words, to perform the vent, compressed air was absolutely necessary. The M/O valves, on the other hand, had handles for manual operation. It seems it is a common practice for nuclear power plants to put manual handles on M/O valves.
2.6.2 Further progress
March 13, 02:42: HPCI manually stopped
At 02:42, the operator manually stopped the HPCI. As described earlier, the operator on duty had concerns about the status of HPCI and, worried if he should stop it, had consulted with the plant response headquarters. Some of the engineers in the headquarters discussed the matter and reached the conclusion that stopping the HPCI could not be helped for the following reasons.
(1) Running HPCI at a rotation slower than its design speed may lead to damage to the HPCI.
(2) Opening the SRVs would lower the reactor pressure to allow low-pressure water injection using the alternative route from D/DFP.
The team relayed their conclusion to the operator; however, this discussion stayed within the team with the fact that HPCI was stopped. The information of HPCI stopping was not shared with the team leader or Plant Manager Yoshida. As we will discuss later, this process may have affected the later progression of events. When the operator was about to manually turn the HPCI off, the SRV indicator was illuminated green, indicating the SRVs were stopped. The fact that the lamp was on meant that the battery was still alive. The operator judged that he could operate the SRVs from the central control room. After stopping the HPCI, however, when the operator tried to activate the SRVs twice at 02:45 and 02:55, they would not open. It is probable that the battery capacity had dropped to a level to illuminate the status indicator lamps, but below a level to “open” the SRVs, a process that requires a large amount of current. This conjecture is based on the success of their openings, 7 h later, when the batteries had recovered.
March 13, about 03:00: alternative water injection from D/DFP was unsuccessful
The HPCI had successfully cooled the reactor to drop its pressure to 0.58 MPa. After stopping, however, the pressure quickly rose to 0.77 MPa at 03:00 on March 13th, and to 4.1 MPa at 03:44 (Figure 2.26). The D/DFP, which is a low-pressure system, did not have enough discharge pressure to inject water into the reactor vessel at a higher pressure. The situation was critical because they depended on water injection from D/DFP and stopped the HPCI, but the reactor pressure increased to a high level that did not allow water injection from D/DFP. The operators that lost methods of injecting water tried to restart HPCI or RCIC in vain. (The failure to restart the HPCI was probably also due to the low battery.)
Plant Manager Yoshida and other main staff at the plant response headquarters learned about this HPCI stoppage shortly before 04:00, more than an hour after it took place. Yoshida believed before hearing this report that alternative water injection from D/DFP was unreliable because even its closest water source of “filtered water tank” for Unit 1 was located over 500 m away in a straight line, and the piping could have been damaged by the earthquake (the piping seismic classification was level C), and the discharge pressure of about 0.4 MPa was lower than that of the fire engines. Yoshida had a chance of turning down the idea of manually stopping HPCI if he had been consulted about the process by those on-duty before they actually carried out the process.
Shutting down the HPCI should have been done after verifying an alternative method for water injection was available (i.e., opening the SRVs and testing water injection from D/DFP).
March 13, 04:50: serious preparation for venting
At about this time, the rising reactor pressure without means for water injection forced workers to energize the solenoid valves to open the A/O valves for venting. The operators brought in a portable generator for temporary lighting into the central control room and hooked the cables to the solenoid valve terminals trying to activate the valves. Later, however, when an operator went into the basement of the reactor building to check the A/O valve status, it was closed. The operator that entered the torus room heard the sound of SRV discharging steam into the S/C. When he put his foot on the S/C, it was so hot it partly melted the sole of his shoe.
The operator then, at around 05:23, changed the air bottle to one with air remaining in it and carried out the work to open the large A/O valve. After this work, the recovery team from the plant response headquarters headed to the basement of the reactor building to check the opening of the A/O valve. However, by this time, the radiation level in the area was too high to allow entry, and they had to go back to the central control room. They were still unsure if the A/O valve had actually opened or not.
March 13, about 05:00: information from water level indicator became available
At about this time, for an unknown reason, the reactor water level data became available. The water level indicator showed − 2300 mm from the TAF at about 05:10 and − 2600 at about 06:00. From the dropping water level, the plant response headquarters assumed it had dropped to TAF at about 04:15. The water level indication at this time was fairly reliable.
At around 07:39, D/W spray (an emergency cooling system that cools inside the D/W with water spray) was activated with water from D/DFP to lower the D/W pressure. At this time the D/DFP system was available.
March 13, about 06:00: preparation of seawater injection from fire engines
From the previous night of March 12th to about this time, seawater injection to Unit 1 was made by connecting three fire engines in series and pumping seawater up from the Unit 3 reverse flow cleaning valve pit. The sudden stoppage of the Unit 3 HPCI forced the workers to start alternative water injection to Unit 3 as well. After 06:00, the other fire engine on standby moved out to form a seawater injection line for Unit 3. The preparation was complete around 07:00.
About this time, however, on the fifth floor of the prime minister’s office, Minister Kaieda, Chief Madarame, and others were discussing matters like “Injecting seawater will result in decommissioning the reactor” or “Maybe there is freshwater remaining somewhere” and they decided to inquire if there was freshwater anywhere in the plant. A department manager of TEPCO informed Plant Manager Yoshida about the discussion, and Yoshida acknowledged it as a “strong opinion from the prime minister’s office to inject freshwater.” He then reconfigured the water injection line from the completed seawater line to a freshwater line from the fire reservoir (Figure 2.27).
The freshwater injection started almost 7 h after stopping the HPCI at about 09:25. The water in the fire reservoir only lasted for about 3 h, and the injection stopped at about 12:20. Then the workers had to reconfigure the water injection system back to seawater injection, and it had to wait until about 13:12 to start. When we look at the loss of water injection, the freshwater injection not starting until 09:25 was not due to switching the water source, but it was the time lost in waiting for the reactor pressure to drop to the level to allow the injection. The 52-min loss, however, for switching back to seawater after exhausting all the freshwater was due to the change made earlier to freshwater. This loss was an example of directives from Tokyo delaying the team in the field.
March 13, 07:44: securing 12 V batteries
The batteries delivered to the plant from outside up to this point were all 2 V batteries, which were inadequate for activating the SRVs that required 120 V. The plant response headquarters started to search for 12 V batteries and by 07:44 secured 10 batteries from the response headquarters employee cars parked at the plant. These batteries were carried into the central control room in preparation for SRV opening. At around 9:50, over 7 h from stopping the HPCI, the SRVs were opened to release pressure; however, as we will explain later, the pressure vessel had already been depressurized before that from damage to it.
March 13, 08:41: vent line complete
At 08:35, an operator on duty entered the second floor of the reactor building to turn the handle on the vent M/O valve to 15% open. The other A/O valve had already been opened about 4 h earlier. The state was unconfirmed because they could not enter the building. However, at 08:41, the plant response headquarters judged that the vent line was ready (i.e., automatic venting would take place when the CV pressure rises above the rupture disk set point). The headquarters reported so to the ministries and agencies.
March 13, about 09:00: possible damage to the RPV
At about 09:00 on March 13th, the reactor water level shot up, reactor pressure dropped almost instantly, and the D/W pressure rose rapidly (Figure 2.28). The D/W pressure then indicated values that were about the same with the RPV pressure or higher at 0.647 MPa. These data suggest the possibility that part of the fuel dropped to the bottom of the RPV and upon contacting the cooling water at the bottom, generated a large amount of steam to boost the pressure. The RPV bottom was damaged to cause a rapid pressure drop (RPV melt-through). The water level data that followed recorded an abrupt fluctuation. At this time the water level indication may have been out of order, but at the same time, could be showing the real transition of water level jumping up and down with the melted fuel dropping to the RPV bottom and contacting the water to produce an exploding amount of steam.

The Interim Investigation Report (December 2011) states that this rapid pressure drop was from opening the SRVs; however, from the hearings that followed, the committee found it was not. The Final Report corrected the error, and SRV depressurization only took place at about 09:50.
March 13, 09:20: the vent
The D/W pressure around 09:10 showed a peak value of 0.637 MPa (gauge) above the rupture disk set point of 0.427 MPa (gauge), but 14 min later it dropped to 0.540 MPa. The plant response headquarters determined the S/C was vented at around 09:20 and reported so to the ministries and agents. The two vent valves had been open since about an hour earlier at 08:41, and the venting system was ready to vent automatically as soon as the pressure rose above the rupture disk set point. Further at about 10:55, the D/W pressure dropped to 0.27 MPa (Figure 2.29). This suggests a large amount of gas exhaust with radioactive material was made around this time from the exhaust stack to the atmosphere.

March 13, 11:17: D/W pressure rose again, difficulty with keeping the vent valves “open”
Around this time, the D/W pressure started to rise again. The plant response headquarters estimated that pressure drop in the air bottle caused the opening of the vent valves to narrow. Workers entered the reactor building with high radiation levels in two shifts to take turns in 15-min intervals to exchange the bottles. At 12:30, the large A/O valve was confirmed “open,” and the D/W pressure, which was at 0.48 MPa at 12:40 dropped to 0.23 MPa at 14:30.
The D/W pressure, however, soon turned around at about 15:00 and went up to reach 0.41 MPa at about 16:45. The plant response headquarters decided there was a limit to being able to keep changing the bottles by entering the building with high radiation and started to discuss a new method using a compressor. The headquarters then managed to borrow a portable compressor from a contractor and started it at around 19:00. The compressor, however, was a small one, and the D/W pressure was still at 0.425 MPa at 20:30. After about 2 h at around 22:30, probably because all the piping was filled with air, the D/W pressure started on its way down to 0.24 MPa at 0:00 on March 14th. The headquarters for the first time managed to keep the large A/O valve open. So from the time they first opened the vent valve at 8:41 on March 13th, they had struggled with it for over 15 h.
Now, let’s roll back the time by about half a day.
March 13, 13:12: seawater injection started again
As we showed earlier, freshwater in the fire reservoir was exhausted, and after 52 min of interruption, the water source was switched to seawater in the reverse flow cleaning valve pit, and the water injection started again.
March 13, about 14:31: a number of dangerous symptoms
At about this time, a high level of 300 mSv/h was measured at the north side of the double door, and a white haze was seen inside the door. The workers feared a hydrogen explosion like that in Unit 1, but there was no effective way of stopping it. They even considered shooting a hole open on the reactor building wall with a fighter jet from the self-defense force. They had to abandon the idea because of the possibility of igniting the hydrogen and finally settled on using a water jet. They later started to prepare the tools; however, before they were ready, the hydrogen exploded the next day.
The radiation level in the central control room went up to 12 mSv/h in the Unit 3 side, and the operators had to take cover in the Unit 4 side.
March 14, 01:10: seawater in the reverse flow cleaning valve pit was exhausted, and water injection from fire engine stopped
At about 01:10, the seawater in the reverse flow cleaning valve pit was exhausted, and the fire engine that was injecting water into Unit 3 could no longer draw seawater. The plant response headquarters had been searching for a new water source since the day before (e.g., the water intake near Unit 4, maintenance access hatch over the water discharge channel, directly pumping water up using the fire engine, the basement of the turbine building, and many other possibilities); however, they all were unfeasible. When the fire engine stopped drawing water, another observation of the reverse flow cleaning valve pit revealed there was still some water left and, from about 03:20 on March 14th, managed to restart the water injection. That was probably just a short-term solution, and the headquarters, instead of relying on seawater left in the pit, started to discuss directly pumping water up from the ocean. The primary buildings were standing on land 10 m above sea level; thus, pumping the water with one fire engine would not work, but if they connected two in series, the seawater could be pumped. The workers started building the line, and after 09:00, they completed a line that continuously pumped seawater from the ocean into the reverse flow cleaning valve pit.
March 14, about 03:40: energizing the small A/O vent valve
As Figure 2.29 shows, the vent valve that seemed stabilized went unstable, and at about 03:40 the D/W pressure started again on its way up. Headquarters decided to open the bypass small valve in addition to the main large A/O valve. The operators used the portable small generator for temporary lighting to energize the solenoid of the instrument air (IA) system. Then at about 05:00, they switched the compressor to the portable one delivered from Fukushima-2. The D/W pressure, nonetheless, kept rising until about 07:00 and peaked at 0.52 MPa. Thus, all these efforts did not have as much effect as hoped for.
The D/W pressure transition on March 13th and 14th shown in Figure 2.29 indicate how the D/W pressure continued going up and down because the A/O valve opening was not stable.
March 14, 06:30: workers took cover
Around this time, the D/W pressure was staggered at above 0.5 MPa in a manner similar to Unit 1 before its hydrogen explosion, and workers were concerned with hydrogen leakage from the CV and hydrogen explosion to follow. Plant Manager Yoshida was concerned with the workers’ safety,and after consulting with the main office, he ordered temporary retraction to the seismic isolated building around 06:30-06:45. The D/W pressure, however, did not rise any higher, and because building the line to pump seawater from the ocean had priority, Yoshida lifted the order after 07:30.
March 14, 10:53: self-defense force water truck arrived
Around this time, the self-defense force arrived with seven water trucks carrying 35 tons of freshwater. They were headed toward the reverse flow cleaning valve pit in front of the turbine building of Unit 3. When two of the trucks approached the pit, Unit 3 had its hydrogen explosion. Four men on the self-defense force were injured, and the water truck suffered damages. No water was supplied from this truck then.
March 14, 11:01: Unit 3 hydrogen explosion
After a little over 3 h from the lifting of the retraction order, at 11:01, Unit 3 had the hydrogen explosion that everyone was concerned about (Figure 2.30). This explosion injured four personnel from the self-defense force, four TEPCO employees, and three employees of a subcontractor (Nanmei). The workers in the field all took cover in the seismic isolated building. Rumors of a large number of employees missing created a heavy mood in the plant response headquarters. The four fire engines parked in front of the turbine building all stopped working, and the fire hoses were damaged and unusable. The area was covered with rubbish from the explosion.
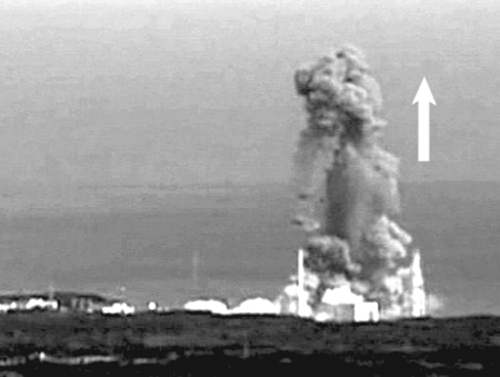
Reactor parameters of Unit 3, however, were still available after the explosion. The D/W pressure was at 0.48 MPa and S/C at 0.47 MPa; thus, Yoshida judged that it was a hydrogen explosion of the reactor building, similar to the one with Unit 1.
March 14, after 13:00: response restarted
Observation of the situation in the field revealed that many of the fire engines had stopped with their hoses unusable from the damage. The method of injecting water up to the point before the hydrogen explosion was to pump seawater from the ocean to the reverse flow cleaning valve pit using two fire engines in series and with different fire engines to inject the seawater individually to Units 1 to 3. The area around the Unit 3 reverse flow cleaning valve pit was covered with rubble, and it seemed difficult to rebuild the lines. The headquarters decided to directly inject the seawater from the ocean to Units 2 and 3. During this time, with priority to carry out water injection to these two units, water injection to Unit 1 was halted.
March 14, about 16:30: water injection restarted
The water injection line damaged with the hydrogen explosion was recovered and water injection to the Unit 3 reactor restarted.
March 15, 7:55
Steam was observed above the building, and discussion was made if they should first spray water on the Unit 3 fuel pool instead of the spent fuel pool of Unit 4 with the most number of fuel bundles. Later the spray was first sent onto Unit 3 (Section 2.9).
Later
RPV pressure and D/W pressure gradually went down. The CV pressure drop was not rapid; thus, CV damage with Unit 3 was not as bad as that with Unit 2.
Summary of damage to the reactor primary equipment
Table 2.4 shows the damage to the core, RPV, and CV of Unit 3, as they were confirmed by the Investigation Committee.
Table 2.4
Summary of damage to Unit 3 reactor
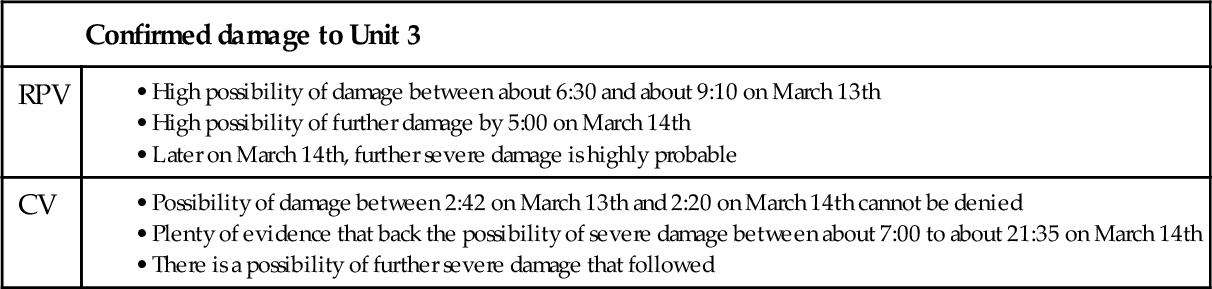
Damage: damage that impairs the containment function.
2.7 The condition of Unit 2 after SBO
2.7.1 Up to about 13:00 on March 14 when the RCIC stopped
March 11, 15:41: Unit-2 SBO
Water submergence from the tsunami caused SBO including DC. The central control room was pitch dark, and all the indicators were not functional. The most important water level and pressure indications of the reactor were unavailable as well. Fortunately, the RCIC had been manually (remotely from the central control room) turned on, but its status from that point was unknown.
March 11, 20:49: temporary lighting turned on, status unknown
A temporary light was turned on in the shared central control room for Units 1 and 2. The water level and injection status, however, were still unknown, and the response headquarters, as preparation against worse situations, prepared to request evacuating the area near the plant.
March 11, about 21:15: pessimistic conjecture of the status
The plant response headquarters, not knowing the RCIC status, estimated the water level to drop to TAF at 21:40, core damage to start at 22:20, and RPV damage at about 23:50. Headquarters assumed the worst for not knowing the water level and other parameters (contrary to their assumption, core cooling was in fact maintained).
March 11, 22:00: water level found to be in a stable condition
Water level was found at TAF + 3400 mm. Around this time, the RPV temperature was at near normal operation level, and the water level indication was also reliable. After about an hour and a half, the RPV pressure was at 6.3 MPa (gauge) and D/W pressure at 0.141 MPa (abs), both in normal ranges, and the engineers were relieved for the moment.
March 12, 01:00-02:55: RCIC confirmed to be operational
At past 01:00, an operator headed toward the RCIC room in the basement of the reactor building to check its status. When he opened the door, however, water gushed out and not being able to enter the room, he headed back to the central control room. At past 02:00, the operator went down to the RCIC room again and managed to get to the entrance, but could not check the RCIC status. He then came up with the idea that he could check the RCIC status by comparing the RPV pressure and the RCIC discharge pressure. He then went to the instrumentation racks on the first and second floors of the reactor building and found the RPV pressure at 5.6 MPa (gauge) and RCIC discharge pressure at 6.0 MPa (gauge). That is, he confirmed the RCIC discharge pressure was slightly higher than the RPV pressure, values that show that the RCIC was running normal. The head of operators on duty then judged that RCIC was operational and reported so to the plant response headquarters.
March 12 about 04:30: RCIC water source switched
The condensate storage tank for each unit was located in front of the turbine building. The capacity was 2500 tons for Units 2 and 3. The operator, concerned with the risk in keeping the RCIC running with the condensate tank, switched the water source to the S/C from the condensate storage tank.
March 12, 17:30: order to prepare the vent
From the experience of delaying the vent of Unit 1, Yoshida ordered an early vent preparation. Venting required compressed air to open the A/O valve; however, the only portable compressor available was in use for Unit 1. They decided to open the A/O valve (Figure 2.31) with the air from the air bottle on the IA system piping.

March 13, 10:15: vent preparation
With the plant manager order at 17:30, an operator went into the reactor building and opened the M/O valve at “25% open.” In addition at around this time, the plant manager had ordered to open all valves on the vent line except the rupture disk (i.e., to open the A/O valve as well). The recovery team of the plant response headquarters went into the first floor of the reactor building and opened the discharge valve on the air bottle next to the IA system piping to open the A/O valve. They further used the portable generator for temporary lighting to force the solenoid on the large A/O valve open by energizing it. At about 11:00, they succeeded in opening the large A/O valve to complete the vent line preparation. The S/C pressure at this time, however, was smaller than the rupture disk set pressure of 0.427 MPa (gauge), and the venting did not take place then.
March 13, past 18:00: preparing a compressor
The plant response headquarters decided to stop using air bottles with unknown amount of air left and rely on a portable compressor like Units 1 and 3. Through teleconference, they requested one from other plants, and about 7 h later, one arrived from Fukushima-2 before 02:00 on March 14th (Unit 1 had one since about 12:30 on March 12th and Unit 3 from about 19:00 on March 13th from contractors).
March 13, late in the afternoon: water injection line ready for Unit 2
At about this time, a water injection line was readied for Unit 2 like Units 1 and 3 that used the reverse flow cleaning valve pit as the water source. Unit 2, at this time, however, had its RCIC in operation and the RPV pressure was still a little less than 6 MPa. Water injection with a fire engine was only made ready and kept on standby.
March 14, 11:01: Unit 3 hydrogen explosion, vent line and water injection lines damaged
Unit 3 had a hydrogen explosion. By that time, the central control room had prepared a temporary circuit to energize the A/O valve solenoid. The hydrogen explosion, however, broke the circuit, and the large A/O valve reclosed. The explosion also damaged a fire engine and hoses, but luckily, the compressor survived the blast.
2.7.2 Further progress
March 14, 13:25: RCIC judged to have lost its function
As described earlier, the reactor water level was going down after around 12:00. The water source for the RCIC had been switched to the S/C pool water from around 04:00 on March 12th, meaning the cooling water had been storing heat for over two days. Thus, the S/C at about 12:30 was at an abnormal state of high temperature and pressure with temperature at about 149 °C and pressure at 0.49 MPa. Given the situation, Plant Manager Yoshida judged that “the RCIC had stopped at about 13:25.”
March 14, 14:43: delay in seawater injection
At about this time, the water injection line damaged by the hydrogen explosion had been recovered early in the morning, thanks to great efforts by the workers. The afterquakes, however, had interrupted further work, and the fire engine started only at about 16:30, and water injection to Unit 3 started then. Unit 2, however, took several hours in operating the SRVs delaying the reactor depressurization, and the state of no water injection continued.
March 14, about 15:00: D/W pressure dropped
The D/W pressure at 0.465 MPa (abs) at about 12:30 started to drop after 13:35, and at about 16:57, it had clearly dropped to 0.40 MPa (Figure 2.32). During this time, no venting or CV cooling system activation had taken place. The D/W pressure drop was, thus, probably due to leakage from the CV that had been subject to high temperature and pressure for an extended time.
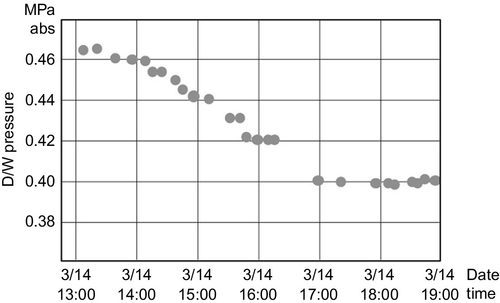
March 14, about 16:00: vent valve did not open
The recovery team of the plant response headquarters kept energizing the solenoid from the central control room; however, as mentioned earlier, the team could not keep the A/O valve open. This was possibly due to the small size of the compressor (see Remarks). At 18:35, the operators tried to open the small valve, in addition to the large A/O valve. They succeeded in cracking it open; however, at this time, the CV pressure had not reached the rupture disk set pressure and in any case, the status of no venting continued.
March 14, about 16:34: SRVs did not open
At about this time, the operators in the central control room connected the ten 12 V batteries collected from around the plant in series and tried to activate the solenoids of the SRVs; however, the SRVs did not open.
March 14, 18:22: all fuel bundles exposed
At 18:22, the water level gauge indicated TAF − 3700 mm, and at 18:50 it went off scale at the lower end, and the water level could no longer be measured. The plant and main office response headquarters both recognized that all fuel bundles were exposed from water at about 18:22.
March 14, 19:03: RPV depressurization with SRVs
At about this time, the SRVs finally opened, and the reactor pressure went down to 0.63 MPa to allow water injection. At about this time, Unit 3 had seawater injection drawn directly from the ocean and relayed with two fire engines connected in series with hoses. Unit-2 was ready for water injection in a similar manner without having to pour the seawater into the reverse flow cleaning valve pit.
March 14, about 19:20: the fire engines ran out of gas
At about this time, water injection to Unit 2 had just started; however, the fire engines were found to have run out of gas. TEPCO’s self-fire defense team, in response, supplied gas from their gas tank trucks; however, water injection to Units 2 and 3 was suspended for at least 37 min.
March 14, 19:57: continuous water injection to Unit-2 started but unstable
Unit 2 without any water injection after its RCIC stoppage, finally received continuous water injection from a fire engine.
Although the water injection had restarted, the Unit 2 RPV pressure was most of the time (over half of the time) from about 21:00 on March 14th to about 01:00 the next day, at a level higher than 1 MPa. Thus, during this time, water injection from the fire engine was physically impossible. Damage to the core and RPV progressed then, and the D/W pressure probably went up and stayed there.
March 14, about 23:35: decision made to vent the D/W
The biggest problem with Unit 2 at this time was that it had not succeeded in depressurizing the CV with S/C venting. The RPV had the safety valve SRVs, whereas the CV did not have equivalent equipment. If the vent continued to be unavailable, the “last resort” CV had the danger of exploding.
At about this time, the S/C pressure was showing values lower than the rupture disk set point, and the D/W, on the other hand, was showing higher values of 0.7 MPas above the rupture set point (see Remarks). The staff at the response headquarters, including the main office, reluctantly decided to vent the D/W. As mentioned earlier, D/W venting was different from S/C venting because it would release the gas inside the CV directly into the atmosphere without passing it through water and thus would cause radiation release that was more than one hundred times that from S/C venting. It was a process to avoid at all costs; however, it was judged that protecting the CV from destruction had higher priority.
March 15 about 00:16-01:11: highly dangerous state with high CV pressure
As Figure 2.33 shows, the RPV pressure exceeded 1 MPa three times between 20:30 on March 14th and 01:30 on March 15th. These large fluctuations can be explained as follows: With the RPV already damaged and leaking, the melted fuel and water came into contact to cause strong evaporation of the water to steam that rapidly increased the RPV pressure, and then with leakage from the RPV, the pressure dropped again. The phenomena repeated to produce the cycle in Figure 2.33.

Next as Figure 2.32 shows, the D/W pressure went down to about 0.4 MPa from about 14:00 to about 17:00 on March 14th. In general, when a vessel has leakage, its pressure will keep going down; however, as Figure 2.34 shows, the D/W pressure quickly went up around 23:00. The reason for this transition is as follows: The CV had already started its leakage, and after about 20:00, large leakage from the RPV started as well. Thus the CV was leaking to the outside but at the same time had RPV leaking into it. The rapid rise in the D/W pressure around 23:00 was caused by stronger leakage into the D/W from the RPV.

The radiation (γ-ray) monitoring results from CAMS (Figure 2.35) also support this conjecture. At 15:15 on March 14th, S/C was at about 0.01 Sv/h and D/W its tenth at about 0.002 Sv/h. After 6 h and 40 min of interruption, the restarted measurement at 21:55 showed that the D/W radiation had rapidly risen to exceed that of the S/C (Figure 2.34). This was probably due to leakage from the RPV directly to the D/W. Thus, the rapid and large D/W pressure rise starting at about 23:00 in Figure 2.34 matches the data from CAMS.

Summarizing the situations around this time, water injection from the fire engine to the RPV with pressure above 1 MPa was impossible. The CV venting failed, and the D/W pressure rapidly went up around 23:00 on the 14th to reach 0.7 MPa in about 30 min and stayed at this dangerous level, which could have resulted in CV explosion. In the midst of such a dangerous situation, Plant Manager Yoshida then consulted with the main office response headquarters and decided to keep, in the worst-case situation, only necessary personnel for each plant control and to evacuate the others from the Fukushima-1 site. To avoid a sense of panic to the others, he gave instructions to only a few to prepare buses so workers could flee the site if the situation worsened.
There is no question that both the RPV and CV had suffered damage at midnight on March 14th; however, the staff did not think that leakage from the CV had started. They were concerned with not being able to vent the CV and were worried about the worst-case situation of its explosion. A loud sound was then heard at 06:10.
March 15, 06:00-06:10: loud sound
It was when the shift was about to turn over when they heard a loud explosive sound in and around the central control room. They were all then given instructions to take cover in the seismic isolated building, and when they exited the building, they were surprised to see that the surrounding scenery had drastically changed. This exploding sound, as we will discuss later, was in fact the sound of the hydrogen explosion of Unit 4. The situation that had surrounded the staff at the time of not succeeding with the vent and the D/W pressure stopped at a high value of 0.7 MPa had put the staff in a state where everyone was holding his breath. The big bang shook the building, and many of them feared the worst. Under the situation, the plant response headquarters kept the minimum necessary staff of 50 on site and evacuated the remaining 650 workers temporarily to Fukushima-2.
The S/C pressure immediately after the explosion was pointing at zero, and with the sound they heard, the people thought that the CV had exploded. The time that the S/C pressure dropped to zero was, however, a few minutes before the exploding sound. Also, this S/C pressure indication was in absolute pressure, and an absolute pressure of zero would mean vacuum, and that physically could not have happened. For these two reasons, the judgment that “the CV exploded and its pressure dropped to zero” was wrong. Also, as Figure 2.34 shows, the S/C pressure was pointing at about half the D/W pressure and suddenly dropped to zero at 06:02. A situation that the S/C pressure was half of that of the D/W pressure for an extended time is also physically hard to imagine (see Remarks). From these facts, we can reason that the S/C pressure indication was unreliable and the values were wrong.
After about an hour, at 07:20, the D/W pressure recorded 0.73 MPa (abs) and then after another long interruption of over 4 h at 11:25, it went down to 0.155 MPa, a value close to atmospheric pressure. It is probable that the CV suffered significant damage during this time.
Later, the monitoring post near the main gate showed extremely high radiation values on March 15th and 16th with a peak at 10,000 μSv/h (around 08:00 on March 15th). The radiation was the highest on March 15th to 16th, and unfortunately, the wind changed into a relatively strong southeast one blowing from the ocean toward the land (Figure 2.36). Also at night, 1.5 mm of cold rain fell for over an hour. This wind and rain dropped a large amount of radiation over the area northwest of the plant and caused serious radiation contamination. These were unfortunate weather conditions for the local districts of Iitate, Namie, and others northeast of the plant.

March 15, 11:25: lifting the temporary evacuation order
As mentioned earlier, the high D/W pressure of above 0.7 MPa was found to have dropped to 0.155 MPa. Those that had evacuated Fukushima-1 to take cover in Fukushima-2 gradually returned to the plant response headquarters starting with group managers.
Later
The RPV and D/W pressure values remained at about the same level with the atmosphere. Radiation reading from CAMS for the D/W did not drop for a long time.
Summary of damage to the reactor primary equipment
Table 2.5 shows the damage to the core, RPV, and CV of Unit 2, as they were confirmed by the Investigation Committee.
Table 2.5
Summary of damage to Unit 2 reactor

Damage: damage that impairs the containment function.
2.7.3 Exploding sound at 06:10 on March 15
Source of the exploding sound
The tremor from the explosion was caught on a number of seismographs, and the time of the sound was 06:12. The difference between the arrival time of the primary wave (P wave) and shear wave (S wave) at multiple locations allow spotting the source. The data identified the source to be around Unit 4 and not Unit 2. The exploding sound heard at 06:12 was, without question, the hydrogen explosion in Unit 4, and because there was no evidence of another explosive sound, there is no reason to believe that the Unit 2 CV exploded.
About “zero S/C pressure”
When the workers heard the exploding sound, the S/C pressure went to zero, and many thought that there was an explosive destruction around the S/C. TEPCO’s data, however, recorded S/C pressure at zero twice at 06:02 and 06:10 before the hydrogen explosion in Unit 4 (06:12). And as we mentioned earlier, the S/C pressure indication was the absolute pressure, and there is no explanation to support that the S/C was at vacuum. Also, the D/W pressure around this time was at 0.7 MPa, and from the CV structure, the two pressure values of the D/W and S/C were unlikely to have large differences. The S/C pressure gauge of Unit 2, thus, was likely broken at this time. Data from pressure gauges in general are reliable. This was the only event with a troubled pressure gauge in the Investigation Report.
Therefore, the thoughts of many workers in the field that there had been a big explosion with the CV near the S/C and the S/C pressure drop to zero resulted from the fear of such an event in the people’s minds. The hydrogen explosion in Unit 4 happened to take place at about the time of zero S/C pressure indication.
On the other hand, there is hardly any question about a large-scale leakage of radioactivity from Unit 2 from March 15th on, and the denial of an explosion does not mean the damage to the Unit 2 CV was small.
2.8 Sequence of events leading to hydrogen explosions in Units 1, 3, and 4
Three units, 1, 3, and 4, had hydrogen explosions in their reactor buildings one after another. The explosions themselves scattered radioactive material that had leaked into the CV, but did not add to the amount of leakage from the CVs. They did, however, cause much trouble in the recovery work and were among the major factors that magnified the seriousness of the accident.
Hardly any of the world experts had expected that the reactor buildings would have hydrogen explosions. It seems odd for an outsider to know that many papers had been published about hydrogen explosions in the CV, but hardly any on that in the buildings (see Remarks). In an interview, one expert attested that he had the impression that the reactor building was being ventilated. On March 11, when asked by Prime Minister Kan, “Is there a possibility of hydrogen explosion?” NSC Chief Madarame answered, “Do not worry because it is filled with nitrogen,” and that was a reply that clearly shows he was only concerned about a hydrogen explosion in the CV.
2.8.1 Differences between the explosions in the units
Units 1 and 3 suffered severe damage on the top (fifth) floor, and Unit 4 on the fourth and fifth floors. The difference is probably because the explosion was centered on the fifth floor in case of Units 1 and 3, whereas, for Unit 4 the center of explosion was on the fourth floor. The volume in the reactor building fourth floor is about a fifth of that in the fifth floor; thus, the explosion in Unit 4 was made with a smaller amount of hydrogen compared to Units 1 and 3.
For Units 1 and 3, possible routes of hydrogen leakage were the flange at the CV top, access hatch, equipment hatch, instrumentation wire feed-through, and the air lock (for worker entry to the CV; Figure 2.37). At the CV flange, the tightening bolts could have elongated due to the pressure rise producing gaps in the bearing surface. Other routes usually have tight seals with O-rings or other packing material like resin, and these polymeric materials were likely to have suffered damage from the high temperatures.
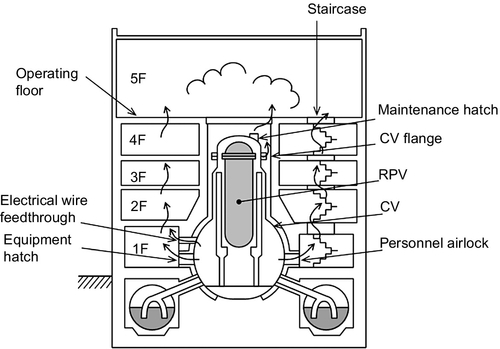
The hydrogen that exploded in Unit 4, which had been shut down for periodic maintenance, must have entered the reactor building of Unit 4 from the exhaust tower shared with Unit 3 when Unit 3 was vented.
Comparing the explosion photographs of Unit 1 and Unit 3, the blast expanded horizontally with Unit 1, whereas that of Unit 3 shot up into the sky (Figure 2.38). This difference is likely to have been caused by the difference in the building structures.
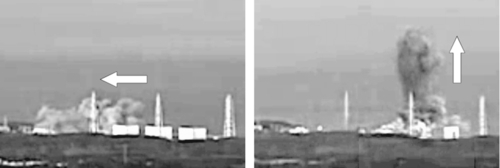
The walls on the fifth floor of Unit 1 were panels attached to steel frames (Figure 2.39); thus, the walls could easily blow out sideways to release the pressure from the explosion. The ceiling did not scatter and simply fell on the fifth floor, while the walls were all blasted away. There was hardly any damage to the fourth floor and lower levels.
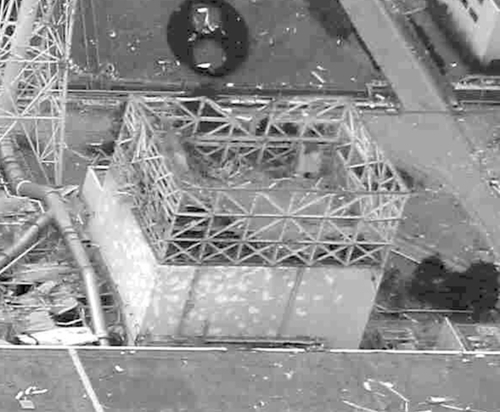
Walls on the fifth floor of Unit 3, on the other hand, were reinforced concrete continued from the lower floors and thus were sturdy (Figure 2.40) in contrast to the ceiling with steel frames and panels with Unit 1. The explosion on the fifth floor of Unit 3 did not get the horizontal relief and thus had to shoot up high. The blast took out the ceiling, all walls, and some of the walls on the fourth floor. These left concrete rubble on the ground that hindered the recovery work that followed.
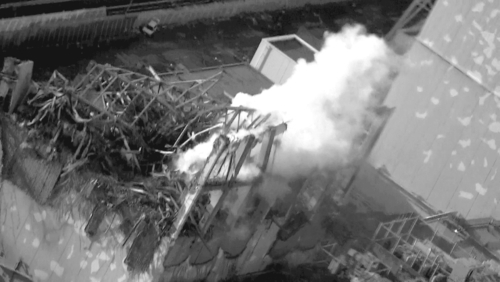
It appeared that the Unit 3 explosion had more energy than Unit 1; however, the one with Unit 1 was calculated to have had about 1.5 times the hydrogen with Unit 3. Unit 3 had a stronger fifth floor, and thus more energy accumulated in it before the explosion wiped the floor out.
2.8.2 Investigating whether the explosions were caused by hydrogen produced from core damage
The Investigation Committee Report discusses in detail the argument of whether these explosions were caused by hydrogen from core damage. The following paragraphs discuss the points in summary.
The only explosive material was hydrogen
Both Units 1 and 3 maintained RPV and CV pressure values several times that of atmospheric pressure; thus the possibility of hydrogen explosion with the RPV or CV is denied. If such an explosion took place inside the vessels and blasted the building walls, the vessels would have been destroyed as well, and their pressure values would have been at the atmospheric level.
Also, time had passed since the earthquake and thus there was no chance of dust from the shaking of the earthquake causing a dust explosion. An explosion from combustible gas was the most likely cause, and because there was no combustible gas in an amount to possibly cause an explosion other than hydrogen, it was identified as the cause.
There was enough hydrogen to cause an explosion
To have a hydrogen blast on the fifth floor of Unit 1, assuming the volumetric low limit of hydrogen explosion at 18.3%, about 312 kg of hydrogen was needed. On the other hand, TEPCO analysis announced in March 2012 and the Japan Nuclear Energy Safety Organization (JNES) analysis announced in September of the same year both concluded that about 900 kg of hydrogen had generated in the reactor. Thus the core damage had probably produced enough hydrogen to blow up the fifth floor of Unit 1.
For Unit 3, similar calculation returns 371 kg as the necessary amount of hydrogen. TEPCO’s analysis of the generated hydrogen was over 600 kg and that of JNES 550-700 kg. Even if the vent had released some into the air, there was plenty of hydrogen left to explode.
The hydrogen explosion of Unit 4 took place on the fourth floor, which had about a fifth of the volume compared to its fifth floor. The minimum amount of hydrogen necessary to cause an explosion was calculated to be 74.2 kg, and this amount is reasonable as an amount that trickled in from Unit 3 (Figure 2.41).

Reasons why Unit 2 didn’t explode
When the fifth floor of the reactor building of the adjacent Unit 1 exploded, the blowout panel of Unit 2 opened like a window, and hydrogen never accumulated in the top floor (Figure 2.42). What seemed like damage from an event turned around and saved the building.
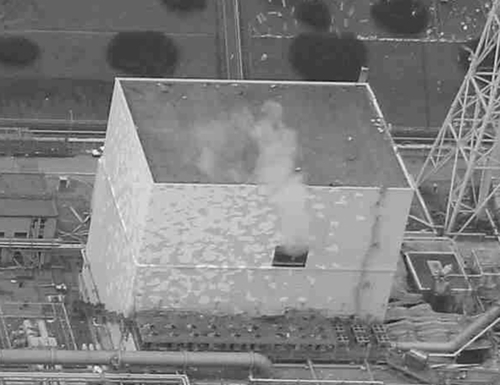
We often hear that this blowout panel not popping open with Units 1 and 3 was a backfire from a lesson from the trouble at Kashiwazaki-Kariwa NPP during The Chuetsu Offshore Earthquake. During this 2007 earthquake, a blowout panel dropped and created some concerns. Later as a countermeasure, involving other plants as well, the panel was secured tighter to its frame. The Investigation Committee, however, learned that the modification had not been in place yet for Unit 3. The blowout panel, nonetheless, did not pop open even with the high CV pressure.
After the hydrogen explosion in Unit 1, the headquarters saw that Unit 3 would also have a hydrogen explosion for sure, and discussions were begun to open a hole in the reactor building. The conclusion was to use water jet; however, the plan was not completed in time, and the explosion took place on March 14th.
2.9 The process of water injection into the spent fuel pools
2.9.1 Plant status up to March 15th
Early in the morning of March 13th, a stack of white smoke was seen to come up from Unit 1. This caused concerns within the plant and main office response headquarters that if spent fuel was exposed from water in the SFP, the spent fuel without any cover would release a large amount of radioactivity. Unit 4 had the biggest number of fuel bundles in storage, and its SFP was of great concern. Discussions were started about spraying water from a fire engine with an extended ladder or a helicopter, but they could not come up with an effective idea until the hydrogen explosion in Unit 4 at past 06:00 on March 15th.
2.9.2 March 15, about 09:00: started discussion about water injection into the SFP
The spent fuel in Unit 1 had passed over 1 year after they were removed from the core, and their small decay heat gave them low priority for water injection. The SFP of Unit 1, thus, had water injection for the first time on March 31 from a concrete pump truck (about 90 ton of freshwater). The following injection was not made until May 20. Unit 2 had its reactor building intact and thus could not receive water spray from above. The workers performed water injection from the fuel pool cooling and cleanup system using a fire engine, and the SFP was filled up full on March 22nd.
On March 15th, the response headquarters had to decide which SFP to put priority on: Unit 3 or Unit 4. Unit 4 with the largest amount of spent fuels and many still with large decay heat first received the priority (Table 2.6); however, in the morning of the next day, white smoke was seen from Unit 3, and they decided to make the judgment after an observation from a helicopter.
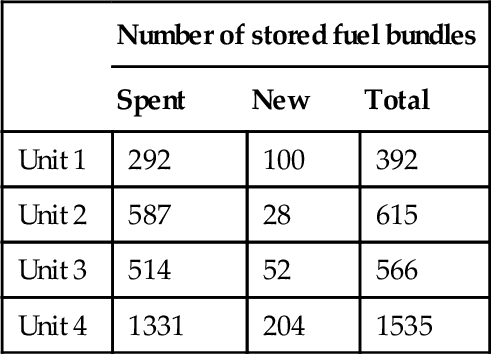
2.9.3 March 16, afternoon: visuals of Unit 4 SFP
A TEPCO employee boarded a self-defense force helicopter and observed the plant. He confirmed high enough water level with the Unit 4 SFP covering the fuel bundles. The mechanism for this water in the SFP was explained as follows: Unit 4 was in its periodic maintenance, and SFP and the reactor well, on the other side of the pool gate, were filled with water. After the accident when the SFP water level lowered with evaporation caused by decay heat, the pressure on the well side, with higher water level, of the pool gate pushed the pool gate to crack open, and water in the reactor well flew into the SFP (Figure 2.43). Given the good condition of the Unit 4 SFP, they decided to prioritize spraying water onto the Unit 3 SFP.

2.9.4 March 17: started water spraying
First, for about 13 min from 9:48, two self-defense force helicopters made a total of four trips to dump 30 tons of seawater onto Unit 3. Many who watched this process on TV felt the process was not very effective. Water spray from helicopters was only made this one time. Then for about 8 min from 19:05 on the same day, the Tokyo Metropolitan Police Armed Response Team sprayed 44 tons of seawater from a high-pressure fire engine. This attempt also lacked effect with the short reach of sprayed water and was only performed this once also. Next a fire engine from the self-defense force sprayed 5 times and a total of 30 tons of freshwater (Figure 2.44).

On the following day, March 18th, the self-defense force fire engine sprayed 40 tons, then TEPCO armed with a U.S. military fire engine sprayed 2 ton of freshwater. On March 19th before dawn, the Tokyo Fire Department sprayed 60 tons of seawater from its fire engine, and the seawater spray on Unit 3 significantly increased from then on.
2.9.5 March 20: water spray to Unit 4
From March 20th, water spray to Unit 4 started. The self-defense force sprayed 80 tons of freshwater twice bringing the total to 160 tons. Most of this water was judged to have landed on the SFP. Spraying water from the ground ended on March 25 with the last spray on Unit 3.
2.9.6 March 22: concrete pump truck
From March 22nd, a concrete pump truck with a special long arm of about 60 m (a.k.a. Giraffe) came onto the scene to spray water onto the target spot (Figure 2.45). It started with Unit 4 on March 22nd and moved to Unit 3 on March 27th. This truck made the water spraying a reliable process, and other fire engines were no longer needed. The Giraffe kept pumping water until June.
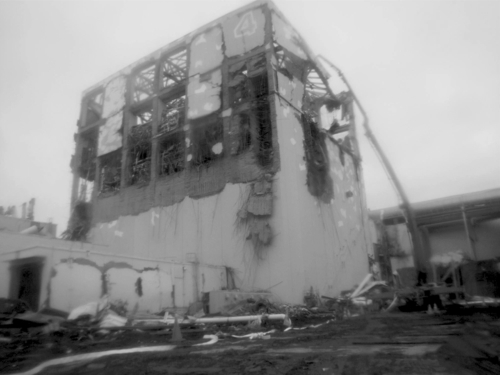
2.10 How the accident might have been avoided
2.10.1 Safety measures in place in other countries
A number of safety measures, not taken in Japan, were in place in other countries. The following are six such examples that would prove effective during severe accidents:
(1) Emergency power
Browns Ferry NPP (Mark-I) in the United States has a portable battery rack to serve as an 8 h emergency power supply to take readings from instruments (Figure 2.46) [3].

(2) Watertight doors
This is another preparation at Browns Ferry. The emergency D/Gs are located in a room with watertight doors [4].
(3) Manual handle for IC valves
Milstone NPP (Mark-I, U.S.) has handles on the IC valves inside the CV and conducts training to open the valves from outside the CV [5]. Fukushima-1 Unit 1 IC valves inside the CV could not be opened from the outside.
(4) Snorkel
Diablo Canyon NPP (PWR) has air inlets for seawater pumps at 13.5 m above sea level using snorkels [6] (Figure 2.47).

(5) Vent filter
Mühleberg NPP (Mark-I, Switzerland) has a filtering system on its vent lines that will filter out many of the radioactive materials by passing the vent gas though water mixed with special liquid ingredients [3]. The liquid is injected by gravity so no electricity is needed.
(6) Independent emergency cooling system
The Mühleberg NPP has developed, in addition to the GE-designed cooling system, an entirely independent emergency cooling system for each building [3]. Inside the building is a watertight room with an emergency D/G and a switchboard.
The Japanese nuclear power generation technologies were superior in material science, machine reliability, and damage prevention in case of an earthquake. Most of these measures are techniques for preventing small accidents, but there was no safety engineering for disaster severity reduction in case a large-scale accident took place. In other words, we can sum up the problem to “We concentrated our efforts to prevent small accidents, but we failed to pay sufficient attention in planning what to do in case a large accident occurred.”
2.10.2 Measures that were feasible
It is a misleading mind-set to think building tall seawalls is the only way to prevent tsunami damage. There are a number of safety measures are realistic and not so costly. Instead of planning to prevent even the smallest water submergence, we need to change our mind-set and think to draw a safety line to prevent only the worst accident of core damage. We then realize the importance of protecting peripheral but indispensable equipment for severe accident prevention, like switchboards, batteries, and compressed air are equally important like the main facilities. Ensuring safety to such equipment with back-ups and watertight rooms would probably cost a relatively small amount. We would like to point to the following five measures from the viewpoint of what the minimum measures were that could have been prepared simply and inexpensively to prevent severe accidents (Figure 2.48).
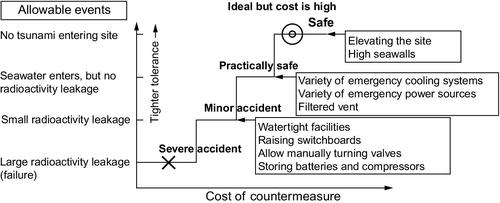
(1) Providing Variety with Switchboard Installation
The lack of variety in the installation of switchboards was a definite factor in failing the deep protection. Multiple switchboards should have been distributed in a variety of locations.
(2) Preparation for Loss of DC Power
Loss of DC power caused difficulties with the control and instrumentation function at the plants. It was a fatal factor in the accident response. The stoppage of the Unit 1 IC with its fail-safe function was also directly caused by the loss of DC power. Although it might be hindsight, the plant should have kept a stock of at least 12 V batteries easily found in shelves of auto shops.
(3) Providing Watertight Structures with Buildings
Retrofitting buildings to make them watertight would not cost too much. Even if modifying the entire building turns out difficult, at least reworking rooms with primary equipment to make them watertight is an inexpensive and feasible measure.
(4) Storing Portable Air Compressors
The air compressor stopped working with this accident, and that was the main reason in delaying the opening of the A/O vent valves. Air compressors are inexpensive machines, and the plant should have stocked portable air compressors with generators in case of AC power loss.
(5) Improving the Water Level Gauge
This accident taught us that when the core damage causes a high temperature in the CV, the water level in the reference condensate pot goes down, and the gauge will no longer be effective. Ideas for improving this instrument will have to wait for further discussion; however, this is clearly a serious weakness for such a crucial instrument.
2.10.3 Hypothetical scenario for accident prevention
We cannot help wondering, if those on duty had taken different actions under the same circumstances at the time of the accident, such severe consequences would have been avoided. Here we will discuss if the workers and operators had made the best judgments, whether the following scenario of early SRV operation would have been accomplished.
When the reactors were faced with the emergency situation of SBO, while there was enough cooling water in the reactor, if the following steps had been made to allow alternative water injection at low pressure, this severe accident would have been avoided:
(1) Open the SRVs to lower the RPV pressure
(2) Perform vent as necessary to keep the CV pressure low
(3) Continuously inject water using fire engines.
First of all, those on duty must have selected this scenario. Now, opening the SRVs while there was enough cooling water means sudden boiling from the boiling point drop caused by pressure drop. Thus, deciding to follow the scenario requires, first, that the SRVs can be opened, and then confirming that the following vent and alternative water injection with a fire engine can be made for sure. This confirmation requires verifying the availability of fire engines, water source, batteries, compressors, and other tools, feasibility of connecting existing equipment with the emergency tools, checking where the connections will be made, accessibility to those locations, how to execute the vent without power, and securing workforce to accomplish all steps. In reality, all these factors were obstacles in the actual accident response, and they were not, in fact, at satisfactory levels, and those on duty would not have selected this scenario. To answer the question of whether the SRVs would have been opened or not, we will need further investigation, but here we will discuss the authors’ views for each reactor.
(1) Unit 1
The IC was not functional after the tsunami attack and at around 20:00 on the first day of the accident, core damage had already started. Thus, even if alternative water injection with a fire engine was the target, there was hardly any chance for the scenario to be realized. If, however, the workers had started earlier aiming at the “scenario,” alternative water injection from a fire engine and vent could have been made much earlier (several hours) than the records show. If so, the degree of core damage would have been less, and the amount of radioactivity release could have been much lower. The hydrogen explosion could have been avoided as well. Accident response with Units 2 and 3 were greatly affected and delayed with the hydrogen explosion of Unit 1; thus, if Unit 1 had not exploded, the response for Units 2 and 3 could have been totally different.
(2) Unit 2
Unit 2 had a time slack of over two and a half days after the SBO to the stoppage of RCIC. Thus, this reactor had a high possibility of executing the scenario before dawn on March 14th when the core damage started.
(3) Unit 3
Not having batteries and compressors in storage was a big obstacle in the accident response for Unit 3. If, however, there were adequate instructions, securing them could have been completed on March 12th with high possibility of success.
The accident response for Unit 3 was carried out simultaneously with that for Unit 1; thus, we also have to evaluate restrictions on manpower. The authors, however, do not have enough information to judge such points. We then conclude that for Unit 3, if the right decisions and instructions were made immediately after the SBO, though with some uncertainty, the chance cannot be denied that the scenario would have been realized.
From the preceding discussion, when we turn our discussion to Fukushima-1 as a plant, we believe there was a possibility that a severe accident broke out only with Unit 1.
2.11 Background to nuclear power generation
We wrote this section for readers without background knowledge of nuclear power generation so they can better understand this book. The subjects we will cover are as follows:
• Basic knowledge of nuclear fission and decay
• Details of cooling systems and SRV
• Explanation of mechanism of water level indicator malfunction
2.11.1 Nuclear fission and decay
Fragments of material that nuclear fission produces are called fission products, and they are generally unstable immediately after the fission. These products, as Figure 2.49 sketches, produce heat (decay heat) and radiation (α-ray, β-ray, and γ-ray) to slowly change into a stable material that does not produce radiation.
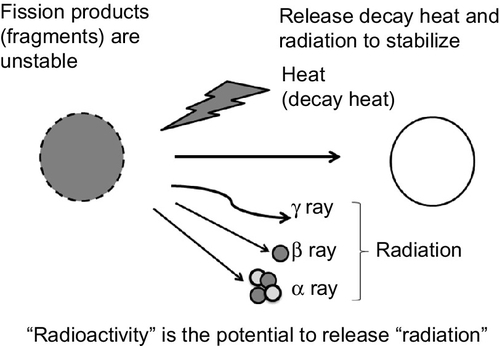
When an operating reactor is suddenly stopped, the reactor holds a large amount of unstable fission products, and the decay heat is as large as 6% of the heat generation during operation. The decay heat gradually drops as the fission products turn into stable materials.
Fuel in a nuclear reactor, thus, continues to produce heat after the operation is stopped (Figure 2.50). The nuclear reactor has RHR systems to cool the fuel even after the reactor is stopped. As time passes, the decay heat drops, but it does not go down to zero. This is why the fuel, after a certain amount of time left cooled in the reactor, is moved to the fuel pool for storage and natural cooling.

Radioactive materials that nuclear power plants generate are fission products from nuclear fission chain reaction and transuranium elements generated when uranium captures neutrons (Table 2.7). Nuclear fission takes several forms of separation, and a number of fission products make the fragments. Uranium with a mass number of 235 (U235) has a high probability of separating into a material with a mass number of around 130 and another of around 90 (Figure 2.51).
Table 2.7
Radioactive material produced in a nuclear power plant
| Category | Source | Primary nuclei |
| Volatile | Nuclear fission | I131, I133, Xw133, Kr85 (noble gas) |
| Quasi-volatile | Cs134, Cs137, Sr90 |

When non-fissile U238 captures a neutron not consumed for fission, it adds to its atom number and mass number to transfer to Plutonium Pu239. Also, when Pu239 captures two neutrons, it transforms to Pu241, and furthermore, when Pu241 decays, it transforms to Amersham Am241. These materials with atom numbers larger than uranium are called transuranium elements, and they are radioactive materials also produced in a nuclear reactor.
Table 2.7 shows main radioactive materials that are produced inside the reactor of a nuclear power plant in operation [7]. Among these materials, volatile radioactive materials like iodine I and cesium Cs easily make their ways to the outside when the fuel is damaged.
2.11.2 Cooling systems
Figure 2.52 shows the list of Fukushima-1 NPP cooling systems categorized with their functional requirements.
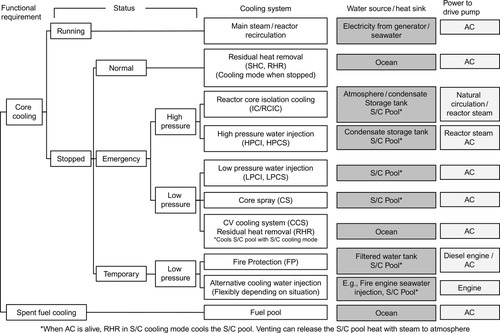
Table 2.8 shows the primary specifications with these systems.
Table 2.8
Primary specifications of fukushima-1 NPP cooling systems
| Fukushima-1 NPP | Unit 1 | Unit 2 | Unit 3 | |
| Shutdown cooling system (SHC) | Pump | |||
| No. | 2 | |||
| Flow rate (m3/h/pump) | 465.5 | |||
| Head (m) | 45.7 | |||
| Heat exchanger (EX) | ||||
| No. of units | 2 | |||
| Capacity (kcal/h) | 3.80 × 10⁶ | |||
| RHR | Pump | |||
| No. | 4 | 4 | ||
| Flow rate (ton/h) | 1750 | 1820 | ||
| Total head (m) | 128 | 128 | ||
| Seawater pump | ||||
| No. | 4 | 4 | ||
| Flow rate (m3/h) | 978 | 978 | ||
| Total head (m) | 232 | 232 | ||
| Heat EX | ||||
| No. | 2 | 2 | ||
| Heat Xfer rate (kcal/h) | 7.76 × 10⁶ | 7.76 × 10⁶ | ||
| IC | No. of systems | 2 | ||
| Tank capacity (m3/tank) | 106 | |||
| Steam Fl Rt (ton/h/tank) | 100.6 | |||
| RCIC | Steam turbine | |||
| No. | 1 | 1 | ||
| RPV pressure (Mpa) | 7.7–1.0 | 7.7–1.0 | ||
| Output (HP) | 500–580 | 500–580 | ||
| Rotation (rpm) | 5000–2000 | 4500–2000 | ||
| Pump | ||||
| No. | 1 | 1 | ||
| Flow rate (ton/h) | 95 | 97 | ||
| Total head (m) | 850–160 | 850–160 | ||
| Rotation (rpm) | Variable | Variable | ||
| HPCI | No. of systems | 1 | 1 | 1 |
| Flow rate (ton/h) | 682 | 965 | 965 | |
| No. of pumps (per system) | 1 | 1 | 1 | |
| LPCI | No. of systems | 2 | 2 | |
| Flow rate (t/h) | 1750 | 1820 | ||
| No. of pumps (per system) | 2 | 2 | ||
| Core spray system (CS) | No. of systems | 2 | 2 | 2 |
| Flow rate (ton/h) | 550 | 1020 | 1141 | |
| No. of pumps (per system) | 2 | 1 | 1 | |
| Pump discharge pressure (MPa) | 2 | 3.45 | 3.45 | |
| CV cooling system(CCS) | No. of systems | 2 | 2 | 2 |
| Dsgn Fl Rt (ton/h/system) | 705 | 2960 | 2960 | |
| No. of pumps (per system) | 2 | 2 | 2 | |
| No. of heat Ex (per system) | 1 | 1 | 1 | |
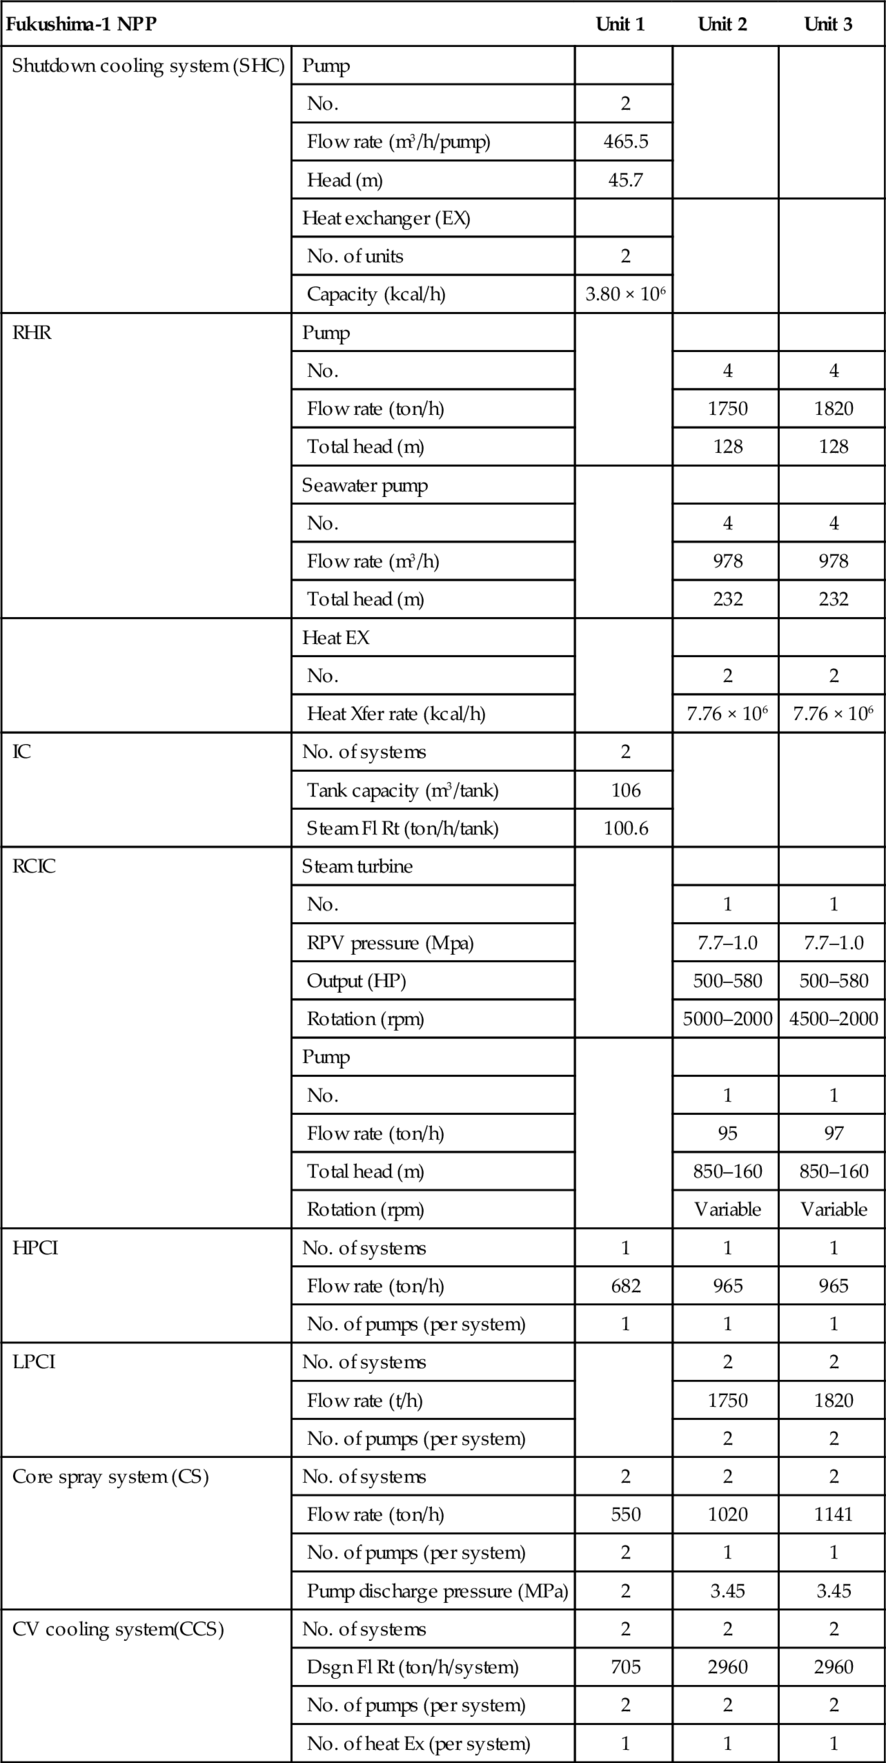
(adapted from [1], [11])
2.11.3 Safety relief valve (SRV)
The SRV has two functions: to automatically release steam when it reaches a preset value (safety valve function) and to manually release steam when triggered by an external force (relief valve function). Figure 2.53 shows its structure. SRVs discharge steam into the S/C. The reactor also has dedicated safety valves that discharge steam to the D/W. As Table 2.9 shows, the discharge set points are lower for the S/C than the D/W. This is to discharge primarily to the S/C so radioactive material is captured by water in the S/C pool.

Table 2.9
Fukushima-1 SRV specification
| Fukushima-1 NPP | Unit 1 | Unit 2 | Unit 3 | |
| Main steam line SRV | Number of valves | 4 | 8 | 8 |
| Total capacity [ton/h] | 1090 | 2900 | 2900 | |
| Relief discharge pressure [MPa] (No. of valves) | 7.28(1) | 7.44(1) | 7.44(1) | |
| 7.35(2) | 7.51(3) | 7.51(3) | ||
| 7.41(1) | 7.58(4) | 7.58(4) | ||
| Safety discharge pressure [MPa] (No. of valves) | 7.65(2) | 7.65(2) | ||
| 7.71(2) | 7.71(3) | |||
| 7.79(3) | ||||
| Discharge to | S/C | S/C | S/C | |
| Dedicated safety valve | Number of valves | 3 | 3 | 3 |
| Total capacity [ton/h] | 900 | 900 | 900 | |
| Discharge pressure [MPa] | 8.51(2) 8.62(1) | 8.55 | 8.55 | |
| Discharge to | D/W | D/W | D/W | |
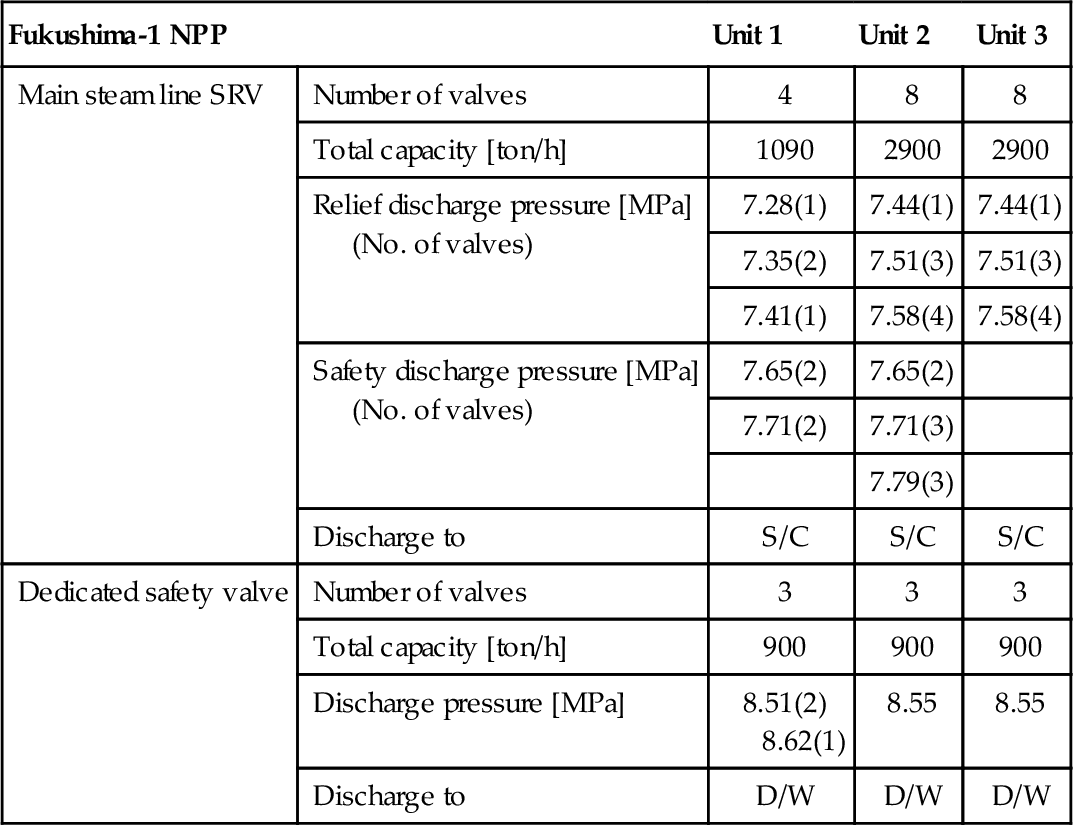
(adapted from [1], [11])
A nuclear reactor may require lowering its pressure, to a value lower than the “safety valve” function settings to allow additional water injection from the outside. For such situations, SRVs also have a “relief valve” function that is force activated by control signals from the central control room. When opening SRVs, if the CV pressure (back pressure to the piston) is higher than the design pressure, larger forces may be required to activate the relief function even if the RPV pressure is the same. The driving force to activate the relief function is nitrogen gas at pressure of less than 1 MPa. During the Fukushima-1 accident, the CV pressure often exceeded 0.5 MPa. This backpressure may have made the relief functions hard to activate.
2.11.4 Reactor water level sensor and mechanism of malfunction
Principle of nuclear reactor water level sensing
The principle of nuclear reactor water level sensing is to measure the water pressure change at the bottom of the pressure vessel to detect the cooling water level (Figure 2.54). If there was a water level change of 2 m, the change in pressure then is about 0.02 MPa.

If the water level sensor simply measures water pressure at the bottom of the pressure vessel as shown in Figure 2.54a, the measured pressure is the cooling water pressure (assume the water level at about 10 m) 0.1 MPa plus the steam pressure of about 7 MPa to bring the reading to about 7.1 MPa. Then the measurement range is too large for accurately measuring changes around the size of 0.02 MPa.
The sketch in Figure 2.54b solves this problem by measuring the difference between the steam pressure at the top of the pressure vessel and the water pressure at the bottom of the reactor. This difference shows the reactor water level at accuracy several tens of times better.
The water level sensors in actual nuclear reactors are as Figure 2.54c shows. The reference condensate pot at the top of the reference side of the pressure gauge allows measuring the difference between the reactor water level and the water level in the reference condensate pot. This configuration further improves the accuracy of water level measurement.
This configuration, however, as we will discuss later, has a fundamental problem that if the water level in the reference condensate pot goes down with the RPV temperature rise, the water level reading goes wrong. Some countermeasures against this problem should be made for the case of severe accidents.
Mechanism of malfunction
Normal state
Assume the reference pot water level was 10 m, reactor water level was 8 m, and the steam pressure was 7 MPa (Figure 2.55). The steam pressure of 7 MPa and the water pressure 0.1 MPa from the reference pot to the pressure gauge apply to the reference side of the pressure gauge at 7.1 MPa. On the measurement side, the sum of the steam pressure 7.0 MPa and cooling water pressure 0.08 MPa apply at 7.08 MPa. The sensor then measures the pressure difference of Δh = 0.02 MPa, which converts to a water level of 2 m.

Reference pot water level drop
When the CV temperature rises above the saturate temperature or the temperature around the reference condensate pot goes up and condensation no longer takes place, the water in the reference side piping evaporates and the water level in it drops. The sensor, unaware of the change, bases its reading on the state with water inside the reference condensate pot, and the reactor water level is miscalculated to be higher than actual (Figure 2.55b). The sensor without a reference condensate pot shown in Figure 2.54b does not have the problem of evaporation, but if steam condenses inside the piping, the water in the reference piping causes the same problem of incorrect reading.
Extreme water level loss in the reactor
If the reactor water level drops drastically to below the inlet of the measuring side piping, the pressure sensor is merely measuring the elevation difference of water inside the piping (Figure 2.55c). This reading is not relevant to the reactor water level. If the system was in that state and if evaporation in the piping on the two sides stops, the indication stabilizes at a wrong value.
Data show that during this accident, such phenomena took place in Units 1 through 3. Those in charge, however, did not recognize that the reactor water level readings were incorrect, and judgments made without knowing the actual state of the reactors were also root causes of this accident.
2.12 Conclusions
Unit 1 of Fukushima-1 was one of the first, and thus the oldest, commercial BWRs in operation. Units 2 and 3 designs were newer with bigger capacity and thus with newer emergency systems at the time of core isolation (RCIC). Although RCIC for Units 2 and 3 kicked in after the earthquake and kept running after the tsunami attack, the older IC for Unit 1 that started after the earthquake was forced to stop by its own logic on loss of electricity caused by the tsunami.
The operators of the plant did not recognize that the IC had stopped. It was the fail-safe function, which nobody remembered at the time of the accident, to close the valves in case of power loss that shut down the IC. This oversight can be excused due to the chaotic situation then; however, not ever test running the IC system since the plant start-up some 40 years earlier contributed to the problems. None of the operators or engineers had experience of witnessing the IC system in operation.
The lack of preparation against an extended SBO and simultaneous accidents with multiple reactors was evident. Without ways of reading important parameters like reactor water level and no way of mechanically forcing valves that were motor- or air-driven under normal circumstances, plant personnel had to work with batteries, portable compressors, and generators. This emergency equipment reached their hands when it was too late to bring the accident under control. It was, however, the dedicated hard work of these men that saved the accidents from turning into a worse disaster that could have threatened the lives of people in the Tokyo metropolitan area.
The images of explosions of Units 1 and 3 shook the entire world that was keeping an eye on the news as the accident progressed. It was, however, Unit 2 that released the biggest amount of radioactivity. The accident was a severe reminder about how vulnerable modern machines are against loss of electricity. The Japanese design approach which focused on preventing even the smallest amount of radiation release led to the inability to prevent a more catastrophic event.