Chapter 7
Visioning
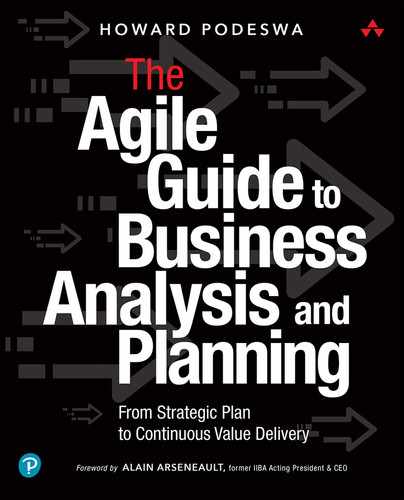
This chapter examines visioning activities. In visioning, stakeholders articulate a vision of the future state that will be realized by the product or endeavor and the reason for embarking on the initiative. Visioning is carried out when developing a new product or undertaking a major change. It is revisited quarterly and as required by changing circumstances, such as a new market opportunity—or loss of an opportunity—due to unexpected regulatory changes. Figure 7.1 highlights the activities included in this chapter.
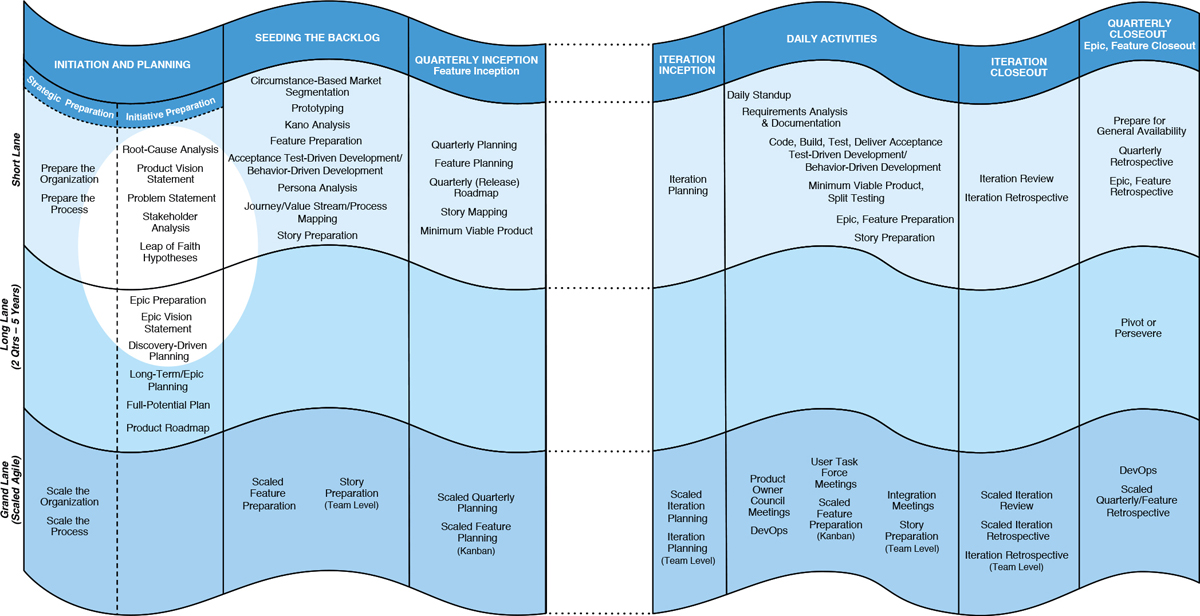
Figure 7.1 Chapter 7 on the map
The chapter begins with the first step in the process, root-cause analysis. Root-cause analysis is a set of methods for tracing the causes of an effect back to a root cause. An example of an effect is poor customer retention. An example of a root cause is an inefficient customer-service process. Root-cause analysis techniques covered in this chapter include Five Whys and cause–effect diagrams. The chapter explains how to use this analysis to inform the crafting of product vision statements, epic vision statements, and problem statements. The identification of root causes helps direct development investment to areas that have the greatest potential to impact outcomes.
Stakeholder analysis begins as early as possible in the initiative and is continually updated and developed as more stakeholders are discovered and their needs become better understood. The chapter includes guidelines, templates, and checklists for performing this analysis and using it to inform the communication plan.
The next step covered in the chapter is the identification of leap of faith hypotheses—critical assumptions that underlie the vision and must be valid for the undertaking to be viable (e.g., the hypothesis that users will pay for a subscription to a new service). Leap of faith hypotheses are identified and tested early so the company can decide whether to invest its resources in the endeavor or pivot to another hypothesis. The chapter explains the agile approach for doing so using the minimum viable product (MVP) process. An MVP is a low-cost version or facsimile of the proposed product or feature used for learning. Customers interact with MVPs, and their feedback is used to test hypotheses, features, changes, and design solutions.
The chapter ends with guidelines for specifying metrics to validate hypotheses and measure progress toward goals and objectives. It explains how to define actionable metrics—measurements that can be used to make data-informed decisions.
The chapter also marks the beginning of the BLInK case study workshops that run throughout the book. Each workshop provides a snapshot of agile analysis and planning tools as you step through the development lifecycle.
7.1 Objectives
This chapter will help you to
Identify root causes and needs.
Articulate the vision statement for the product or epic.
Craft a problem statement.
Analyze stakeholders, goals, and objectives.
Discover leap of faith hypotheses.
Specify the actionable metrics that will be used to validate hypotheses.
7.2 This Chapter on the Map
Figure 7.1 highlights the visioning tools we cover in the first zone, Initiation and Planning. These are root-cause analysis, product vision statement, epic vision statement, stakeholder analysis, problem statement, leap of faith hypotheses, and circumstance-based market segmentation.
7.3 Overview of Product Visioning and Epic Preparation
In visioning, stakeholders articulate a shared vision of the future and the reason for undertaking the endeavor. This activity is performed at the product level (product visioning) to communicate the rationale for building the product. It also occurs at the epic level to articulate the rationale for a major change initiative and prepare the epic for planning and implementation.
Visioning occurs primarily at the beginning of an undertaking, but the activities are revisited quarterly and as required by changing circumstances (e.g., because a hypothesis for the product no longer holds true or because of a new opportunity or threat).
Individuals typically responsible for product visioning include the following:
Director of product
VP of product
Chief product officer
Product-level product owner (PO), Portfolio
Senior business analyst
Junior business analysts are not typically involved in the formation of the product vision, but they share the responsibility to communicate the product vision and objectives to the team.
Visioning is an essential activity for achieving any bold target that requires sustained effort, such as Nike’s moonshot challenge to “double business with half the [environmental] impact.”1
1. “NIKE, Inc. Sets Bold Vision and Targets for 2020” [press release], Business Wire, May 11, 2016, https://www.businesswire.com/news/home/20160511005885/en/NIKE-Sets-Bold-Vision-Targets-2020
The envisioned target may be for
an enterprise (enterprise visioning),
a product (product visioning), or
an epic or change initiative (epic visioning).
In this chapter, we focus on product and epic visioning.
The result of visioning is a vision statement. Internally, a product vision statement motivates the team and supports the development of a cohesive product. Externally, the product vision statement communicates the product’s potential value to investors and early adopters (earlyvangelists) at the start of a venture and drives marketing messages to customers. Similarly, epic vision statements and problem statements communicate the reason for a change initiative.
7.3.1 An Example of Product Visioning and Why It’s Important
A couple of years ago, I worked with a team of consultants tasked with choosing an incident management solution for a public transportation agency. The incidents ranged from small schedule delays to fatal accidents. (Suicides were a particularly common and unsettling incident type; one unfolded in real-time as I was viewing the monitoring system with the team.)
After I’d introduced the consultants to the benefits of visioning, they realized that they had never gone through this vital step even though they were well into the preliminary analysis. And so, they convinced their manager to convene a visioning workshop with stakeholders. During the workshop, the participants defined a vision of the product that was very different from the one assumed by the consultants. The participants expressed a vision of a solution that would free up customer support agents from the mundane incidents that occupied most of their time so that they could focus on those tasks best handled by humans. The consultants, on the other hand, had been working under the assumption that the vision was of an all-encompassing tool that could manage any incident an agent might have to deal with. This insight resulted in significant savings because it meant that the team could now exclude incident types that required integration with police and government systems. As it turned out, those were the types that had contributed most to the initial cost estimates.
7.3.2 Visioning Checklist
By the time you get involved with the initiative as a business analyst, the product vision may already have been defined or completely missed, as was the case in the preceding example. If you were not part of the initial analysis, your first step should be to check if any steps in the product visioning process were skipped. Use the checklist in Appendix A.4 to determine if that’s the case.
As a business analyst, you are a change agent. If you discover that important steps were missed during product visioning, it is your responsibility to raise your concerns, highlighting the risks of not carrying them out. Though you may lack the authority to act on those concerns, you can influence those who do.
7.3.3 Initial Stakeholder Identification
As soon as possible, identify the primary individuals and groups affected by the initiative and those who impact it, such as approvers. Key stakeholders include business subject matter experts (SMEs) in the areas affected by the initiative, the PO, sponsor, and steering committee members.
Stakeholder identification and analysis is ongoing. As the initiative progresses, expect to discover more stakeholders and learn more about their needs. We examine these activities more fully in section 7.9.
7.3.4 Facilitation Tips
Product visioning and root-cause analysis workshops typically take place through group facilitation led by a PO or business analyst. As a facilitator, the soft skills you bring to the table to these events are at least as important as the analysis techniques covered in this book. Tips for facilitating stakeholder events can be found in the appendix.
7.4 Root-Cause Analysis
If you don’t diagnose the real cause of a problem, you can’t solve it. Use Lean Six Sigma’s root-cause analysis techniques early in the development process to aid in the diagnosis. For example, following a merger of two banks, data discrepancies keep appearing despite repeated efforts to fix them. Root-cause analysis traces the problem back to data duplication between the two banks’ systems. The problem is solved by normalizing the data or merging the systems.
Sometimes a need that stakeholders bring forward is really a proposal for a solution. In this case, you use root-cause analysis to identify the underlying need. For example, one of my clients was a software consulting company looking to enhance a software system used by its compliance auditors. The auditors had told analysts they needed reporting features they’d seen in a competitive product. Root-cause analysis revealed the real need: to mitigate the risk of missing the opportunity to bid on government contracts if the company didn’t meet a compliance deadline. Once this problem was correctly identified, the team was able to focus enhancements on those features the software system needed for compliance, significantly reducing the risk of missing the deadline. A similar approach can be used to trace an opportunity back to a core benefit (e.g., tracing the opportunity presented by new mobile payment technologies to greater customer convenience).
Table 7.1 is an overview of the root-cause analysis approach.
Table 7.1 Root-Cause Analysis: At a Glance
What? |
Root-cause analysis: A set of techniques for uncovering the root causes of a presenting symptom. The approach encompasses a family of tools such as Five Whys (asking Why? repeatedly) and cause–effect diagrams. |
When? |
At the start of an initiative. |
Why? |
Ensure the real problem is addressed so that symptoms do not recur. |
Tips |
Create analysis artifacts live, during facilitation events, so that attendees can visualize cause–effect relationships as they are discovered. |
Deliverables |
Root causes, Five Whys graph, cause–effect diagram, cause–effect tree |
We look at the following root-cause analysis tools:
Five Whys
Cause–effect diagrams
Cause–effect trees
7.4.1 Five Whys
The Five Whys method is just what it sounds like. You ask, “Why?” repeatedly until a root cause is found. There is nothing magic about the number five; it’s just a rough approximation of the number of times one has to ask the question to get to the root cause.
As an example, suppose stakeholders present the problem of decreasing revenues. You ask the first why question: “Why has the decrease occurred?” You learn that it’s mostly due to an increase in voluntary churn (customers choosing to leave the company). Next, you ask, “Why has voluntary churn increased?” You learn that it is because customer loyalty is weak. Again, you ask why. You learn that competitors have more robust customer loyalty programs. Figure 7.2 shows the Five Whys diagram you create during this conversation.
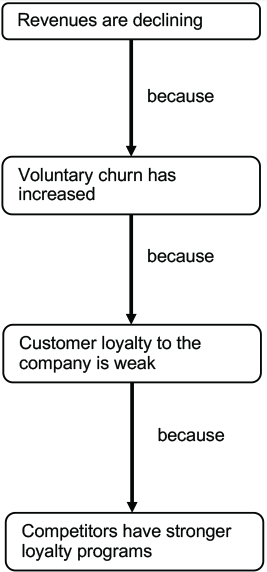
Figure 7.2 Example of a Five Whys diagram for decreased revenue
The figure illustrates the train of causes from the effect “Revenues are declining” back to the root cause of the problem, “Competitors have stronger loyalty programs.” In a similar way, you can trace an expressed want back to a root need.
Since root-cause analysis is one of the first analysis activities in new product development, it’s also a fitting place for our case study to begin. We follow this case through most of the book as we walk through the Agile Analysis and Planning Map (see Chapter 4, “Analysis and Planning Activities across the Agile Development Lifecycle,” Figure 4.1).
7.4.2 Cause–Effect Diagrams
Whenever you ask why, you can get more than one answer—and those answers may lead to more questions with more answers. Though elegant in its simplicity, the Five Whys method doesn’t have a way to map multiple causes. A cause–effect diagram does. Use it when there are multiple answers to the question, “Why?”
The diagram is also referred to as an Ishikawa diagram or fishbone diagram. Figure 7.4 is a template for this type of diagram.
Figure 7.4 Cause–effect diagram template
7.4.2.1 Facilitation Tips
Start the diagram by drawing a horizontal line—the spine—with an ellipse at one end—the fish head (indicated at the right edge of Figure 7.4). Ask stakeholders to specify the effect—the presenting symptom that triggered the initiative. The effect can be an undesirable symptom you wish to trace to its root causes, a presenting opportunity traced to root benefits, or an expressed want traced to a core need. Indicate the effect inside the head of the diagram, as indicated in Figure 7.4.
Now, ask stakeholders why the effect occurs. For each cause you discover, draw a new line away from the spine. Label the tip of the new line with the cause, as shown for causes 1 and 2 in Figure 7.4.
Next, ask stakeholders why each of these items occurs and map those answers as indicated in Figure 7.4 for cause 1 (shown to be due to causes 3 and 4) and cause 2 (linked to causes 5 and 6).
Continue asking about each cause until you come up against a dead end. For example, causes 7 and 8 are dead ends. Additional why questions do not yield useful knowledge. For example, any further causes are outside of the organization’s sphere of influence.
The dead ends on the diagram are the root causes. In Figure 7.4, they’re the shaded causes: 4, 5, 6, 7, and 8.
7.4.2.2 Example of a Cause–Effect Diagram
Let’s suppose you’ve convened a group of stakeholders to examine the reason for declining revenues. You soon learn there are multiple causes, so you use a cause–effect diagram for the analysis. Figure 7.5 illustrates the diagram developed during the meeting.
Figure 7.5 traces declining revenues to two root causes: the market is saturated and competitors have stronger loyalty programs. The company may decide to address these causes by seeking out new markets and by strengthening its loyalty programs.
7.4.3 Cause–Effect Trees
You may have noticed that in Figure 7.6, declining health of enrollees appeared twice. This duplication occurred because it was a cause that had two different effects. Cause–effect diagrams don’t have any explicit mechanism for indicating this kind of relationship or for showing other complex relationships—such as instances where multiple causes have to occur together before an effect can happen. Cause–effect trees address these shortcomings. Use them if you need to analyze several presenting problems holistically because their causes are intertwined. The trees also enable stakeholders to identify areas of improvement that have the potential to address multiple issues simultaneously.
7.4.3.1 Legend
Figure 7.7 shows a cause–effect tree legend that is adapted from the original form invented by Eliyahu M. Goldratt.3
3. James F. Cox and John G. Schleier, Theory of Constraints Handbook (New York: McGraw Hill, 2010).
Each rounded rectangle on the diagram represents an entity. An entity is an item that may be a cause, an effect, or both, based on its relationship to other entities. Each arrow points from a cause to an effect (e.g., in Figure 7.7, C causes A). If an effect has more than one cause, more than one arrow will point to it. When these arrows are unadorned, they represent on OR relationship, meaning either entity, on its own, causes the effect. For example, if either B or E occurs, then UDE 2 will happen. When two or more arrows are lassoed by an oval (a bar may also be used), an AND relationship is indicated, meaning all of the causes must occur to generate the effect.
The diagram includes special entities referred to as undesirable effects (UDEs). These represent unacceptable symptoms.4 Examples of UDEs are high defect levels, undesirable turnaround times, low market share, bugs, and any functionality that does not operate as expected. You may use parenthesis to indicate the stakeholder affected by the UDE—for example, UDE 1: (Patient) Lack of access to medical reports.
4. Cox and Schleier, Theory of Constraints, 394–395.
7.4.3.2 Creating the Diagram
Begin the analysis by asking stakeholders to identify the symptoms that the business is experiencing. As these symptoms are detected, add them as UDEs near the top of the diagram. For each UDE, identify the stakeholder concerned about it (e.g., customer, business, or employer).
Tracing back from these UDEs, ask stakeholders to identify their causes—adding them to the diagram as they are discovered.
If there is more than one cause for an effect, ask if they both need to happen for the effect to occur. Use the appropriate notation to document the response. Once no more causes are discovered, review the diagram with stakeholders and list the dead-end entities as root causes.
Reviewing the proposed BLInK program, you note that that the product will use a subscriber’s health data to encourage healthy behaviors by offering benefits for healthy choices. You facilitate an examination of the program’s impact on the remaining root causes.
Root causes 2, 3, and 4 are all found to be areas in which BLInK would have a positive impact. The product would provide the technical capabilities required to collect data from IoT devices. Moreover, it would deliver an attractive rewards program to customers, thereby increasing loyalty and providing incentives for healthy choices.
Based on the analysis, you conclude that BLInK promises to improve outcomes for the following UDEs:
UDE 1: (BL) Decreased profitability
UDE 2: (BL) Undesirable loss ratio
UDE 3: (Subscriber) Rising healthcare costs
UDE 4: (BL) Increased average payout per subscriber
UDE 5: (Employer) Increased absenteeism
UDE 6: (Subscriber) Declining health
7.5 Specifying a Product or Epic
You can use the Connextra template to summarize the understanding you reached through root-cause analysis for a new epic or product. For example, in the BLInK case study, you understood the core benefit of the product: increased competitiveness and profitability due to better loss-ratio forecasting. In the Connextra format, you express this as follows: “As a group insurer, I want to gather lifestyle data so that I can improve loss-ratio forecasts.” In one sentence, this formulation identifies the primary beneficiary, the primary functionality, and the beneficial outcome. Another example is the epic “As a supply chain manager, I want to introduce dropship capability so that top-line sales can be increased without the inventory expense.”
Specify acceptance criteria for an epic that describe, at a high level, the minimum requirements for completion. The following example expresses the business objective that must be achieved: “Legacy system can be retired.”
We examine acceptance criteria for epics and features at greater length in Chapter 10, “Quarterly and Feature Preparation,” section 10.9.
7.6 The Problem or Opportunity Statement
The problem or opportunity statement is a less concise but more informative summary of the business case for a product or change initiative, such as an epic.
The statement addresses the following Five W questions:
What is the root problem (or opportunity)?
Whom does it affect?
Where does the problem occur?
When does it occur?
Why should we care?
You can articulate the problem statement in a paragraph, a section of a business case, or a sentence or two, using the following template:
In Scaled Agile Framework (SAFe), a similar format is used as part of the epic hypothesis as follows:
7.7 The Product Portrait
We’re about to evolve the understanding we’ve been developing into a product vision statement, customer objectives, stakeholder analysis, and many other informative BA information artifacts. These artifacts should be transparent to business stakeholders and members of the development organization in order to promote a shared understanding of the product. The product portrait is a publicly posted chart—or information radiator—that provides that transparency. It also reduces time lost to interruptions by answering critical questions about the product.
Table 7.2 provides an overview of the tool.
Table 7.2 The Product Portrait at a Glance
What? |
Product portrait: An overview, displayed in a public space, that provides a snapshot of the product. Based on Roman Pichler’s product canvas. |
When? |
Create the portrait during initial preparation for a new product or significant change. Update it as needed. |
Why? |
|
Tips |
Use the portrait to facilitate visioning workshops, working through the template from left to right to support a customer-driven analysis. Post it in a public place and update it often. |
Deliverables |
Product portrait includes vision statement, stakeholders, objectives, assumptions, metrics, design sketches, and features. |
7.7.1 The Product Portrait Template
Figure 7.9 is a product portrait template. The template is based on Roman Pichler’s product canvas,7 with added elements from lean startup and other sources. Adapt it according to your needs.
7. Roman Pichler, “The Product Canvas” [blog post], July 16, 2012, https://www.romanpichler.com/blog/the-product-canvas
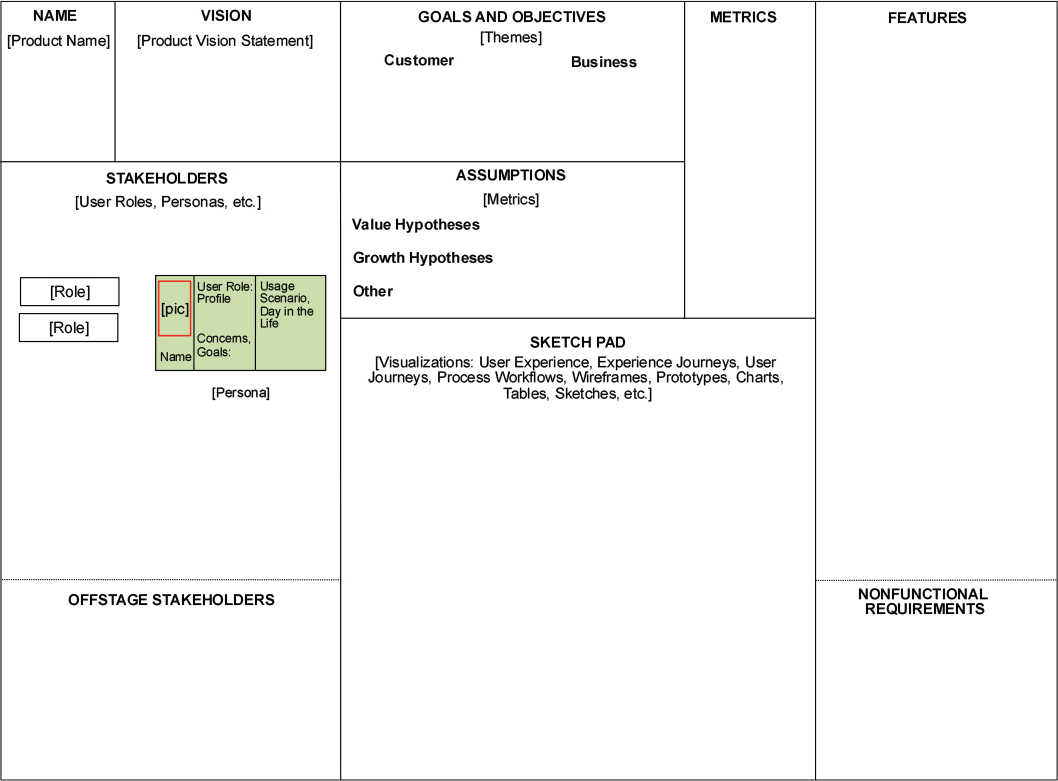
Figure 7.9 Product Portrait Template (adapted from Pichler’s Product Canvas)
Use the product portrait as a facilitation tool during visioning workshops, advancing from the top to the bottom and left to right. Follow this sequence: vision, stakeholders, goals, objectives, assumptions, metrics, and so on. In this way, the product portrait supports a customer-focused process.
Use the sketch pad area of the product portrait to communicate visual artifacts developed during the product’s analysis and design. Pictures have significant benefits over words: they take advantage of our natural ability to use “parallel processing” when handling visual input. The sketch pad may include artifacts such as the following:
Customer and user journeys
Process models
Wireframes and other user interface design items
Charts and tables
7.8 Crafting the Product and Epic Vision Statements
Root-cause analysis looks backward to understand the underlying causes of problems. Vision statements look forward.
7.8.1 The Product Vision Statement
The product vision statement looks forward, describing the change users will experience when the product is deployed to the market and what the company hopes to accomplish by developing it. The responsibility to articulate the product vision statement and supporting objectives belongs to product-level POs and business analysts. A team-level analyst is responsible for understanding the product vision and objectives, communicating them to the team, and ensuring that the requirements support them.
7.8.2 The Epic Vision Statement
Similarly, an epic vision statement describes the future state after an epic—a significant change to an existing product. Within the problem statement format, the epic vision statement can serve in place of the final sentence, “A successful solution would. …” Use the epic vision statement for the elevator pitch within the SAFe epic hypotheses template. The articulation of the epic vision statement is the responsibility of the area PO or product-level PO, depending on the scope of the change. A team-level analyst is responsible for communicating the epic vision and its objectives to the team and ensuring that the requirements support them.
7.8.3 Properties of Well-Crafted Product and Epic Vision Statements
The product vision statement should express the product’s most inspiring purpose rather than its more mundane objectives.8 In line with full-potential planning (see Chapter 9, “Long-Term Agile Planning,” section 9.4), it should be bold and innovative (e.g., to be first in customer service or to dramatically increase market share within three to five years). Similarly, an epic vision statement expresses an inspiring reason for a change initiative rather than describing an incremental improvement.
8. Roman Pichler, “8 Tips for Creating a Compelling Product Vision,” October 8, 2014, https://www.romanpichler.com/blog/tips-for-writing-compelling-product-vision
A vision statement should be short so that it can be easily remembered and propagated throughout the organization and out into the market. John Kotter identifies the following properties of a well-crafted vision statement:9
9. John Kotter, 8 Steps to Accelerate Change in Your Organization, Kotter Inc., 2020, https://www.kotterinc.com/wp-content/uploads/2020/06/2020-8-Steps-to-Acceperate-Change-eBook-Kotter.pdf
Communicable
Desirable
Creates a verbal picture
Flexible
Feasible
Imaginable
Simple
An agile vision statement articulates a view that leaves ample room for emergence, whereby new features are discovered by observing how customers use the product rather than predetermining what will be useful. To allow for emergence, don’t specify features in the vision statement; focus, instead, on the raison d'être for the product or change. For example, Instagram’s product vision statement is about “capturing and sharing the world’s moments.” Note how this statement describes the value of the product but does not specify whether those moments are captured as photos, video, or virtual reality. This lack of specificity is deliberate because it does not place unnecessary constraints on how the product will evolve. Had Instagram’s vision statement specified photos, it would have limited the potential scope of the product in the minds of users, the business, and product developers.
The product vision statement should be designed for longevity. However, it should be revised if the company wishes to reorient the product in a fundamental way in response to changes in the market or public perception of the product. For example, Facebook changed its product vision statement in 2017 from “making the world more open and connected”10 to the statement “to give people the power to build community and bring the world closer together.”11 As this example also illustrates, it’s not enough to change the vision statement. The change has to percolate down to changes in the product and the culture of the development organization.
10. Nick Statt, “Mark Zuckerberg Just Unveiled Facebook’s New Mission Statement,” The Verge, June 22, 2017, https://www.theverge.com/2017/6/22/15855202/facebook-ceo-mark-zuckerberg-new-mission-statement-groups
11. Facebook, “About,” https://www.facebook.com/pg/facebook/about
7.8.4 Vision versus Mission Statements
Some organizations have vision and mission statements. The product vision statement describes an envisioned future, while the mission statement focuses on what the company has to do today and every day to get there. In other words, the vision statement is aspirational, whereas the mission statement is operational. As former International Institute for Business Analysis (IIBA) acting CEO Alain Arseneault puts it, it’s the difference between having a vision of a healthy environment and a mission to clean and sanitize every room frequently.
7.9 Stakeholder Analysis and Engagement
A stakeholder is any person or group that has an impact on an initiative or is impacted by it. Stakeholder analysis is a process used to identify stakeholders and analyze their needs, attitudes, influence, and the initiative’s impact on them. Stakeholder engagement includes developing a strategy and timelines for collaborating and communicating with stakeholders and the ongoing activities to carry them out.
The business analyst has primary ownership of the stakeholder analysis and engagement process. These duties include developing, conducting, and managing the process; determining the participants and timelines, and establishing procedures for maintaining stakeholder analysis information.16 Perform a comprehensive stakeholder analysis to ensure all stakeholders are considered and as a first step in determining the requirements for a product or initiative.
16. Alain Arseneault, in an editorial note to the author, July 2020.
Stakeholder analysis and engagement includes the following activities:17
17. International Institute of Business Analysis, “Plan Stakeholder Engagement,” in BABOK v3: A Guide to the Business Analysis Body of Knowledge, 3rd ed. (Toronto, Canada: IIBA, 2015), 31–35. The steps in the book are derived from activities in BABOK v3, section 3.2.
Identify and analyze stakeholders.
Plan stakeholder collaboration.
Plan stakeholder communication.
Facilitate and conduct ongoing engagement and analysis.
7.9.1 Identify and Analyze Stakeholders
The first step is to identify the stakeholders. At this point in visioning, you’ve begun to do that in the problem statement. If you’re an outside consultant like me, you might start with one stakeholder—the person who first contacted you, such as the sponsor or the champion for the product. That person then leads you to the next interviewees, who lead you to others.
7.9.1.1 Stakeholder Checklist
If you rely solely on this process, however, you can miss essential stakeholders. For example, early in my BA career, I was so focused on users of the product, I neglected to interview the steering committee that would be reviewing my recommendations. As a result, I was unprepared for the questions they asked me during my final presentation about the project’s financial justification. Since the legacy software was no longer supported, I had assumed the financial justification was so obvious it didn't need to be addressed. Had I thought to interview the committee members beforehand, I wouldn’t have been blindsided during my presentation. Fortunately, I was saved by the product’s champion, who explained why there was no choice but to move ahead. Ever since, though, I’ve made a habit of using a checklist to make sure I consider every kind of kind of stakeholder—even though I don’t expect to include them all. See Appendix A.5 for a checklist of stakeholder types and their contribution to the analysis. Other sources of information for identifying stakeholders include company websites, internal corporate groups, organization charts, process maps, and documentation from previous initiatives.18
18. Arseneault, personal communication, 2020.
7.9.1.2 Stakeholders List, Roles, and Responsibilities Table
Refine the stakeholder analysis by investigating the involvement of each stakeholder in the initiative and with the product. Table 7.3 is an example of stakeholder lists, roles, and responsibilities, an artifact used to document the results of stakeholder analysis.
Use techniques like user role modeling workshops and user personas to refine the stakeholder analysis further.
7.9.2 Plan Stakeholder Collaboration
Next, determine how each stakeholder or stakeholder type will collaborate with the development team.
Gain agreement on the following points:
Forum for the collaboration: the method of engagement, such as requirements workshops, focus groups, wikis, scheduled meetings (real and virtual), Web conference, conference calls
Location
The expected type of involvement (e.g., as an active collaborator, tester)
Time expectations (e.g., full-time team member, one hour per week)
Responsiveness (e.g., same-day response to urgent queries)
7.9.3 Plan Stakeholder Communication
Use the preceding analysis to create a stakeholder communication plan that specifies the following:
Informational requirements—information needed by the stakeholder from the team (e.g., status updates) and by the team from the stakeholder
Forum or method of communication (e.g., summary reports, status update meetings, email, wiki, website)
Timing, frequency of communication
Level of granularity required
Audience level (expert, general)
Preferred communication style (formal, casual)
7.9.3.1 Stakeholder Impact/Influence Matrix
Use a stakeholder impact and influence matrix to determine the communication strategy. Table 7.4 illustrates the four quadrants in the matrix.
Table 7.4 Stakeholder Impact and Influence Matrix19
Influence of Stakeholder |
High |
Ensure stakeholder concerns are addressed. Keep stakeholders abreast of issues and overall progress. |
Consult stakeholders regularly about features, business objectives and targets. Keep stakeholder abreast of issues and overall progress. |
Low |
Communication can be summary (e.g., public announcements). |
Consult stakeholders on targeted areas where new features or changes will impact them. |
|
Low |
High |
||
Impact on Stakeholder |
19. IIBA, BABOK v3, 345.
Place each stakeholder or role in the appropriate quadrant based on the nature of their involvement, then plan a communication strategy for each stakeholder using the guidelines in the corresponding section, as shown in Table 7.4.
7.9.4 Facilitate and Conduct Ongoing Engagement and Analysis
Execute the plan. Facilitate collaboration between stakeholders and the team and communicate with stakeholders as described in the plan. Stakeholder analysis is iterative and ongoing. As you learn more about stakeholders and discover new ones, update information and plans as required.
7.10 Analyzing Goals and Objectives
The next step is to translate the product or epic vision statement into goals and objectives. Consider the perspectives of the business and the end customer: What does the company gain by developing the product or carrying out the change initiative? What are the benefits to the purchaser and the user?
Since we’re about to focus on goals and objectives, let’s review what we know about them from Chapter 3, “Fundamentals of Agile Analysis and Planning.” A business goal is something to which the enterprise aspires to, such as
Establish an enterprise-wide assortment planning capability by the end of the year.
A business objective is an outcome below the enterprise level (e.g., Provide the ability to promote services and benefits by the end of the third quarter). The objective can be a learning objective, for example, to test the hypothesis that, if users are warned before they share an article or video they haven’t viewed, they can be incentivized to view the content and form their own opinion before sharing it. Companies should maintain a learning mindset throughout their lifespans.
Goals and objectives should be measurable and time-bound (e.g., the business goal to increase sales by 10 percent by the end of the year).
7.10.1 Use Circumstance-Based Market Segmentation as a Basis for Goals and Objectives
Use circumstance-based market segmentation to identify the jobs that customers hire the product to do—the high-level usages of the product (e.g., launch a marketing campaign). If a new product is being developed, represent these usages as customer goals and objectives. For example, one job or customer goal for a gaming app is to babysit toddlers so that their parents can have some personal time.
Once the product is established, continue using circumstance-based market segmentation to reveal opportunities for new usages of the product and to improve the way they are currently implemented. For example, after the gaming app in the preceding scenario is released, further market analysis reveals a new “job” customers want to carry out through the product: parents want to protect their children from viewing harmful content while interacting online. This insight is the basis for an epic—a change initiative whose objective is to provide protection across the platform by a given date.
As noted earlier, goals and objectives must be measurable. Define the metrics that will be used to measure progress. In line with full-potential planning guidelines (discussed Chapter 9, section 9.4), specify metrics that represent real-world outcomes, such as increased market share and compound annual growth rate (CAGR), rather than process metrics such as total lines of written code or velocity. A success metric for the gaming app in the previous example might be a 50 percent reduction in the average time between episodes of whining.
7.10.2 Representing Goals and Objectives within the Story Paradigm
The following are guidelines for representing goals and objectives within the story approach. The benefit of doing so is that you can use a single paradigm to trace the entire evolution of a goal to detailed requirements items. However, if your organization already has an effective way to manage goals and objectives, there is no need to change it.
7.10.2.1 Represent User Capabilities as Epics and Features
If the goal or objective is to implement a high-level usage (a job a user can do with the product), create an epic or feature to deliver it, depending on the estimate for the item. An epic may require multiple teams over multiple quarters. A feature must be implementable within a single quarter; it may include multiple teams.
7.10.2.2 Represent Other Goals and Objectives as Themes
Represent any other goal or objective as a theme. A theme is a mechanism for clustering epics, features, and stories by any topic across organizational lines, product areas, and products. A single epic, feature, or story may belong to multiple themes.
Consider, for example, the objective of highlighting a new offering in all communications with customers. This objective is not in itself something users do with the product, but it affects many of the capabilities they use, such as generating customer invoices and renewals. Consequently, you treat the objective as a theme and the work to change the capabilities as epics, features, and stories.
7.11 Analyze Leap of Faith Hypotheses
The next step is to consider how the vision and value proposition for the product will be validated. In traditional product development, this can be achieved by using historical data to make projections. If the product is novel, you can’t use this approach, because there is no history of products in its class. Instead, you validate the business case using an experimental, evidence-based approach—running low-cost MVP experiments to test the hypotheses that underlie the vision.
7.11.1 What Is a Lean Startup?
Leap of faith hypotheses and MVPs are critical tools in the lean startup approach devised by Eric Reis. Before you say, “That’s not for my organization; we’re not a startup,” let me clarify the term. A lean startup is “an organization designed to create new products and services under conditions of extreme uncertainty.”20 The critical factor is not the age of the business—it’s the level of uncertainty regarding the product. In fact, many of the lean startup organizations I work with are not startups in the popular sense of the term. They’re in mainstream business sectors such as insurance, telecom, finance, and government. But they’re involved in lean startup ventures because the products they’re developing are novel. The following are some real examples of lean startups:
20. Eric Ries, The Lean Startup (New York: Random House, 2011), 34.
A telecom developing a self-service site for customers to customize their own plans, where there is extreme uncertainty regarding whether customers will want to use the site.
An insurance company developing products that use data from IoT devices to personalize rates and benefits (as in our BLInK case study). In this instance, there is extreme uncertainty regarding whether customers will be willing to set aside privacy concerns.
A government agency considering offering a loan risk-assessment service. This is a lean startup for the organization because it has traditionally provided this service for free as part of the application process for its core products. Though there was data to indicate that customers would want the service, there was extreme uncertainty about whether they would pay for it.
7.11.2 What Are Leap of Faith Hypotheses?
The MVP process begins with identifying leap of faith hypotheses—critical assumptions about the product that must be true for the venture to be successful. In Chapter 9, “Long-Term Agile Planning,” and Chapter 12, “MVPs and Story Maps,” you’ll learn to use these hypotheses to drive MVP planning, with the objective of testing critical assumptions as quickly and inexpensively as possible.
7.11.2.1 Hypotheses for Change Initiatives
Hypothesis testing is not exclusive to the start of new product development. Continue running experiments to test hypotheses throughout the product’s life. For example, Twitter is currently experimenting with a feature for shared items: the user will see one post with a similar point of view, one with a slightly different point of view, and one that is completely different.21 The learning objective is to test the hypothesis that if users see these different takes, they’ll want to dig deeper into the article or watch the full video. The benefit of running controlled experiments first is that there may be other assumptions and effects the company hasn’t anticipated. Experimentation brings those effects to light so that they can be addressed before the changes are widely released.
21. From an interview with Jack Dorsey. Michael Barbaro, “Jack Dorsey on Twitter’s Mistakes,” The Daily [podcast], August 7, 2020, https://podcasts.apple.com/ca/podcast/the-daily/id1200361736?i=1000487397342
7.11.3 Value Hypotheses
The lean startup approach identifies two broad categories of leap of faith hypotheses: value and growth hypotheses. Value hypotheses are critical, unproven assumptions about the product’s value.
7.11.4 Growth Hypotheses
You can have a product that delivers value to customers yet still does not achieve a fast-enough growth rate to succeed. Fast growth is especially important for new entrants because they need to capture the market quickly before incumbents have a chance to respond. The growth assumptions that must be true for the venture to succeed are referred to, in lean startup, as leap of faith growth hypotheses.
7.11.5 Specifying Metrics
Often, teams consider metrics only after the feature has been implemented. That’s too late to inform development decisions because, by then, critical decisions have already been made. It’s the responsibility of the PO with the support of the business analyst to persuade stakeholders and developers to specify metrics early in the process so that the data can be used to inform investment. The metrics should be refined over time (e.g., as MVPs are planned and tested).
Determine the metrics that will be used to validate hypotheses and measure progress toward goals and objectives. Choose metrics that measure outcomes over ones that measure process steps. For example, measure quality, cost, and hospital readmission rates rather than time to complete medical procedures.
Lean startup provides guidance for defining actionable metrics that isolate the impact of change, as opposed to vanity metrics—measurements that seem to suggest improvement but are, in fact, inconclusive. Let’s examine those guidelines.
7.11.5.1 Vanity Metrics
Suppose a newspaper business decides to launch a project to boost advertising revenues. To assess the program’s success, it measures the publication’s monthly advertising revenue before, during, and after the campaign. Sure enough, revenue rises. They conclude that the program was a success. Were they right?
Not necessarily. There could have been other reasons for the rise, such as the closing of a competing publication. The metric they chose made people feel good about the project but didn’t prove anything. In lean startup, such metrics are referred to as vanity metrics.
7.11.5.2 Actionable Metrics and Split Testing
In contrast to vanity metrics, actionable metrics provide the business with measurements it can act on to make decisions. The problem with the previous metric example was that it didn’t mask out the background noise of everything else happening in the environment. To do that, you need to add a control group subject to the same context as the test group, except that it doesn’t experience the intervention you’re measuring. This approach is referred to as split testing or A/B testing.
Returning to our newspaper example, we could expose the new program to a small group (cohort) of customers while leaving another group unexposed—and measure the difference between ad revenue gains for each group. If there is a net improvement in revenue for the test group but not for the control group, the increase must be due to the program, since environmental changes would have affected both groups equally.
You can use this approach with more than two groups as well. For example, you can measure the conversion rates for two groups—each exposed to a different change in a user interface—and compare those measurements against a control group that doesn’t experience any change.
Metrics to test value hypotheses include the following:
Number of daily active users or number of monthly active users (a measure of stickiness)
Conversion rate from free trial to subscription
Frequency of opens
Average session length
Total time in the application (daily, weekly, monthly)
Engagement retention (percentage of initial users who return to the application within a given period)
To block out environmental factors, perform split testing and take care to measure the differences in values between test groups and control groups.
Metrics for growth include the following:
Referral rate: Average number of referrals made by each user.
Net promoters NP = % Promoters − % Detractors,22 where
22. Frederick F. Reichheld, “The One Number You Need to Grow,” Harvard Business Review, December 2003, https://hbr.org/2003/12/the-one-number-you-need-to-grow.
– % Promoters = percentage of customers who respond with a 9 or 10 to the question, “On a scale of 0 to 10, how likely is it that you would recommend the product to a friend or colleague?”
– % Detractors = percentage of customers who respond with a 0 to 6.
Research shows a correlation23 between high NP scores and growth. High NP also means a low cost to acquire a customer (CAC)—since existing customers do much of the marketing at no cost.
23. See Reichheld, “The One Number You Need.”
Growth rate of monthly active users (MAU), where MAU = # unique users who have visited a site or used an application at least once during the month
Bounce Rate: % of customers who visit and leave immediately
7.11.5.3 Actionable Metrics for Enhancements
The preceding guidelines about metrics also apply once the product is established and undergoing continual improvement. Specify actionable metrics to measure the value of proposed features or revisions. As the feature is developed, test out solutions with users and collect actionable metrics. Use the resulting data to evaluate the effectiveness of alternative solutions for the feature. During beta testing, collect and analyze actionable metrics to validate the feature and determine whether or not to include and support it.
7.11.6 Hypotheses in Discovery-Driven Planning
Financial planners face the same challenge as do product developers when dealing with an innovative product: how to create a plan when there is extreme uncertainty surrounding the product and the market for it. Discovery-driven financial planning extends the MVP approach into the realm of financial planning. The financial planner works backward from the outcomes deemed necessary for a venture to be successful in order to determine the financial hypotheses or assumptions that must be made. Then the planner devises a strategy to test those assumptions in the market as quickly as possible. The steps in this process are as follows:24
24. Based on the process described by Christensen and Raynor, with some changes made to the number of steps and their activities. Clayton M. Christensen and Michael E. Raynor, The Innovator’s Solution (Boston: Harvard Business Press, 2003), 227–229.
Identify the required future outcomes (targets).
Identify the assumptions that must be made for those targets to be met by preparing a reverse income statement.
Create a plan to test those assumptions in order of importance.
Implement the plan: Test the assumptions.
Learn: Make strategic investment decisions based on test results.
Examples of financial assumptions discovered and tested through this process include the following:
Cost of production
Cost to acquire a customer
Price that customers will be willing to pay for the product
Packaging and shipping costs
Product lifespan
7.11.7 Assumption Checklist
Provide more information about hypotheses or assumptions in an assumptions checklist. Table 7.6 illustrates an example.
7.11.8 Using a Milestone Planning Chart to Plan Assumption Testing
Use a milestone planning chart to plan the timing of assumption testing. Table 7.7 illustrates some examples of milestones.
Table 7.7 Milestone Planning Chart
Milestone Event Completed |
Assumptions to Be Tested |
Prototypes created |
(A1) A price advantage of 10 percent will be enough to lure customers away from incumbent suppliers. |
Pilot production |
(A2) Production costs can be kept below $100/unit. |
7.12 Chapter Summary
Here are the key points covered in this chapter:
Root-cause analysis is a set of techniques for tracing effects back to their initial causes. The approach includes the Five Whys technique and cause–effect graphing.
The product vision statement is a short description of a future when the product is used by its target market.
Perform stakeholder analysis as early as possible and continue it incrementally throughout the development lifecycle.
Represent business goals and objectives as themes.
Represent customer objectives as epics and features.
Leap of faith hypotheses are assumptions that must be true for the product to be viable. Identify them at the start of a venture so you can plan to validate them in the market as soon as possible.
7.13 What’s Next?
In Chapter 8, we’ll look at activities associated with seeding the backlog—the determination and specification of the features and other work items associated with the product.