
Chapter 7. End-User Experience Monitoring and Performance
Now you see it—now you don’t.
Anonymous
Having discussed a best-practice approach to what could be considered static performance testing in the preceding chapters, I want to now discuss the importance of measuring and understanding the end-user experience. To aid in this process I have called on my friend and colleague, Larry Haig, to provide much of this chapter’s content. Larry’s many years of experience with customer engagements, both while working for one of the major performance vendors and as an independent consultant, have made him one of the industry’s leading lights in end-user experience monitoring.
Traditional performance testing is designed to compare a system with itself, using a variety of infrastructure and application KPIs (as discussed earlier in this book). If effectively designed and executed, this will provide a degree of performance assurance. However, crucially, this approach gives no absolute extrapolation to the experience of end users of the tested application. This chapter and the next address the subject of external monitoring, both in its wider aspects and as an extension to performance testing. They can be read as a standalone guide to effective end-user experience management, looking at the wider situation of ongoing application performance assurance, as well as an exploration of end-user satisfaction as a component of performance testing (the core subject of this book).
There is no shortage of external monitoring products available, and I have listed some of the more well-known in Appendix C. License costs vary from nothing at all to hundreds of thousands of dollars or more over a calendar year. All seek to answer the question, how well is my site performing outside my data center?, and all will provide you with an answer—of a sort. How relevant the answer is depends upon the nature of the question, and the stakes are high particularly for ecommerce: £15.9 billion was spent online during Christmas 2012 in the United Kingdom alone (retailresearch.org), and the research shows that poor performance is a key determinant of site abandonment.
End-user performance, not the number of green lights in the data center, is what determines whether your investment in application delivery is a success. Further, environmental simplicity is a distant memory, at least as far as major corporate applications are concerned. Effective strategies are required for you to understand external application performance and obtain timely, relevant data to support effective intervention. This chapter aims to supply those, and to help performance professionals design appropriate monitors for all types of content, whether native HTML, multimedia, SMS, affiliate-based content, or anything else. The importance of understanding key user behaviors and devices, as well as being aware of device trends, will be emphasized.
Ultimately, as this book has hopefully demonstrated, performance is not an absolute. Key performance metrics need to be determined relative to user expectation—which is increasing all the time. A recent review of historic benchmark performance trends by my own company, Intechnica, showed an average increase in landing page performance across tested sectors of one-third. This was based on retail, media, and banking website performance over an average of the three years from September 2010 to October 2013. Customer expectation follows this trend, so standing still is not an option. You should bear this important factor in mind for all web applications, although it is especially true of ecommerce sites, given their direct revenue implications.
This chapter is designed to ensure that the crucial importance of end-user delivery is not forgotten as a component of application performance. It provides a bird’s-eye view of external monitoring, from first principles to some more detailed considerations, with (hopefully) useful further reading suggested at the end. Given the prominence of Internet browser-based applications, they are the primary area of consideration, although the underlying principles apply equally to nonweb situations. Some thoughts about relevant tools and techniques are also included.
What Is External Monitoring?
A good working definition of external monitoring is simply the use of tools and techniques to provide and interpret IT application response metrics from outside the edge servers of the core application delivery infrastructure (that is, the data center). At first glance, the simplicity of this definition is immediately compromised by the inherent complexity of most modern web-based applications.
As an example, my company recently examined 10 major UK ecommerce sites (see Table 7-1). These contained between them over 70 distinct third-party affiliates, even after we excluded content delivery network (CDN) providers that were directly associated with delivery performance. Further, core site content is often distributed. Examples include the external delivery of static content by a specialist provider (e.g., Adobe Scene 7), the use of cloud-based applications (often for reasons of high scalability), or the deployment of high-redundancy distributed environments to provide disaster recovery capability.
| Site | # Non–performance-related affiliates (hosts) | End-user performance overhead (total response time, search ATB transaction, in seconds) |
|---|---|---|
Very |
43 |
18.7 |
Tesco |
1 |
0.2 |
Sainsbury |
27 |
11.6 |
Ralph Lauren |
11 |
1.0 |
Next |
1 |
0.5 |
New Look |
53 |
23.4 |
Marks and Spencer |
27 |
10.3 |
John Lewis |
19 |
3.2 |
Debenhams |
2 |
15.9 |
ASOS |
49 |
10.9 |
Why Monitor Externally?
The power and sophistication of application and infrastructure monitoring has increased greatly in recent years, much as a result of the wholesale move to distributed web deployment of core applications. One argument is that such on-premise monitoring is sufficient for effective risk management of application performance; however, external monitoring has a vital role to play.
Consider modern developments—service-oriented architectures, distributed cloud-based hosting—together with the plethora of third-party components included in many sites that must be considered performance related (CDNs, application delivery controllers) and revenue centric (personalization, ad servers, web analytics). Anything that is provided from or includes delivery components outside the application’s edge servers requires management, and external monitoring enables it.
The various types of external monitoring will be considered in “External Monitoring Categories”, but the key benefits of an outside-in testing approach can be summarized as follows:
-
Impact analysis: external testing, particularly with an end-user dimension, provides visibility as to the business relevance of a particular issue—that is, its likely revenue impact. Such insight enables operations teams to effectively prioritize performance interventions.
-
Predictive understanding: synthetic external monitoring enables testing of application performance in the absence of baseline traffic—for example, new sites (or prelaunch upgrades), new markets, and new products.
-
Related to the preceding point is the ability to obtain proactive data on the performance of particular functions or processes. This is particularly valuable when previous difficulties have led to significant reductions in relevant visitor traffic (e.g., failure with a major browser version or wireless carrier).
-
Careful test design enables objective (rather than inferential) data to be obtained—at the transaction, page, individual object, and subobject level.
-
Active monitoring permits contextual understanding and goal setting (e.g., competitive benchmarking).
-
Finally, this testing approach helps you obtain a detailed understanding of all external factors involved in delivery to end users; for example:
-
Third-party service-level management
-
Internet service provider (ISP) peerage effects
-
Validation/assurance of key user performance
-
A final point regarding end-user understanding: it is sometimes argued that there is no point in understanding performance in true end-user conditions (wireless mobile connectivity, limiting conditions of bandwidth, ISP peerage, consumer PC system constraints, and similar). The logical extension of that thinking is that testing should be undertaken only in completely stable, clean-room conditions, as otherwise you may not see the forest for the trees.
There is certainly an important place for best-case testing, and test conditions should always be consistent and understood to enable effective results interpretation. However, the important point is that your application lives in the real world, which is by its nature heterogeneous. Understanding whether an issue affects a particular class of user enables you to make appropriate interventions.
In some cases, these interventions can be as simple as putting a text message on the site advising particular users that their performance will be compromised (or instituting some form of elegant degradation of functionality).
Even if issues are outside the ability of operations teams to address directly, access to objective data will enable them to be addressed through their third party (i.e., ISP, CDN provider).
In summary, the essential function of external monitoring is to act as a “canary in a coal mine” (Figure 7-1). Nineteenth-century miners needed to know when they were facing a problem—in their case, odorless (and deadly) carbon monoxide gas—the canary provided the understanding that: (a) a problem existed, and (b) the miners needed to exit stage right!

Figure 7-1. External monitoring can be likened to the proverbial canary in a coal mine
External monitoring will not, except in certain specific edge cases, isolate the root cause of an issue, but if used appropriately it will provide impact-based understanding and isolate the area in which the issue exists. A single relevant example: applications exhibiting poor performance at high-traffic periods of the business demand cycle are strong candidates for diagnostic performance load testing. In short, external monitoring is essential to relative, contextual management of application performance.
The increasingly plural nature of modern web applications and components—whether mobile devices, server push technologies, service worker delivery, adaptive elements, or similar—are likely to present challenges to effective external monitoring in the future, making a new “best practice” an increasingly important and evolving requirement. However, this chapter provides some pointers on approaches to use in the current situation.
Many tools exist to provide end-user performance visibility. However, regardless of the competing claims of the individual vendors, there are some fundamental differences that should be understood. Any single type of testing has limitations as well as advantages, and one size most certainly does not fit all.
External Monitoring Categories
In the parlance of external analysis, all monitoring may be grouped into one of two core types:
- Active
-
Also known as synthetic monitoring, active monitoring is effectively prescheduled, repetitive automated testing from known testing nodes (or node categories such as “Chicago-based end users” in some cases).
Active monitoring is delivered by tooling that replays scripted use cases much in the manner of performance test automation. The key difference is that replay is normally from the perspective of a single virtual user per device deployment and usually involves a complete UI or browser session—i.e., a headed replay.
This tooling typically presents as a web-based management console to manage the deployment of multiple remote agents, a scripting component to record and create the use cases for replay, and an analysis dashboard to monitor and interpret results. It is not uncommon for a range of integrations to be available, and this capability is now part of many application performance management (APM) toolsets. You can find a list of leading vendors in Appendix C.
- Passive
-
Also known as real-user monitoring (RUM), user experience monitoring (UEM), and some other similar acronyms, passive monitoring relies on analysis of visitor traffic from the operation of code snippets residing either in the headers of instrumented pages, or in certain cases, dynamically injected into client browsers by the host application server.
Active and passive monitoring vary in sophistication depending upon the tooling employed.
Active Monitoring
The most basic (and original) active monitoring was simply to ping a website and listen and time the return of a test byte, and this still constitutes the entry level of basic availability monitoring. However, while this approach is inexpensive (or free), the actionable visibility it provides is extremely limited.
In the first place, these tools are only testing the availability of the base HTML object; they offer no visibility of the other page components that make up a full download (and therefore successful user experience), let alone those of complex multistep transactions. A large white space with a red cross in it where your banner image should be is unlikely to inspire confidence in your brand.
The second key limitation is linked to the first. Such tools can rapidly tell you that your site is down, but what do you do then? Without effective object-level information, rapid diagnosis and issue resolution is extremely difficult. Such a basic level of analysis is far less timely in any case than advanced predictive diagnostics, which will often alert you to an impending failure before it occurs (which should be a goal of your performance monitoring strategy).
It is important to emphasize that however it is obtained, some understanding of application availability is essential. This understanding cannot be obtained from other types of passive analysis, which are, by definition, visitor analyses. All of the potential users who fail to reach a site due to the dozens of potential external issues (e.g., DNS resolution failure, ISP peerage) are by definition not visitors. Most professional active monitoring tooling today provides for full object-level visibility, combined with the ability to script transactions through the site. Table 7-2 summarizes the test perspectives.
| Test origin | Purpose |
|---|---|
Tier 1 data center, industrial-capacity test node |
“Clean room” testing, (theoretically) free of bandwidth or test system constraints. For trend/iterative goal management, competitor comparison, third-party SLA management (excepting CDNs). |
End user (PC, mobile device) |
“Dirty” but real-world data. Provides insights into performance or limiting conditions (e.g., of bandwidth). For CDN, performance assurance and quality of service monitoring in existing and new markets. |
Private peer |
Testing from known locations (e.g., specific high-value customers or departments/locations within a corporate organization). |
Site visitor performance analysis |
Also known as real user or user experience monitoring. Also known as EUM or RUM. Records and analyzes the performance (possibly together with other metrics, e.g., transaction abandonment) of all successful visitors to a site. |
Native mobile application |
Captures performance and associated data (e.g., crash metrics) of the users of native mobile applications. Typically cross-device but operating-system (iOS, Android) specific. |
Figure 7-2 illustrates the use of multiple active test perspectives to provide a prescheduled heartbeat test. These results, particularly when combined with the visitor base metrics listed in the next section, can provide a comprehensive model of end-user response.
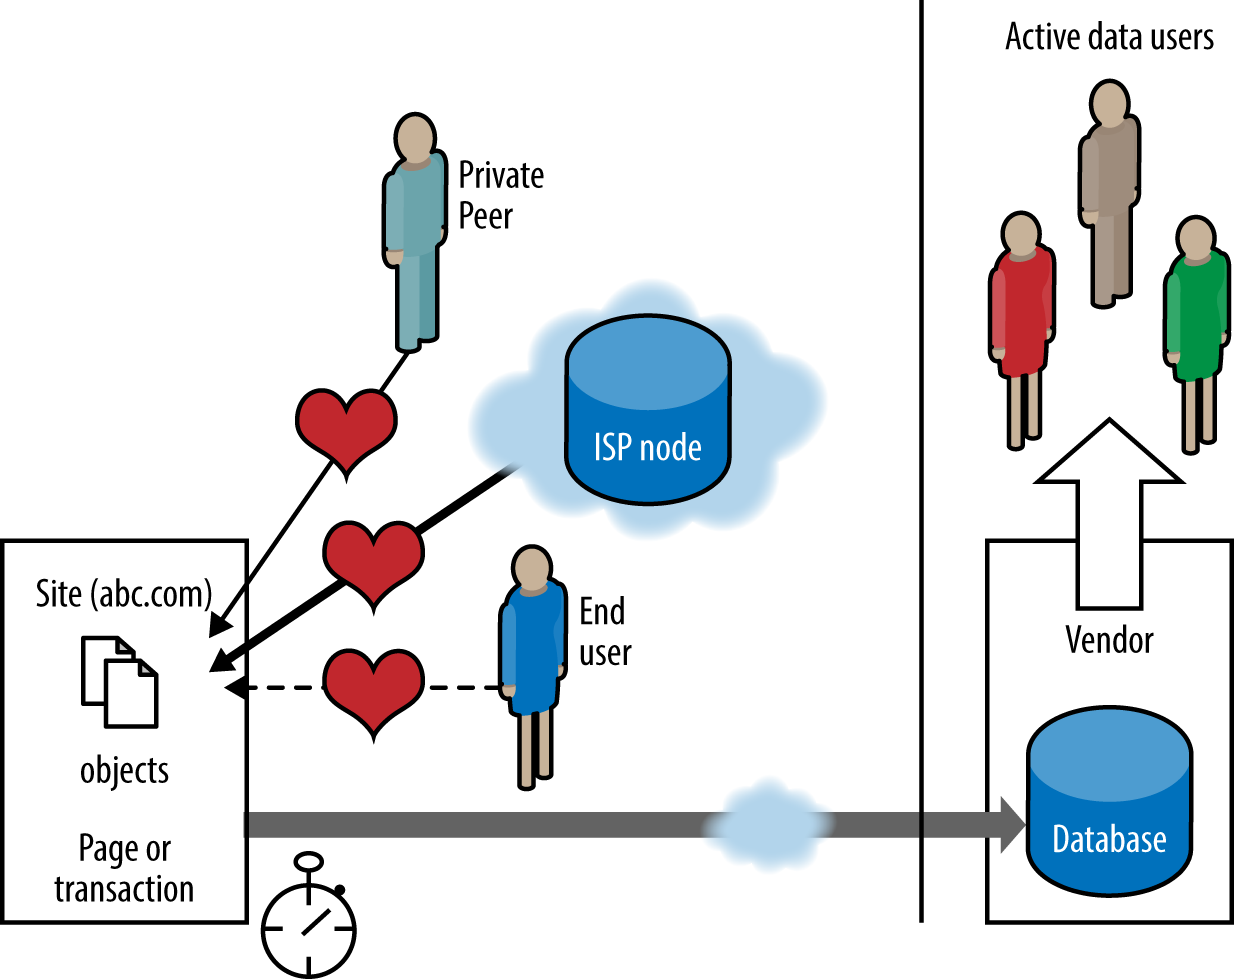
Figure 7-2. Active (synthetic) monitoring—multiple perspectives
Output Metrics
Active monitoring includes the following key metrics:
- Availability
-
The key metric from active monitoring. Because such monitoring is typically prescheduled, the “fate” of every active test in terms of success (access to the test site) or failure is known. In contrast, passive monitoring (RUM) analyzes the response of successful visits to the site only.
- Total response time
-
It is important to understand what the page load or response time reported by active monitoring systems actually represents. Such tooling operates by effectively listening to the network traffic associated with a web page request. Thus it records the total time for page delivery—that is, the elapsed time between the receipt of the HTTP request and the delivery of the final byte of data associated with the page. This response time and the underlying component-level data is extremely valuable in understanding comparative performance, and in the isolation of some categories of application issues. Although page response times will be longer in end-user test conditions that make use of consumer-grade devices over tertiary ISP or wireless carrier links, this metric differs from the browser fill time experienced by an actual site user. This latter metric, also known as the perceived render time or some variant thereof, is recorded by some of the more sophisticated passive monitoring tools. Figure 7-3 illustrates the difference.
ISP Testing Best Practices
When configuring ISP-based testing, you should consider the following points:
- Connectivity
-
This class of testing is designed to be best case. It is crucial to ensure that no constraints or variations in the test environment exist, either of connectivity or test node. The major vendors of this type of monitoring will either deploy multiple nodes within tier-one ISP data centers close to the major confluences of the Web, or locate testing within LINX exchanges. The latter approach ensures that a range of ISPs are selected in successive tests, while the former enables specific peerage issues to be screened (at least among the ISPs for whom test nodes are available). Avoid tooling based in tertiary data centers where high levels of minimum bandwidth cannot be assured.
- Triangulation
-
Undertake testing from across a variety of ISPs and/or test nodes. Doing so ensures that any performance disparities reported are effectively isolated to the test site concerned (assuming that the issue is detected across multiple nodes/tests), rather than potentially being an ISP- or test-node-specific issue—which could be the case if testing was undertaken from a single node. Ideally, you should use three or four nodes, distributing testing evenly across each.
- Location
-
When selecting vendors, and in designing tests, test from multiple locations with a similar latency. It is not essential for all test nodes to be from the same country as the target, but take care to ensure that, if not, they are in regional locations on the primary backbone of the Internet.

Figure 7-3. Total page load time (active monitoring) versus perceived render time
- Frequency
-
With the advent of passive monitoring (RUM), which by its nature is (or should be) continuous, the requirement for high-frequency active monitoring has declined. A distinction should be made between ping (availability, aka up/down testing) where test frequencies tend to be very high and strategic, and full object-level or use-case monitoring. The key is to have recent data and trend information available to drill into when a potential issue is flagged. Thus, a heartbeat test frequency of, say, one or two tests per hour from four nodes giving a nominal frequency of one test every 7.5 minutes should suffice. Test frequency can always be increased during active issue investigation if required.
- Agent type
-
As a general rule, the primary browser agent you use should reflect the predominant browser in the country being tested (or the browser/version with the highest penetration among your customer base if different). Browser usage changes significantly over time, and some entrenched patterns of usage (such as that of Internet Explorer 6 in China, for example) can be expected to change rapidly following withdrawal of support and malware protection by the vendor.
- Analysis
-
Automated analysis is a useful feature of some tooling. Even if present, it provides no more than a shortcut to some of the more common factors to consider. A structured issue isolation model should be adopted and followed.
Synthetic End-User Testing Best Practices
Synthetic end-user testing differs from backbone in that it is essentially about quality of service (errors and performance) rather than ideal, comparative external tests. It is not an alternative to active ISP-based and passive (RUM) testing, but rather a supplement. Some important differences include the following:
-
Public peers have the advantage of multiple tertiary ISPs. Consider black/white listing and PC specifications.
-
Private peers are useful for testing from known locations. They can be particularly useful in testing in closed intranet application situations, or from specific partner organizations, for example. Private peer-agent deployment has also been successfully used for scheduled testing from specific high-net-worth customers (e.g., in the gaming industry).
-
Note that end-user response data is always inconsistent—but so is the real world. Artificially throttled testing from data center test nodes is cleaner, but does not represent the heterogeneity of actual usage conditions. It also tests from very few, fixed locations with constant conditions of ISP connectivity.
-
Connectivity—mapping to typical/desired users and use cases—helps you to understand site performance in limiting conditions. It is particularly important for large-footprint sites or those delivered into regions with poor Internet infrastructure.
-
Mode, or wireless connectivity, is essential to understand the performance of mobile users, both from a device and network perspective. Hardwired ISP testing of mobile users should never be used other than as a reference point, because the results cannot be extrapolated to the real world. Synthetic testing of mobile end users has limitations, however, as it typically occurs from fixed test nodes. This has the advantage of more replicable testing in terms of signal strength but may suffer from saturation of the local cellular mast, which introduces distortion into the results. Triangulation of results (as with backbone tests) is particularly important, as is careful attention to the connection speed: 3G has a maximum theoretical bandwidth of more than 6 Mbps, but connection speeds of less than 100 Kbps are not uncommon in remote areas and situations of high traffic.
-
Consider the browser agent used, as it is not usually possible to read across backbone and last-mile tests measured using different browsers (particularly if one of them is IE).
-
Peer size is an important factor. Due to the inherent variability of testing from end-user machines, you must test from sufficiently large clusters to enable average smoothing of the results. You must carefully consider the peer results selected for object-level analysis, and engage in progressive “pruning” by blacklisting any specific test peers that consistently produce erroneous results. Take care to operate blacklisting using rational exclusion criteria in addition to poor performance; otherwise, you may be actively removing evidence of a fault that you should be dealing with. If testing from public end-user machines, adopt a minimum peer cluster size of 7 to 10 nodes as a best practice to enable meaningful baselining. Peer groups should be selected from machines and connectivity bandwidths of similar characteristics. Results should be further filtered where possible to remove outliers due to rogue low (or high) connectivity tests.
All these caveats can lead you to think that scheduled end-user monitoring is of no value in a passive (RUM)-based world. Although continuous scheduled end-user monitoring may be of limited utility (for reasons, among others, of cost), this class of monitoring can prove invaluable in isolating or excluding unusual issues (e.g., tertiary ISP peerage, DNS resolution issues, CDN assurance). The ability to study object-level data from end users and error codes provides a useful view of quality of service to end users (see Figure 7-4), particularly in areas where base traffic is low (e.g., new markets).
Passive Monitoring
Passive monitoring is typically based on the capture of performance metrics from end-user browsers, although custom instrumentation is possible for any client type. Unlike active monitoring, which is essentially proactive in nature, passive monitoring requires visitor traffic, as you can see in Figure 7-5. It is also known as real-user monitoring (RUM), user-experience monitoring (EUM), and other similar names. I use passive (RUM) going forward.
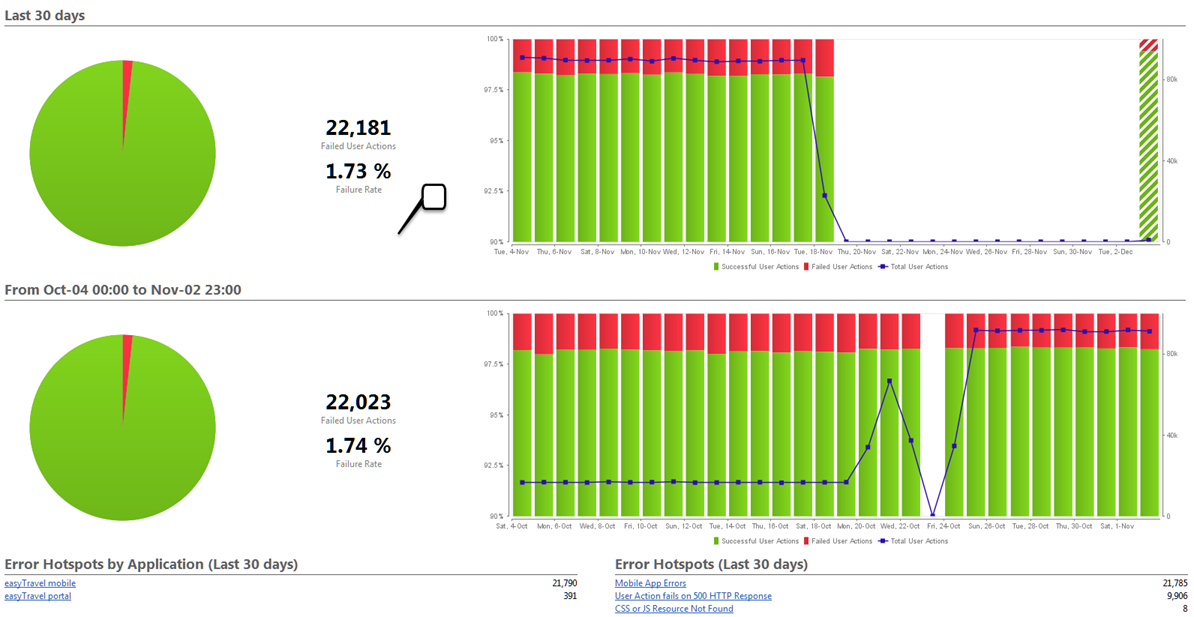
Figure 7-4. Quality of service—fatal errors generated by UK ecommerce site landing page (30-day test window)
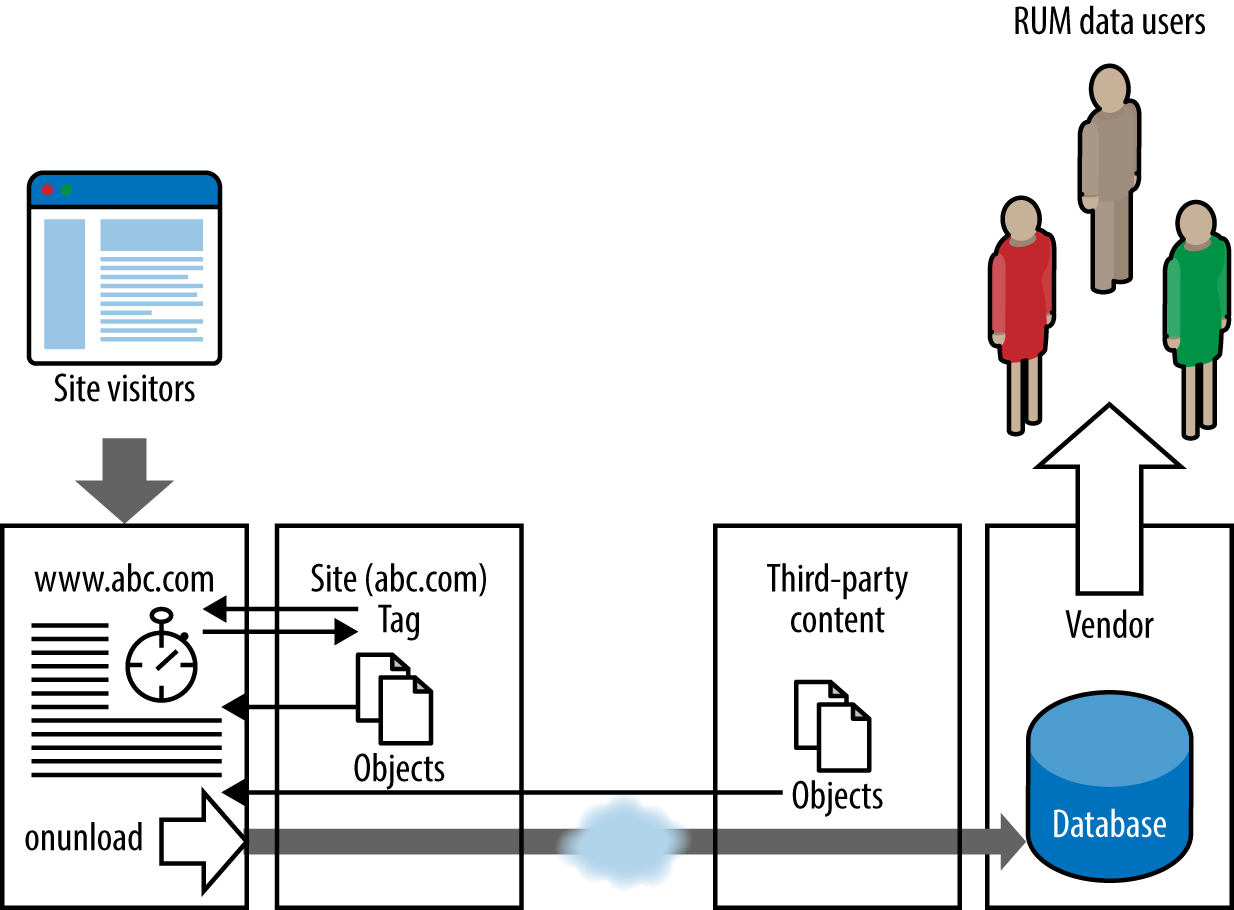
Figure 7-5. Passive (RUM) monitoring
How Passive Monitoring Works
The most common technique for browser clients is to place a JavaScript tag or beacon in web page headers designed to detect user traffic. In most cases, the tag permanently resides on instrumented pages, placed via a simple cut-and-paste or a global include statement. EUE toolset vendors are increasingly offering the option of dynamic injection of JavaScript into the visitor browser by the site application servers during the page request.
The code executes, writing cookies as needed to capture browser information, navigation metrics, and potentially other data such as connection speed or ISP. After the on-unload step, data is passed back using a GET request via HTTP or HTTPS to the vendor database. This data is then made available via appropriate dashboards in the product client.
Passive (RUM) tooling is typically provided either as a standalone product or as part of an integrated end-to-end visibility extension to APM tools. While the mode of action is similar, APM tooling has the advantage of associating browser-side performance metrics with those of the delivery infrastructure, whether application (often to code method level) or hardware. A rapid growth in recent years has followed the publication (by W3C) and adoption by many browser vendors of standard navigation and resource metrics. Although broadly similar from a basic technical standpoint, passive (RUM) tools do differ fairly substantially. Some key considerations are listed here:
- Sophistication/coverage
-
As previously mentioned, many passive (RUM) products are based on the standard W3C navigation metrics, which means they are not supported in all browsers, primarily older versions and Safari. In certain cases, basic performance data is collected from these metrics to supplement the core metrics. Key aspects of sophistication include the following:
-
Ability to record user journeys: Less evolved products act at the individual page level.
-
Ability to capture and report individual session-level data: This includes reporting on business-relevant metrics, such as transaction abandonment and shopping cart conversion by different categories of user.
-
Detailed reporting: This includes reporting on bounce rate, stickiness (time on site), abandonment, and similar.
-
Ability to record above-the-line performance: Browser fill or perceived render time.
-
This metric is rarely estimated by active monitoring tools (the only one of which I am aware is WebPagetest). Therefore, passive (RUM) tooling supporting this metric provides a useful additional perspective into end-user satisfaction.
- Real-time reporting
-
Tools vary in two principal ways with regard to data handling:
-
How long captured data is stored. As with other monitoring, the problem for vendors storing customer data is that they rapidly become data storage rather than monitoring companies. However, the ability to view trend data over extended periods is extremely useful, so individual vendor strategies to manage that requirement are relevant. This problem is exacerbated if object-level metrics are captured.
-
The frequency of customer data updates. This can vary from 24 hours to less than 5 minutes. Near-real-time updates are relevant to active operations management, while daily information has limited historic value only.
-
- All traffic or traffic sampling
-
Because passive (RUM) data is inferential in nature, it is important to capture all visitor traffic rather than a sample. Some tooling offers the option of user-defined sampling, often to reduce license costs. This is unlikely to be good practice except possibly in the case of extremely high-traffic sites. Within Europe, this situation is exacerbated by EU legislation enabling individual users to opt for do-not-send headers, which restrict the transmission of tag-based data.
- API access
-
Passive (RUM) tooling will always provide some form of output charting or graphing. You can derive additional value by integrating passive (RUM) data with the outputs from other tooling. This is particularly true for those products that do not report on session-level data, such as conversion and abandonment rates. In such cases, it may be advantageous to combine such data from web analytics with passive (RUM)-based performance metrics.
- Page or object level
-
Although, theoretically, all products could be extended to capture object-level rather than page-delivery metrics, this is not the case with every passive (RUM) offering.
- User event capture
-
This is the ability to record the time between two events (e.g., mouse clicks). Such subpage instrumentation is valuable in supporting design and development decisions.
- Extensibility
-
This is the ability to capture and integrate nonperformance user data. Examples include associating user login details with session performance, and collecting details of the originating application or database server.
- Reporting
-
This metric refers to the extent, type, and ability to customize built-in reporting.
The strength of passive monitoring (RUM) lies in the breadth of its reach in terms of browsers/versions, geography, ISP, and similar. High-level patterns of performance—for example, regional CDN performance—and national performance delivery deficits in challenging markets can be identified. At a more granular level, patterns of performance between browsers or ISPs can readily be determined, which in the case of smaller players would be unlikely through active monitoring.
Passive monitoring (RUM) has two primary weaknesses:
- The inferential nature of the results
-
Passive (RUM) data, being based on visitors, is essentially reactive. It does not support the proactive testing of particular markets, devices, or functionality. Different patterns of usage in different markets could be a reflection of cultural differences or of functional/nonfunctional issues, requiring active monitoring to accurately determine. By definition, prospective site visitors who fail to reach the site are not visitors, so the concept (and metric) of availability is not valid.
- The absence of object data (in the majority of cases)
-
This is extremely limiting if you are seeking to isolate the cause of a performance issue.
Pros and Cons of Active Versus Passive Monitoring
This section summarizes the key advantages and disadvantages of active (synthetic) and passive (RUM) external monitoring.
Active Pros
-
Enables you to target monitoring to issues, browsers, location, conditions, content, services (e.g., multimedia, payment service provider)
-
Offers round-the-clock (if required) visibility in periods of low base traffic
-
Provides consistent comparative data (internal or competitive)
-
Allows you to monitor any public site (benchmarking)
-
Is easily repeatable
-
Can capture host-level data
-
Allows full-object capture and single-object testing
-
Enables availability testing
Active Cons
-
Is not real world
-
Provides only a subset of true conditions
-
Can be conducted only with limited frequency (depending upon a realistic budget)
Passive Pros
-
Provides true visitor understanding
-
Allows discovery of origin-related issues
-
Provides an aggregate understanding of application components (CDN performance, for example)
Passive Cons
-
Is potentially limited in new markets because visibility depends on visitor traffic
-
Is inferential—that is, not based on proactive test design
-
Can be counterfactual (e.g., poor quality of service producing low regional traffic volumes)
-
Offers limited understanding in that results are not (usually) object based, can be limited by browser coverage, and can be skewed by cookie blocking from end users
Tooling for External Monitoring of Internet Applications
Tooling choices for external monitoring are numerous, and need to be considered from multiple perspectives. These include the following:
-
Technology to be monitored: native mobile, RIA, server push
-
User characteristics: location, browsers, mobile devices
-
Application features and components: third-party content, multimedia, SMS
-
Performance interventions: for example, CDNs, ADC (ability to filter, A/B test as required)
-
In-house skills and resources: outsourcing (tooling, agency) versus self-service
-
Application development strategy and goals
-
Performance management strategy: in-house or outsourced
-
Realistic budget, taking account of both opportunities and risks
-
Any givens with regard to technology or tooling
As reiterated during this chapter, we would strongly recommend considering tooling holistically, both across the DevOps life cycle (code profiling, continuous integration) and in the context of an integrated data management approach. This approach, for example, could seek to deliver a combination of tooling with minimal products and feature overlap to support, among others:
-
Performance testing
-
External monitoring
-
Application performance management (all tiers, including mainframe if present)
-
Network management
-
Database support
-
Runbook automation
-
Reporting and dashboarding
The ability to check many boxes is usually the prerogative of the larger vendors. However, given that much extensive tooling is obtained by successive acquisition, take care to ensure that multiple products are integrated in practice, not just at brand level. It is highly recommended that you undertake a structured comparative proof-of-concept trial to expose the various salespersons’ claims to the harsh light of practical usage. Gartner Inc.’s Magic Quadrant assessments can provide a useful stepping-off point for navigating the plethora of products and vendors in the marketplace. A few words of caution, however: some of Garner’s product classifications can feel somewhat contrived, its underlying selection criteria do change over time (and should be considered with your particular situation in mind), and the rate of introduction and consolidation in the tooling world can outpace the best efforts of even the most experienced to call it.
Tool Selection Criteria
A number of professional tools exist for external monitoring. As with any other competitive market, the cost and detailed characteristics of individual tools will vary. You should make your selections with knowledge of these details, in the light of the needs and constraints of your particular business. While several tools may fit the bill, mixing more than one of the same (e.g. active testing) is not good practice. Differences in test agents, design, test location, and more can make comparing results a difficult undertaking. At the very least, you should undertake a detailed parallel test study to determine the offsets between the tools, although these may not be consistent or linear.
In selecting suitable tooling, here are the key considerations:
- Technical sophistication
-
Ability to detect and isolate issues, and to support evolving site components such as RIA technologies (e.g., Flex); server push functionality; scripting filtering and custom coding; and validation for logins, message-based components (SMS), and multimedia stream monitoring (encryption codices, formats, and adaptive streams). Specific features within some tooling of potential benefit include the following:
-
Automatic analysis and scoring against key performance factors and page components
-
Alert sophistication and integration with third-party alert management tools
-
Screen capture and trace route on error or success
-
Ability to parse and trace individual (e.g., third-party) object performance
-
Ability to test complex transactions (e.g., select random or nth product from a list, select only in-stock product)
-
- Ease of use of product with regard to scripting, test commissioning, and reporting as well as the speed of response of vendor support and script modification.
-
The relative importance of these factors will depend on the time criticality and dynamic nature of the application(s) monitored and the extent of in-house skills.
- API
-
Ability to integrate data, alerts, and so forth with external systems
- Report flexibility
-
Ability to compare multiple perspectives (e.g., traffic, RUM, mobile, backbone) on single chart
- Cost
-
As with all tooling, total cost of ownership should be considered—licenses, personnel, training, and support. Dependent upon the flexibility of the tooling and the licensing model, strategies to mitigate cost include the following:
-
Maintenance windows (change test frequency outside core business hours)
-
“Follow the sun” testing
-
Continuous and active heartbeat testing
-
- Flexibility/range of test perspectives (relevant to your particular site)
-
It is important to bear in mind that (a) all monitoring tools will provide a response metric of some kind, but (b) as performance analysts—or at least consumers of this data—we are required to draw business-relevant insights from them, and the measurements can and do vary wildly between vendors and across the various products offered by given providers (see Figure 7-6). The first key to effective external monitoring is to understand the question you wish to ask and select tooling that will enable you to ask it.
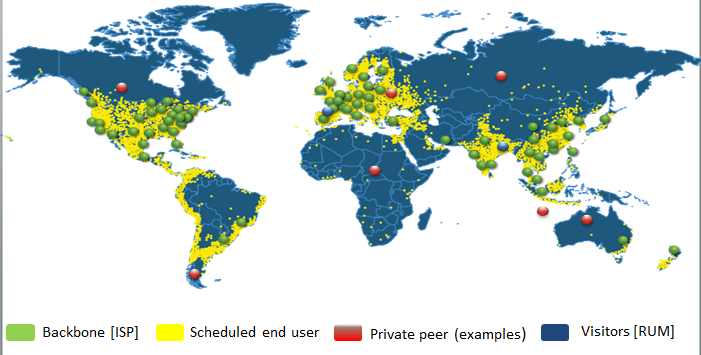
Figure 7-6. External monitoring—a many-headed beast
Tool selection considerations relevant to active (synthetic) and passive monitoring (RUM) differ, as we’ll discuss next.
Active Monitoring Tooling
There are a relatively small number of active monitoring solutions to choose from. The predominance of web technology and the relative ease of passive monitoring (RUM) deployment makes RUM the easy option. As we will discover, active (synthetic) monitoring provides unique insights that RUM cannot offer, but is more complex to deploy and configure and is not intended for discrete monitoring of end-user performance. Synthetic monitoring typically has capability beyond just browser clients into thin-client technology, such as Citrix, and legacy fat clients such as SAP GUI.
-
Clean-room (ISP backbone) testing.
-
Test node location and class, connectivity/assurance.
-
Number of nodes in relevant regions (minimum three at same round-trip latency).
-
Number and type of test agents—native browser agents (and type) versus custom agents.
-
-
-
Consumer-grade end user versus fixed-bandwidth data center testing.
-
Number, quality, and control of test peers. It can be important to test from particular tertiary ISPs or at specific bandwidths:
-
Mobile device testing—emulation versus real devices.
-
Wireless carrier/known bandwidth versus hardwired ISP connectivity.
-
-
-
The importance of controlled test conditions. Figure 7-7 illustrates the effect of wireless connectivity conditions. Paired 3G wireless carrier and WiFi-based tests for a panel of major UK ecommerce sites are shown. Note the high (and variable) discrepancy between the readings.
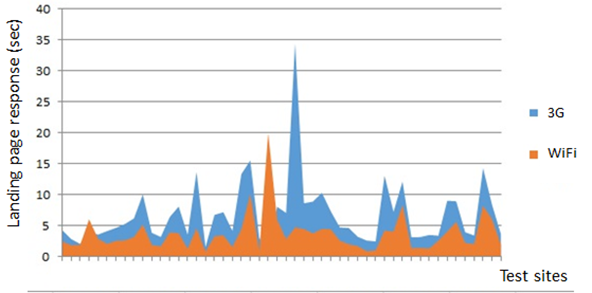
Figure 7-7. Test-panel mobile landing-page response, 3G versus WiFi
Passive Monitoring Tooling
At the time of writing there are over 50 passive (RUM) products available. Their large growth has been driven by the W3C’s publication, and the subsequent adoption by many browser vendors, of a number of performance-related metrics. The metrics most relevant to this discussion are for navigation and resources.(see Figure 7-8).
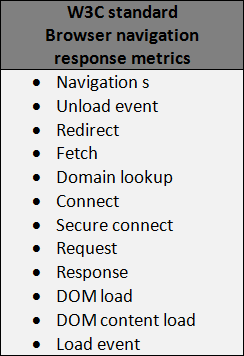
Figure 7-8. W3C navigation metrics
Although some convergence in functionality is becoming apparent (at least in terms of stated vendor roadmaps, even if not always currently available), the following aspects are worth considering when you are selecting a passive (RUM) product.
-
Standalone or integrated (e.g., with APM tooling)
-
Real-time reporting (can vary from less than 5 minutes to 24 hours).
-
All traffic or traffic sampling.
-
API availability and granularity.
-
Alert capability; that is, the ability to customize and export to existing alert management tools.
-
Browser and device coverage—versions, types (e.g., Safari).
-
Manually instrumented or dynamically injected (this has a bearing on cost of ownership).
-
Page or object level.
-
User event capture.
-
Complete use case or single page.
-
Extensibility, that is, the ability to associate and report by specific session metrics (e.g., user login).
-
Business metrics, including abandonment, conversion rate, bounce rate, and time on site.
-
Reporting, including standard and customizable, email-based (e.g., .pdf), dashboard outputs.
Creating an External Monitoring Testing Framework
Now that we’ve briefly described the various approaches to external monitoring, including their relative strengths and weaknesses, it is important to emphasize the importance of an effective test framework design. At its core, external monitoring must complement and extend the insights gained by infrastructure-based tooling (e.g., APM, server monitoring, network monitoring). To do this effectively while supporting the requirements of the business, external monitoring must provide information that reliably reflects the usage of the application and therefore maps closely to its effectiveness in meeting business goals.
As mentioned in the introduction, any monitoring will generate a result. Gaining accurate, actionable insights requires a clear understanding of the question that is being asked. A common error is either not to accurately reflect usage conditions, or (perhaps for reasons of perceived economy) to treat results from different tools as equivalent.
Building Blocks of an Effective Testing Framework
Best practices for external monitoring in many ways mirrors that discussed elsewhere in relation to performance testing; that is, it begins with consideration of the business rationale for, and characteristics of, the application to be monitored:
-
Why does it exist?
-
Who uses it?
-
What are the relevant trends and strategic vision, and when is it anticipated that these will be realized?
Begin with good information on existing usage. The following questions illustrate this approach:
-
Where are application users located—now and anticipated?
-
How does behavior vary in different user subsets? (This may suggest the types of test transaction to monitor.)
-
What is the pattern of traffic throughout the day, week, or month? This can vary in different markets. Modeling test frequencies and monitoring windows can make big differences to the license costs of some tools.
-
What differences exist in browser/version and mobile devices? Popular browsers vary widely by region (e.g., Opera in Russia). Particularly in emerging markets, versions that are long obsolete in the UK and US may still have high market share. For example, until recently, Internet Explorer 6 was the most popular browser in China.
-
What is the strategic direction of the business with regard to new markets?
-
What is the strategic direction with regard to mobile device usage and/or development of native applications for iOS and Android?
-
Who are the key digital competitors (international or local) serving the target demographic in all key markets?
It is not necessary (although desirable, if somewhat impractical) to proactively monitor all regions and devices all the time, but the monitoring regime should seek to avoid major blind spots and to validate and extend data obtained from passive sources (i.e., passive tooling).
As you answer these questions, it is essential to work from objective sources of information (such as web analytics), rather than assumptions. The absence of promotion to a particular region does not necessarily imply that it is irrelevant from a revenue perspective. Prior to the aggressive internationalization of more recent years, many high street retailers experienced an English-speaking diaspora effect in terms of site visits, both from areas with a high population of English immigrants (such as southern Spain) as well as more permanent ex-colonial outposts. The world is not homogeneous; consider cultural/behavioral characteristics affecting devices, buying behavior, and use cases in general. As an example, consider the window shopping behavior of Japanese mobile users scanning Q codes. Other factors include the quality of the local infrastructure (developing world), legal/regulatory restrictions (Cuba, China), and the nature of user devices such as PC capacity and mobile devices (Africa).
Having determined the objective data required, and the key pages and use you need to understand, you should next consider the type(s) of monitoring to be employed. Key aspects are as follows:
-
Multiple perspectives (triangulation)
-
APM integration (root-cause isolation)
-
Integration. (external, APM, and performance testing)
-
Pre/per/post-load test results (memory leakage, cache effects, and similar)
Specific Design Aspects of Active Monitoring
When considering the design of a synthetic monitoring solution, you should take into account the following points:
- Triangulation
-
It is important to test from multiple locations, and ideally from a range of core service providers. Backbone testing is designed to provide consistent, best-case external results, and test design should enable this. Ideally, a minimum of three ISP test nodes should be used per key location (e.g., country or region). If three nodes are not available within a specific country, either due to lack of availability from your chosen vendor, or to the requirement to test smaller economic areas, then locations with approximately similar round-trip latencies should be used. Political geography does not matter, but core Internet connectivity does, and this should inform your choice. Use key Internet hubs (in Northern Europe: London, Amsterdam, Frankfurt, Paris) rather than secondary backwater locations where possible.
Avoid tier-two locations (i.e., local data center) where possible—this is clean-room testing requiring consistent test conditions without test node system or communication bandwidth constraints. Failure to adhere to this suggestion will lead to problems with interpreting long-term trend data, and will affect your ability to set and monitor effective goals.
- Frequency
-
Key considerations around test frequency include coverage, the nature of the output required, and cost management. A common approach is to set up active monitoring at a relatively low frequency, used in concert with continuous monitoring using passive (RUM) and/or APM monitoring. The detailed object level (and availability) data provided by the active testing supports pattern analysis and rapid issue isolation/confirmation of potential issues suggested by passive (RUM) results. Detailed test configuration will depend upon the tooling used, but I tend to work with groups of four nodes, each testing at hourly intervals (i.e., providing a nominal test interval of 15 minutes). Frequencies can, of course, be increased during investigation of issues, and often the tooling itself will provide additional confirmatory testing automatically when alert thresholds are breached.
If using active testing to support dashboard displays, you must ensure that test frequencies are matched to the refresh/display rate of the dashboard. Failure to do this will lead to long latencies in flagging changes in performance status and/or misleading results.
If you are using tooling where frequency of testing is a component of cost, then it is worthwhile to devise a test plan that is modeled to the patterns of usage of the application. Taking the time to introduce maintenance windows, or reduce test frequency outside core business hours across different global time zones, can lead to major savings in license costs.
- Agent
-
In the early days of external testing, many vendors developed their own proprietary test agents. These were designed to provide good average visibility of site response across the (very limited) numbers of major browsers then in use, while increasing the detailed information available compared to the black-box limitation of native browser testing. Modern tooling almost exclusively prefers the data relevance provided by native browser-based test agents. Ideally, you should undertake testing using a variety of major browsers. This does not necessarily need to form part of ongoing monitoring, but periodic cross-browser studies enable you to capture any gross issues of incompatibility, and take into account indicative performance offsets.
Browsers differ in their detailed mode of operation, and it is important to review site design to account for these differences across browser types and versions. Such differences include the number of parallel connections, JavaScript handling, and the sophistication (or otherwise) of script prefetching. Site modifications to work around earlier browser limitations, if not reviewed, may lead to suboptimal performance with later modified browsers.
As a general rule, where possible, active monitoring should seek to match the browser agent used to the predominant end-user browser and version in the market concerned. In cases where this is not available, some vendors will enable spoofing by setting header and document object model (DOM) identifier information on a different underlying browser engine. This approach has variable benefits depending upon the nature of any underlying site issues, but it can be useful in identifying intractable problems. Such a hybrid approach is also commonly used in mobile emulation testing—that is, setting specific device headers on an underlying PC browser engine. This is flexible, and it provides consistency of performance. However, it will not uncover issues due to client-side system limitations. For these, real-device testing should be used.
Specific Design Aspects of Passive Monitoring
The key points with passive monitoring are to understand any blind spots and to compensate for them. Many passive (RUM) tools (those based on the W3C navigation metrics) cannot collect detailed metrics on Safari or older browsers. Supplementing with appropriate active testing (e.g., during periods of low base traffic) will ensure rapid response should issues occur outside core trading periods.
Integration with APM tooling will also serve to extend this understanding across the full range of visitor usage. Advanced passive (RUM) tools supporting individual session-level information are particularly useful. Such products support more advanced business—providing relevant metrics such as the relationship between performance and bounce rate or transaction abandonment.
When interpreting passive (RUM) outputs, bear in mind that the results relate to successful visitors to the site. Visit requests that were not successful will not appear. Potential visitors (or visitor subsets, such as mobile users of a particular carrier or device) who persistently experience problems may not seek to access the site in the future. For these reasons, it is advisable to approach passive (RUM) data interpretation from the perspective of expected results. Significant deviation from expectation (e.g., the absence or very low conversion rates for a popular device or certain region) should prompt you to perform validation testing using active monitoring and visual fidelity testing to offer confirmatory assurance of performance.
Isolating and Characterizing Issues Using External Monitoring
The approach detailed in this section is one that I have used for many years. It was designed for active monitoring (i.e., using scheduled synthetic testing) and hence it would typically be used to validate and/or investigate potential issues flagged by continuous visitor passive (RUM) outputs.
The ability to perform the testing will depend upon the tooling available.
-
Start with clean room (backbone results).
-
Examine average backbone trace (ideally for a minimum of two weeks).
-
What are the patterns of performance degradation? One-off, periodic, systemic?
-
What is the most likely correlation (e.g., traffic patterns, periods of maintenance)? If possible, examine passive (RUM)-based traffic versus performance.
-
Is there any progressive deterioration/sudden improvement (memory leakage, caching issues)?
-
-
Look for regular periods of poor performance in direct response to load (sine wave). Typically, this indicates an infrastructure capacity deficit, but other explanations exist.
-
Look for random outlying results.
-
Compare cross-browser results: are they the same for all? Focus on major browsers for the relevant country or region and/or the browsers reported by customer services.
-
Validate passive (RUM) results using active monitoring (set browser/device headers as required).
-
Review any automated analysis (consider the likely extent/significance of any red flags).
-
Analyze by ISP node:
-
If problems point to the same node, select that node and chart on it alone.
-
If multiple nodes are implicated, view a scattergram of performance by node to determine any patterns.
-
-
If there is a drop in availability, view using a test-by-time scatterchart to show the timing of the failed tests. Examine for cause of failure.
-
Validate availability by payload (byte count): is there any drop in content or evidence of errors in page delivery? Examine passive (RUM) data if error page(s) are instrumented.
-
Characterize the error (details will depend upon the tooling deployed):
-
Implement screen capture on error if this is supported by the tooling.
-
Is there evidence of content failure?
-
Are there content match errors?
-
-
-
-
Focus on areas with performance degradation.
-
Split by page (if transactional).
-
Split page by component (e.g., core, third party). Consider the following aspects of individual page components: DNS resolution, connection time, first byte time, content delivery time.
-
Compare performance relative to reference baseline data (for the site under test or top-performing competitors).
-
Consider median and 95th percentile response values, together with a measure of variation (e.g., MAD, MADe).
-
-
Review the pattern of results using overall scattergram patterns and by associating slow delivery times with spikes in performance of the relevant page or use case.
-
Compare average results from multiple perspectives—ISP backbone, scheduled end user (PC and mobile/wireless carrier), passive.
-
Correlate key parameters (e.g., traffic, ISP, end-user device).
-
-
From the backbone, drill down to object waterfall view if supported by the tooling. Compare three or four good and poor results: what is the difference?
-
View objects by host.
-
Plot suspect object(s) over time: do any patterns emerge?
-
Undertake a rapid object audit of page(s): number, type, size, header settings.
-
-
Look at the quality of service.
-
Generate an end-user error chart for the period.
-
View by type (pie chart).
-
View by time.
-
Drill down on particular error(s).
-
View report: are any patterns to objects/hosts/speeds/ISPs involved?
-
Beware of “rogue” errors caused by limitations of connection speed—set (or filter) for known bandwidth.
-
-
-
Look at visitor passive (RUM) reporting.
-
Where is the slow performance (geography, ISP, browser version, etc.)?
-
Is there any association between traffic and errors or abandonment?
-
-
-
Capture, summarize, and report findings for future comparison.
Monitoring Native Mobile Applications
Internet-based delivery to mobile is evolving in two dimensions. First, mobile is increasingly becoming the primary retail digital purchase channel (anecdotally, several major retailers report close to 40 percent of their digital revenue from this source). The trendlines between PC-based purchase (declining) and mobile (increasing) are set to cross within the next 12 months (i.e., by early 2015), as you can see in Figure 7-10.
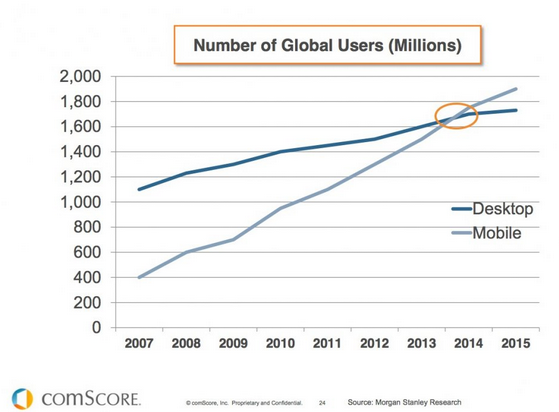
Figure 7-10. The trendlines between desktop (declining) and mobile (increasing) consumers are set to cross by early 2015
The second dynamic is the migration from relatively simple m. (mobile-enabled) websites to native mobile applications, although the advent of web apps, particularly when supported by some of the emerging network-independent components, may prove disruptive to this in the future. Setting aside web apps for now, native mobile applications have a number of advantages:
-
They are network independent. You can use them in train tunnels and other areas where Internet connectivity is poor or nonexistent.
-
They are productive at all times. In other words, you can store key information such as documentation and product SKUs locally.
-
They are (or can be) faster and richer in functionality. Developers have access to a rich, closed OS environment, and therefore do not have to make cross-device compromises.
These strengths present difficulties, however, from an external monitoring perspective. These are complete, compiled applications, so the concept of the web page does not exist. They are also not necessarily HTTP/HTTPS based, so tooling designed for the Web may be unsuitable anyway.
Monitoring native mobile applications requires different approaches, which I will term explicit and inherent. Explicit monitoring uses a software development kit (SDK) to instrument the application code and link these together to create logical user journeys. Typically, iOS Views and Android Activities are referenced using the SDK. Data from application traffic (either actual end users or from specific VNC-linked devices) is collected and reported.
The ability to relate application performance to device variables (for example, memory, battery state, and signal strength) is particularly valuable. Crash metrics may additionally be reported in case of application failure. This approach is primarily used by mobile test tool vendors such as SOASTA (Touchtest).
Inherent monitoring is similar, but is easier to manage in that it requires a one-time instrumentation of the code with a compiled component. This is injected automatically at runtime, enabling capture of all user activity without requiring use-case scripting.
This is the route typically favored by native mobile application monitoring extensions of APM tooling (for example, New Relic, shown in Figure 7-11). The ability to compare performance across devices and OS versions is extremely useful, particularly if elements are used to feed composite dashboards (via the tool API) relating performance to business operation metrics (e.g., order rate).
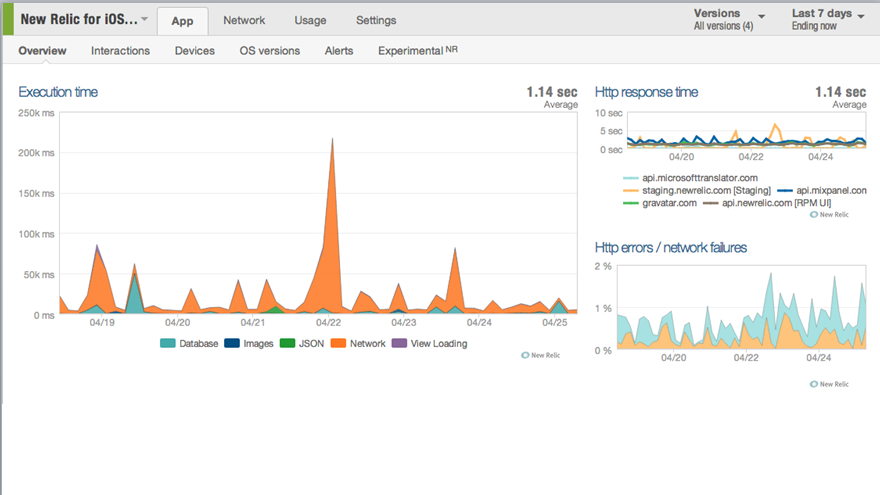
Figure 7-11. Typical APM mobile dashboard
From the point of view of external monitoring, the principal disadvantage of native mobile applications is that it is not possible to monitor apps without access to the code. Thus, it is not possible to monitor competitors, and sector benchmarks do not exist (at the time of writing). This makes it challenging to appropriately define target performance.
Essential Considerations for CDN Monitoring
External content caching, or CDN, acceleration is one of the more established and widely used of the many performance-centric interventions now available. A recent (2014) study by my company Intechnica on the top 20 UK retail sites identified more than 75 percent of third-party services being represented by one major independent CDN provider alone. CDN adoption is far from a one-size-fits-all decision. The market itself is both large and fairly volatile, with the contending capabilities and claims of independents (Akamai, CD Networks, Limelight, Fastly, and many others), platform-based offerings (e.g., Amazon Cloudfront), and ISP-based services—which are often themselves delivered through licensing agreements with independents (e.g., Deutsche Telecom and EdgeCast). The broad choice is less relevant than the inherently dynamic nature of the problem. At its most basic level, CDN usage is far from binary; a given site may well employ several CDNs either directly or indirectly (through third-party content). So what are some of the core considerations?
-
What are you accelerating? Depending upon the nature of the site and its usage, all or part may be accelerated. Is CDN caching applied just to large static images (for example), or all content?
-
Where is it going? What are your key global markets? CDN providers differ widely in their capacity across the globe (indeed, some are regional niche players).
-
Which primary regional ISPs are involved in web delivery?
-
What is the nature of your core content and to whom is it principally delivered? Web HTTP and/or video (total download, adaptive streaming, etc.), PC browser, mobile device, or other (gaming console)?
Specific considerations apply in optimizing each of these areas. These may or may not be embraced by a particular product or service. As an example, delivery optimization to mobile devices may involve test compression (to reduce overall payload), video pacing, and TCP acceleration. All of these factors should influence test design and tooling approaches. An effective CDN-based strategy begins with initial selection, informed by some of the aforementioned considerations. As we have seen, determining optimal return on investment repays a thorough approach, and some form of comparative proof-of-concept trial is likely to pay major dividends. Following the purchase decision and deployment, key ongoing questions remain, if you are to maintain best value:
-
Where are the priorities for usage optimization?
-
Is there an end-user monitoring strategy in place across all key (and potential) markets?
-
Do target KPIs (absolute or relative to local competitors) exist for all markets and usage categories?
-
Is a service-level agreement (SLA) with defined interventions and remedies in place with the selected provider?
-
How do these stack up, both during business as usual and across peak demand events?
These questions should be answered by an ongoing monitoring program supported by a best-practice-based testing framework. Having defined which areas (functional, geographic, and demographic) would potentially benefit from the use of CDN approaches, and assuming other interventions (e.g., appliance based, FEO) have been discounted, you should then ask the following:
-
Is the CDN accelerating all appropriate components?
-
Some “entry-level” providers are restricted to caching static content such as images. If other elements are required (e.g., login and search), are these also included and effectively measured?
-
-
Test design. Where does caching occur? At a single POP/ISP domain, via multiple hosts, or at cellular network mast?
-
Testing should reflect any potential constraints implied by the design of a particular CDN providers network.
-
For maximum effectiveness, conduct prescheduled, active (synthetic) testing from appropriate end users (PC and/or mobile) in the country concerned.
-
You should employ a parallel testing methodology comparing performance directly to the origin servers with that delivered locally by the CDN provider.
-
This approach will ensure not only that end-user performance is satisfactory, but also that the extent of benefit delivered to (and purchased from) the CDN is maintained.
An example may help here:
- Comparative monitoring of cached content to PC end users in a key regional market (known connectivity conditions), origin versus local cache
-
Figure 7-12 shows the overall benefit delivered (some 7 seconds on average). The highlighted area illustrates a convergence between the traces (i.e., transient failure of the CDN to deliver performance acceleration).
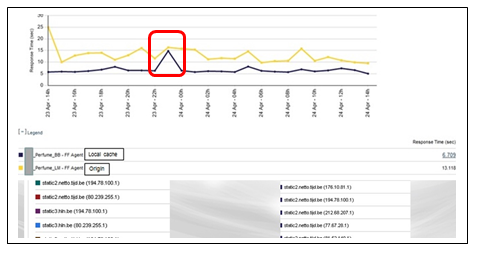
Figure 7-12. Timebase: 1 hour
- Importance of test location
-
Figure 7-13 compares the number of CDN hosts used to deliver content (i.e., be monitored) over a one-week period by a major CDN provider. Testing from the tier-one ISP cloud provisions (left image) cached content from 2 CDN host groups (16 individual hosts).
The image on the right shows results from the same geography when tested from a wide range of PC end users (using a variety of tertiary ISPs). Ninety-six individual hosts were employed.
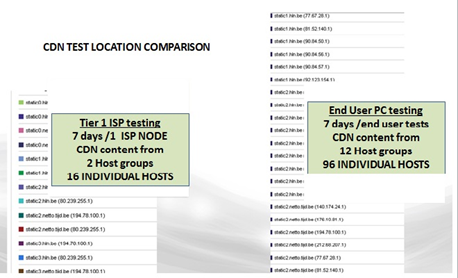
Figure 7-13. CDN test location comparison
- Relevance
-
Failure or poor performance by any of the 80 hosts not detected by ISP-level monitoring would not be detected, while being paid for, and impacting all end users of that particular host.
Figure 7-14 illustrates the range of performance at the individual CDN host level during a five-day test window.
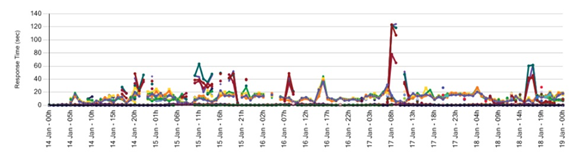
Figure 7-14. CDN host-level performance
Note that the selection of CDN delivery node location will be influenced by several factors. These include existence of a point-of-presence (POP) in the region to be optimized. Absence of a local POP need not be disastrous, but it will mean that round-trip times to the source of the cached data (e.g., UK to US) will be extended.
Even if a local POP exists, it is important that end-user traffic is mapped efficiently to the CDN host that will most efficiently deliver the cached content. Such mapping is typically effected using the IP location of the DNS resolver rather than that of the end user. In the case of most consumer end users, DNS resolution will be undertaken by their ISP at a central in-country location. Corporate or institutional users may, on occasion, use DNS proxies distant from their location (e.g., on another continent). This may lead to inefficiencies due to incorrect CDN location mapping, with commensurate round-trip latency. Whether or not this occurs, you should certainly correct for it when undertaking CDN assurance screening, by identifying and blacklisting such end-user peers.
Finally, having selected your CDN provider, ensure that configuration is optimized, both in terms of origin/CDN interaction, and ensuring that headers are set appropriately at the individual object level. Failure to do (and police this) can result in performance being compromised by origin rush, whereby the individual CDN delivery nodes, rather than serving locally cached content, are constrained to request all or part of the content from the origin servers, thus defeating the objective of the exercise. Such misconfiguration can have relatively dramatic effects on site performance even if a relative small proportion of total content is misconfigured, particularly if the origin infrastructure is prone to capacity constraints.
Performance Results Interpretation
Effective performance management requires an understanding of ongoing performance, both in absolute terms, and relative to key competitors and visitor expectations. A wide range of tooling exists for external monitoring of application performance. All will produce a series of results. The validity of these results, and therefore the quality of the business inferences drawn from them, can vary significantly. This section highlights some pitfalls and suggested approaches to maximizing beneficial outcomes from investment in performance.
You must take care when selecting appropriate tooling, taking into account the nature of the application, its detailed technical characteristics, the nature of visitor traffic, the location of key global markets (existing or planned), and many other considerations. Having developed a test matrix for external monitoring (with regard to established best practice), you should collect and inspect data over a full monthly business cycle. This will provide a set of reference baseline values across a range of business-as-usual conditions.
A given application will typically exhibit recurrent patterns of performance behavior across a weekly demand cycle. Such patterns often provide an initial high-level indication of overall application characteristics, such as capacity deficits or gross issues in serving particular visitor groups (e.g., mobile users). These preliminary findings can inform your subsequent approaches to the performance strategy.
Assuming that overall application performance is reasonably stable, it is then appropriate to determine the KPIs and any associated SLAs that will be used for performance understanding and management.
Key Performance Indicators for Web-Based Ecommerce Applications
KPI determination should reference many factors. In summary, these include the following:
-
Best-practice values derived from top performers in a relevant business sector, “bellwether” sites (i.e., places where your customers are visiting if not on your site), and expert advice.
-
Performance of key competitors.
-
Historic performance of your site.
-
Key use cases—that is, those with maximum business relevance. These fall into three categories:
-
Direct revenue sources (e.g., purchase transactions).
-
Activities that reduce business overhead (e.g., web-based customer service chat versus telephone-based support).
-
Functions that are important to brand perception and/or deferred revenue. Examples include color simulator for paint/car manufacturer; booking sales representative appointments.
-
-
Key pages. Use case should always be deconstructed to examine the performance of each page or logical step, as an exclusive focus on end-to-end response times may mask poor performance at a key step. Poor performance at individual key steps has been shown to be highly correlated with abandonment.
-
Subpage performance—that is, response and consistency of individual objects/links, either core or third party.
The purpose of KPIs and any SLAs based on them is to ensure and optimize business outcomes. These outcomes can take many forms, but those most relevant to ecommerce are revenue, customer satisfaction, and brand perception. Site/application behavior has both a direct and indirect impact on performance. Direct factors include lack of availability and high levels of delayed page response and inconsistency.
From an end-user-experience perspective, key performance-related metrics are response time (seconds), availability (%), and consistency (standard deviation or median absolute deviation). You need to monitor and understand the influence (if any) of performance on conversion rate, visitor abandonment, bounce rate, and stickiness (time on site).
Performance has been shown to have a less direct effect on other key revenue metrics (e.g., conversion and abandonment). These factors are influenced by many variables, including site design, user demographics, and aspects of the offer (e.g., shipping costs). Setting and managing performance KPIs while controlling for other variables has been shown to have a positive effect on digital revenue. Visitor metrics should be analyzed using robust statistics to mitigate the distorting effect of outliers. Once thresholds have been established, the use of—and setting KPIs for—APDEX-derived measures of visitor satisfaction is useful. (APDEX will be described shortly.)
Consider key markets: the nature of competitors and delivery conditions (quality of core Internet infrastructure, browser version, mobile device usage, and other factors) affects the detail of the monitoring undertaken and target KPI values. There can be little point in applying common KPIs derived from performance in advanced markets indiscriminately across all regions. It’s better to understand local conditions and constraints and seek to be the best on the ground market by market. This is likely to provide a more pragmatic and lower-cost approach.
You should have in place a procedure for the regular, systematic review of all KPIs. Factors to be considered include the following:
-
Historic performance relative to existing values
-
Trending of all defined metrics and business processes
-
Performance and trends in key competitors and bellwether sites (e.g., BBC, Facebook)
A fully evolved performance strategy gives attention to both objective (hard) and subjective (soft) aspects of performant delivery:
- Hard metrics
-
-
External: set target responses to the ISP cloud (best case) as well as to PC and mobile device end users across a range of connection bandwidths, to cached/uncached visitors, and between total (all object) page response and above-the-line (browser fill) response time. External KPIs/SLAs should exist for the following:
-
Key use cases
-
Key pages
-
Third-party objects/affiliates
-
-
Internal: Set and manage internal (infrastructure-based) KPI metrics. These metrics are outside the scope of this chapter.
-
- Soft metrics
Setting KPI Values
Consider the nature of the application and the goals for the business/brand. For example, do you wish to be in (and invest to achieve) the number-one benchmark position, top 10 percent, top quartile? A common approach is to aim for a position in the top 25 percent of all companies in your business sector (in key markets), with a response at least as good as a panel of specified direct competitors.
Reference second-order values (quoted retail industry average), as outlined in Table 7-3.
| eCommerce retail KPI | Upper quartile benchmark mean |
|---|---|
Conversion rate (total site visitors) |
>3.0%1 |
Shopping cart abandonment |
<60% |
Target page weight (PC browser) |
<1 Mb |
Add to cart (new visitors) |
6.4%2 |
Add to cart (returning visitors) |
10.8%3 |
Total page weight (mobile devices) |
*3 |
Quoted average values are very dependent upon the nature and positioning of particular sites, the selection of data, and the dynamic nature of the metrics themselves. Users should discuss this with their web analytics and/or tag management system provider to derive target KPI data more specific to their precise offer. Consider the following:
-
Understand the key users of the site in terms of browser versions, connectivity (fixed wire and mobile dongle), mobile device, location, and ISP.
-
Distinguish between the performance of first time (uncached) users and frequent visitors. Note that unless specifically designed (by scripting duplicate consecutive tests), active (synthetic) monitoring testing is usually uncached, thus providing worst-case responses.
-
Understand key trends in interface (e.g., specific mobile phone or tablet) uptake among your key target demographics.
-
Test performance to major browser (e.g., Internet Explorer, Chrome, Firefox) upgrades at beta stage if possible.
-
In terms of capacity, undertake performance assurance of application KPIs:
-
Across the range of demand of the normal (daily/weekly/monthly) business cycle.
-
To anticipated peak demand—Christmas trading, sales, and so on (typically 1.5x projection from previous years).
-
Prior to release of significant site/application upgrades or other related activities (e.g., hosting provider or primary ISP changes). Periodic nonfunctional performance testing should form part of continuous integration–based DevOps strategies.
-
External KPIs are typically as follows:
-
Business relevant, that is, they affect revenue throughput directly or indirectly.
-
Based on degradation over a period or with a defined pattern of occurrence rather than point or transient episodes.
-
Based on the three cardinal metrics:
-
Response time (seconds)
-
Availability (% successful tests)
-
Consistency (standard deviation, seconds)
-
What to measure? Typically:
-
Use-case times
-
Individual page times
-
Response consistency
-
Object/delivery component (e.g., DNS) times
External KPIs should specify the source of testing:
-
Site visitor monitoring (perceived render times, browser version/device response times)
-
Clean-room ISP cloud testing (absolute metrics, competitor benchmarks)
-
Scheduled end-user testing (geographic/specific location testing, subjective metrics)
-
Performance capacity testing (internal/cloud/end user)
There are three types of metrics:
-
-
Breaches indicate a prima facie issue requiring intervention and resolution.
-
Deviations from range of standard behavior across the business demand cycle.
-
-
-
Based on judgment and/or empirical behavior data (e.g., abandonment rates).
-
-
-
To competitors (public sites).
-
To other internal applications.
-
To other objective criteria.
-
The preceding categories apply to monitoring metrics, that is to say, the application response across the normal cycle of business usage. Performance metrics apply to the application response across conditions of simulated demand (performance testing). SLAs imply involvement of another actor (typically external, but may be a defined internal IT/operations function).
The Application Performance Index (APDEX)
The APDEX, or Application Performance Index, is a means of comparing end-user satisfaction by measuring application response. It was initially derived in 2005 by Peter Sevcik of NetForecast Inc., and is currently supported and developed by corporate members of the Apdex Alliance (typically larger performance-related companies such as Akamai, Compuware, and Keynote Systems).
The principal goal of APDEX is to provide a clear and unambiguous method of comparing user experience across any application, user group, or enterprise. All members of the Alliance produce products that calculate and report the APDEX score. In theory, it is possible to calculate the index from any end-user response metrics. However, this does not obviate the requirement to critically examine the results delivered by your tooling to ensure that they accurately represent the end users’ perception of the application response. As an example, user wait times are not equivalent to the total page response metrics produced by synthetic monitoring systems. These are essentially recording the total network traffic time, so unless the above-the-fold time is indicated (as it is with some synthetic tooling, such as Google WebPagetest), a passive (RUM) tool providing a browser fill metric is required.
The APDEX has a potential range of zero (least overall satisfaction) to one (greatest overall satisfaction) experienced by users of the application. Users are segmented into one of three categories (Satisfied, Tolerating, or Frustrated) on the basis of their experience of application response. The index is calculated through a comparison of the number of responses in each category relative to the total sample.
Categories are related to a target value (t seconds) as follows:
- Satisfied zone
-
Zero to t
- Tolerating zone
-
t to 4t
- Frustrating zone
-
4t and above
If you are interested in the theoretical basis of APDEX, references are provided at the end of this chapter.
Management Information
Before embarking on an information delivery program, you need to define and group specific indicator metrics, via a minimal number of relevant summary management reports. Popular approaches include the following:
Although some metrics, such as availability, are likely to be common to all business constituencies, the particular metrics selected and, in particular, the RAG thresholds used will differ depending upon the target audience.
For example, the Operations team will require early warning of potential issues. It will typically set far tighter warning thresholds based on root-cause indicators. Senior business (e.g., C-level) users are usually focused on issues that impact business performance (e.g., order rates, market share) and are focused on first-cause metrics that will typically have broader thresholds.
Having agreed upon a master set of KPIs and the type and mode of delivery (heads-up dashboard, daily email, SMS alert), you must now consider how best to process the raw performance data for maximum relevance.
Data Preparation
The importance of pattern interpretation (that is, the variation of site behavior across the business demand cycle) has been mentioned. However, in drawing conclusions from data, it is important to consider and minimize where possible the inherent limitations in the figures presented. These derive from three principal sources:
-
Limitations inherent in the nature of the test design. As an example, some tooling vendors use artificially throttled bandwidth tests from core Internet cloud locations as a proxy for end-user performance. Others use outdated HTTP 1.0–based agents, which cannot monitor modern client-based processes.
-
Limitations dependent upon the test source—for example, using tertiary retail ISP test locations rather than near-tier-one dedicated ISP or LINX-based tests.
-
Limitations based on the nature of the results obtained. This is covered in the following section.
Statistical Considerations
Ongoing week-to-week or month-to-month performance monitoring (as opposed to specific deep-dive issue-resolution activities) are based on three parameters:
Availability:: The proportion of external scheduled tests that are successful or fail—reported as a percentage of total (active) tests. Response time:: The time taken for a process, page, or transaction to execute. Various subtleties should be considered (e.g., total load time versus above-the-fold or browser-fill times); these are covered elsewhere. Reported in seconds or milliseconds. Consistency:: The variation of the results from multiple repetitions of a given test. Often reported as standard deviation, although there are better metrics (as discussed momentarily).
Treatment of availability is acceptable, provided any inherent underlying confounding variables are noted/known. These would include such factors as low test volumes. As an example, a single failure from a run of 5 tests is reported as an availability of 80 percent. The same single failure from 100 tests results in a reported availability of 99 percent. When you are considering availability metrics, it is important to exercise particular care in distinguishing between reported (or what I term nominal) availability and actual functional availability.
Active (synthetic) monitoring tooling will typically record a page load as successful even if a proportion of the content has failed to download (or, indeed, if it is an error trap page of the “Our site is having problems; please try later” type delivered in place of the requested page). Before you regard reported availability as accurate, therefore, it is strongly recommended that you do the following:
-
Smoke test the results. A recorded availability of less than, say, 85 percent would almost always be accompanied by other symptoms, even if they are calls to the customer support center. Is this a test artifact?
-
Does the site work when you visit it?
-
What do the site traffic and order volumes look like?
-
-
Run a payload test. This is very useful for picking up the delivery of partial or error pages.
Measurement of response times and consistency can present more difficulties if you do not take care to understand (and, if necessary, correct for) any inherent distortion in the raw data.
Consider the charts in Figure 7-15 and Figure 7-16.

Figure 7-15. End-user average response time
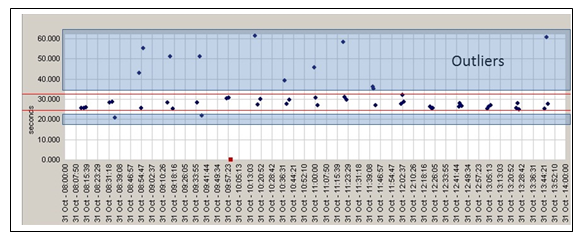
Figure 7-16. End-user outlier response time
Figure 7-15 illustrates the value of examining the raw individual data points before determining the best statistical treatment. Averages can hide a multitude of sins. In this case, a scattergram display was used. It represents each individual data point as a single point, color-coded by its origin (location of ISP node). The value of such an approach in understanding underlying application behavior is clear.
Point A shows a state change in response from the British Telecom test node location. As BT carries over 80 percent of UK traffic, and any performance changes (e.g., due to peerage issues between customers using BT and the data center home ISP) can have major commercial consequences in terms of user experience. After the state change at A, two separate performance bands are detected in the BT results. This is characteristic of load-balancing issues, but more relevant to our current discussion is the effect on the distribution of results producing a multimodal distribution.
At point B, you can see the effect of an issue localized to the Verizon (orange) node. In this case, the effect is transient, and would be well reflected in an increase in average response, flagging alerting, and more detailed investigation.
Figure 7-16 illustrates a different scenario. In this case, the scattergram shows a high dispersion of results that is not transient (as with the Verizon example), but systemic. The application throws off frequent, sporadic results that are much higher (or in a few cases, lower) than the majority of the results. In the chart, the core response times (average of ~26 seconds) are bounded by the red lines. Outliers (which in certain cases are three times as long) appear in the (blue) shaded portion of the chart outside this area.
This kind of dispersion in results is not uncommon, particularly in applications that are operating close to their infrastructure capacity, either in the general run of business, or at times of peak demand (e.g., pre-Christmas trading, or in intranet applications close to internal deadlines).
The issue that this presents in interpretation is that the simple and commonly used measures of central tendency—the arithmetic mean (for response) and the standard deviation (for consistency, or results variability around the mean)—make a core assumption of normality of distribution This is demonstrated in Figure 7-17.

Figure 7-17. Normal distribution curve
As you can see, this distribution is symmetrical (i.e., the proportion of results of a given value are the same to the left and right of the center line). The presence of outliers (or other distortions such as distributions that exhibit kurtosis or skewedness) render this core assumption invalid and tend to likewise invalidate results that are based on it. In simple terms, if an application has responses to (say) 1 in 10 visitors in one month that are much higher than the majority, and the following month this does not occur (or the proportion of outliers changes significantly), the mean value will be markedly affected. This sensitivity to data quality makes the mean a poor choice when you are comparing a long series of performance results. Fortunately, a number of alternatives exist. These are more or less involved depending upon the standard characteristics of the data. While professional statisticians may have resource-to-data transformations (e.g., logarithmic), in the case of most correctly specified corporate systems, one of two approaches usually suffices, namely:
Monitor the median rather than the mean. The median is the value that cuts the data in half. It is, in statistician’s parlance, a more robust indicator than the mean. In other words, it is less affected by small numbers of results that vary from a standard normal probability distribution.
In cases where preliminary examination of the data shows a large number of outliers and/or the results of such regular outliers are likely to significantly distort the mean, you should see a truncated distribution when reporting on central tendency (i.e., the peak of the probability distribution curve—which is what the mean seeks to do). As mentioned, data transformation is one solution.
Provided that the residual data volume is sufficiently high, a simpler solution is to use a trimmed mean. The trimmed mean is calculated in the same way as a simple arithmetic mean (i.e., the sum of all values divided by their number), but a fixed proportion of data points are removed (the same amount for either end of the scale). As an example, a 20 percent trimmed mean would discard the highest and lowest 20 percent of values. The amount of trimming required will depend upon the particular results distribution obtained.
If the data is reasonably normally distributed, then the standard deviation can be used. Should many outliers exist, another truncated distribution (such as Caudy) may be preferred to model the data. This is similar to Figure 7-17, but it has fatter tails. You may be more familiar with Student’s t, which has the same probability distribution (at 1 degree of freedom) as the Caudy distribution. The equivalent consistency measure for this model is the median absolute deviation (MAD). Due to differences in its calculation, the MAD is more resistant to the distorting effects of outliers than the standard deviation.
Although replacing the mean and standard deviation with the median (or trimmed mean) and MAD will assist in ongoing comparison and iterative goal setting for your site, it has the disadvantage that these figures are not quoted for other (e.g., competitive) sites. Although the assumption of normality cannot, of course, necessarily be made for these sites either, it may be helpful to note that, for normal distributions, multiplying the MAD by 1.48 will give the appropriate standard deviation.
An alternative, if justified, would be to monitor key competitors and apply the transformation to the results obtained. This is rarely an appropriate use of investment, but one other metric is worthy of mention, as it can provide a comparative figure independent of the mean. This is the percentile rank. The percentile rank represents the figure above (or below) which x% of results lie. This metric can sometimes provide a simple alternative comparator for performance over time. It is more commonly used in situations such as the comparison of year-on-year performance of students at public examinations than in performance monitoring. It is most seen in an IT context (often at the 95th percentile) in situations of utilization/capacity planning, such as burstable bandwidth contracts.
Correlation
Statistics is a fascinating field of study, but the further reaches of it are perhaps best left to researchers who have the time and justification for their efforts. The small number of robust metrics just described is sufficient for almost all day-to-day monitoring purposes.
One final metric, correlation, is worthy of mention in an introductory text. You may have discovered an issue that has several possible causes. Correlation enables statistical comparison of two data sets. It provides a measure of the extent of association between them. This does not necessarily imply causation, as other factors may be acting on the data measured, but measuring correlation can certainly serve to exclude unconnected metrics, and to some extent rank others in terms of likely importance.
Correlation between data may be simple (i.e., linear) or more complex, requiring various transformations of the raw data. Rapid comparison of data sets for linear relationships is straightforward with Student’s t test. Details of how to apply the test and the tables required for derivation of the correlation coefficient can be found in any basic statistical text.
If you are using the t test, here are a few points to bear in mind:
-
It is a measure of a linear (straight line) relationship between variables, but others (e.g., exponential) may exist.
-
Its accuracy will be affected by the size of the sample—biological statistics sometimes works with as few as 20 pairs, but the more the better—and this is not usually a constraint in performance work.
-
The correlation coefficient varies between zero (no relationship) and one (perfect relationship, either negative [–1] or positive [+1]).
Interpretation will depend upon the circumstances, but values greater than around 0.7 may be regarded as relatively strong.
One final point: if you are using Student’s t-tables, you will find values for one- and two-tailed tests. Which to apply? This depends on what you are trying to determine. A one-tailed test indicates the strength of a single-direction (positive or negative) relationship between the pairs of figures—in other words, when testing the strength of a particular hypothesis. The two-tailed test indicates the likelihood of either a positive or negative correlation (i.e., when you have no idea whether any relationship exists).
In performance work you will almost always be using one-tailed tests. As an example, consider Table 7-4: what aspects of third-party affiliate content have the most impact on site performance?
| Page response (total load time [sec])? | # Third-party hosts | # Third-party connections | # Third-party objects |
|---|---|---|---|
Median |
9.4 |
26.5 |
98 |
91.5 |
Correlation coefficient (Pearson r) |
0.723 |
In this case, neither of the factors examined had an overwhelmingly strong claim to be the key factor, and (of course) they are all interrelated; the more third-party objects you have, the more connections there will be, and so forth. A clear understanding would require a larger sample volume and (probably) better test design than was applied here, but, inasmuch as it illustrates the point, examination of the correlation coefficients shows that, for this single test at least, the number of third-party hosts appears to have the least single influence on page load performance, while the number of third-party connections has the greatest.
Further investigation could consider whether some combination of individual factors provided a stronger result (e.g., one metric divided or multiplied by another), or indeed whether a weighted model (applying a constant value to one or several metrics) was more satisfactory. The next step would depend on your reasons for conducting the investigation.
Effective Reporting
Application monitoring is about gaining understanding. This short section addresses some aspects of the delivery of that understanding via appropriate management reports. Effective management reports should be as follows:
-
Relevant
-
Timely
-
Readily comprehensible
Creation of reports is not a mundane activity. The challenge is not the creation of the reports themselves; this can usually be undertaken within the monitoring tool, or alternatively exported to one of the literally hundreds of report/dashboard creation applications available. Rather, the important aspect is to make the reports appropriate and actionable. It is sensible to begin by considering the audience(s) for the various reports, both technical (IT, operations) and business (C-level management, department heads, marketing, ecommerce, and others).
Reports should address the various user groups in their terms. Some they will tell you, and others you can to infer from the nature of their roles and (particularly) how they are remunerated. An example may be an emerging markets product or marketing manager. Data relating performance to key in-market competitors and monthly changes in net new customers will be more meaningful than more arcane throughput or network utilization metrics useful to an operations function.
When you understand what is required (in an ideal world), an audit of existing systems (web analytics, sales, order processing) will reveal the base data available to enrich basic performance data. Web analytics in particular is a useful source of business-relevant metrics (conversion, abandonment, bounce rate, stickiness), should these not be available within the monitoring tooling itself.
Report outputs should be as simple to comprehend and as short as possible. Balanced scorecard approaches, which score agreed-upon key metrics at regular intervals (daily, weekly, monthly) are often useful. They are particularly powerful if supported by a traffic-light-based RAG (red/amber/green) output.
Thresholds, also, should be appropriate to the audience. An Operations team will typically wish to have far tighter triggers in place—providing early warning of approaching issues—than business management. Senior management, in particular, typically is interested only in output impacts such as revenue or significant competitive deficits. Too many red lights on their reports are likely to result in the sort of profile-raising phone calls that most ops teams can do without!
Trend charts are useful in setting and managing iterative goals, and for future planning. The appropriate statistical treatments should be applied to any projections generated. A combination of regular, standard charts to support specific regular business meetings, together with real-time dashboards in key locations, is useful, both as a source of actionable data and to convey a perception of control across the business.
Finally, consider using subjective outputs. The comparative videos generated by Google WebPagetest are a good example, as are APDEX values for performance-related customer satisfaction; these can trigger beneficial actions (e.g., IT investment) as opposed to dry tables, which, however accurate, are less emotionally engaging.
Competitive Understanding
There are several aspects to understanding website performance relative to that of key competitors. These include the following:
-
Perspective (clean room versus end user—specific category or all visitor)
-
Device and delivery mode (PC browser, mobile phone, tablet; fixed-wire and wireless network)
-
Geography
-
Selection criteria (sector competitors, bellwether sites)
Internet cloud testing provides the best data for absolute competitive comparison in ideal conditions.
End-user data is noisier, but also more revenue-relevant. Passive (RUM) visitor data is continuous and has broad reach, but is often partial (e.g., excluding Safari and some older browser versions) and does not record failed visit attempts. Typical passive (RUM) data is based on page delivery rather than on individual objects.
The line chart in Figure 7-18 provides an average performance trace across a number of test locations. The example compares two key metrics: response (total page load) time and availability.
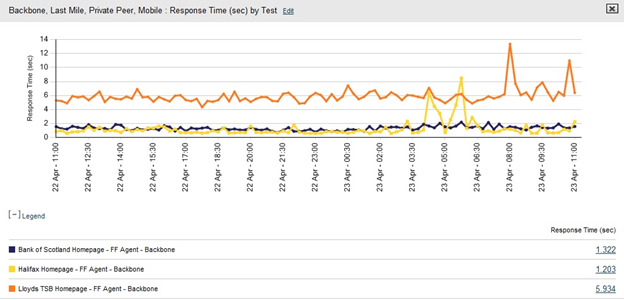
Figure 7-18. Multilocation average performance trace
- Benchmarks (public/private)
-
Benchmarks provide a periodic (typically weekly or monthly) league table of the performance of the target site relative to a set of defined comparator sites (Figure 7-19).
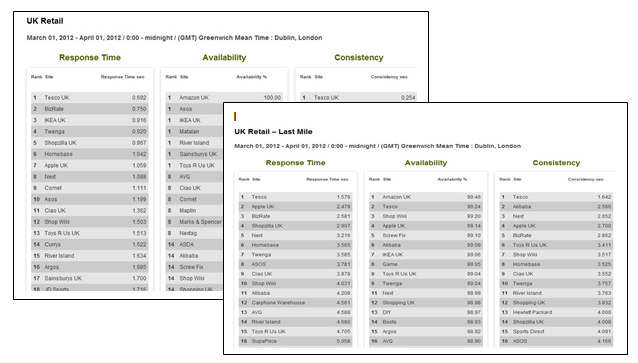
Figure 7-19. UK retail website end-user-performance leaderboard
- Dashboard displays
-
Operational dashboard—RAG display.
Figure 7-20 is a heads-up display of key transaction performance across a range of end-user bandwidths, as used by a major UK retailer.
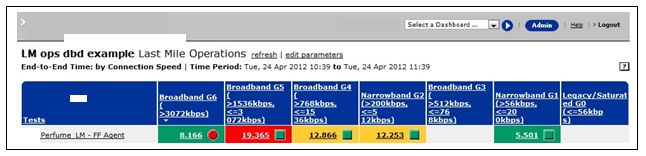
Figure 7-20. Key transaction bandwidth performance
Visitor performance map
Heads-up display of aggregate visitor satisfaction (performance versus user-defined thresholds) for satisfactory (green), tolerating (amber), and frustrating (red).
Global view (illustrated in Figure 7-21)—site performance by country. Such displays are particularly suited to the display of visitor-based passive (RUM) data. All major vendors now supply such a view as standard within their products.
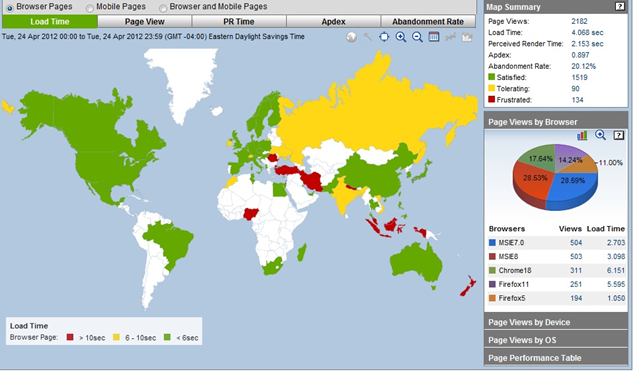
Figure 7-21. Performance trend—24hr
Figure 7-22 shows performance over a rolling 24-hour period, illustrating the relationship between site traffic and performance. The tabular display below it shows metrics based on pages, originating ISP, visitor browser/version, and geographic location. It is color-coded to show the trend versus the previous day or week.
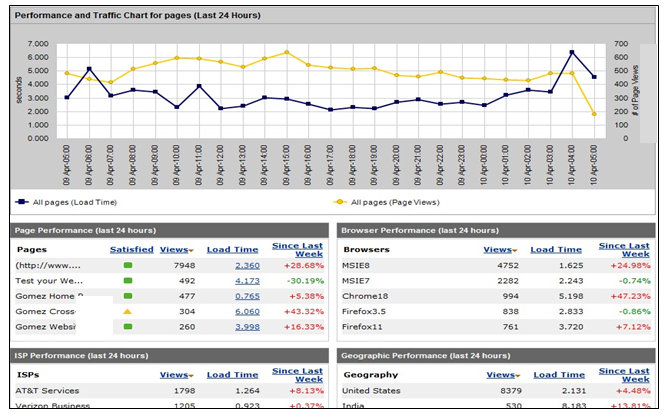
Figure 7-22. Visitor satisfaction
The stacked bar chart shown in Figure 7-23 displays the relationship between (proportion of) customer satisfaction (satisfactory/tolerating/frustrated—the APDEX adopted by many vendors in recent years) versus overall site traffic. Such a display is useful for highlighting traffic-related performance issues.
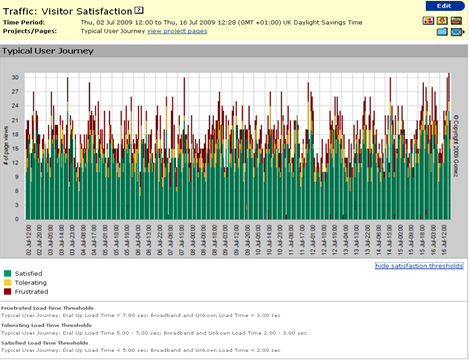
Figure 7-23. End-user visitor satisfaction
Alerting
The core issue with alerting is not whether a given tool will generate alerts, as anything sensible certainly will. Rather, the central problem is what could be termed the actionability of the alerts generated. Failure to flag issues related to poor performance is clearly deficient, but unfortunately over-alerting has the same effect, as such alerts will rapidly be ignored.
Effective alert definition hinges on the determination of normal performance. Simplistically, you can determine this by testing across a business cycle (ideally, a minimum of three to four weeks). That approach is fine provided that performance is reasonably stable. However, that is often not the case, particularly for applications experiencing large fluctuations in demand at different times of the day, week, or year.
In such cases (which are extremely common), the question becomes at which point of the demand cycle should you base your alert threshold? Too low, and your system is simply telling you that it’s lunchtime (or the weekend, or whenever greatest demand occurs). Too high, and you will miss issues occurring during periods of lower demand. There are several approaches to this difficulty, of varying degrees of elegance:
-
Select tooling incorporating a sophisticated baseline algorithm that’s capable of applying alert thresholds dynamically based on time of day, week, month. Surprisingly, many major tools use extremely simplistic baseline models, but some (e.g., App Dynamics APM) certainly have an approach that assists. When you’re selecting tooling, you’ll find it worthwhile to investigate this area.
-
Set up independent parallel (active monitoring) tests separated by maintenance windows, with different alert thresholds applied depending upon when they are run. This is a messy approach that comes with its own problems.
-
Look for proxies other than pure performance as alert metrics. Using this approach, you set a catch-all performance threshold that is manifestly poor regardless of when it is generated. This is supplemented by alerting based upon other factors that flag delivery issues. Examples include the following:
-
Payload—that is, error pages or partial downloads will have lower byte counts. Redirect failures (e.g., to mobile devices) will have higher-than-expected page weights.
-
Number of objects.
-
Specific flag objects.
-
-
Ensure confirmation before triggering an alert. Some tooling will automatically generate confirmatory repeat testing, whereas some will enable triggers to be based on a specified number or percentage of total node results.
-
Gotchas—make sure to account for these. Good test design—for example, controlling the bandwidth of end-user testing to screen out results based on low-connectivity tests—will improve the reliability of both alerts and results generally.
Passive (RUM)-based alerting presents its own difficulties. Because it is based on visitor traffic, alert triggers based on a certain percentage of outliers may become distorted in very low-traffic conditions. For example, a single long delivery time in a 10-minute time slot where there are only 4 other normal visits would represent 20 percent of total traffic, whereas the same outlier recorded during a peak business period with 200 normal results is less than 1 percent of the total. Passive (RUM) tooling that enables alert thresholds to be modified based on traffic is advantageous. While it does not address the normal variation issue, replacing binary trigger thresholds with dynamic ones (i.e., an alert state exists when the page/transaction slows by more than x% compared to its average over the past period) can sometimes be useful. Some form of trend state messaging (that is, condition worsening/improving) subsequent to initial alerting can serve to mitigate the amount of physical and emotional energy invoked by simple fire alarm alerting, particularly in the middle of the night.
A few final thoughts on alerts post-generation. The more evolved alert management systems will permit conditional escalation of alerts—that is, alert group A first, then inform group B if the condition persists/worsens. Systems allowing custom-coding around alerts (such as Neustar) are useful here, as are the specific third-party alert-handling systems available. If using tooling that permits only basic alerting, you might consider integration with external alerting, either of the standalone service type, or (in larger corporations) integrated with central infrastructure management software. Lastly, as far as delivery mode, email is the basis for many systems. It is tempting to regard SMS texting as beneficial, particularly in extreme cases. However, as anyone who has sent a celebratory text on New Year’s Eve only to have it show up 12 hours later can attest, such store-and-forward systems can be false friends.
Gotchas!
Arguably, active (synthetic) external monitoring, to a greater extent than related disciplines such as application performance or passive (RUM) monitoring, is prone to errors of interpretation. These typically stem either from poor test design (not framing the question with sufficient rigor) or from failure to control the quality of the data obtained. However, as I have reiterated several times, clean-room testing, while necessary, is insufficient within a comprehensive performance management schema designed to maximize end-user satisfaction. Unfortunately, the more you try to replicate end-user conditions, the more dangers arise in capturing and reporting erroneous findings. The following list summarizes some of the areas for which it is important to check and control:
- Target destination errors
-
You know what you entered as a test target. However, redirects, whether intentional or accidental, can lead to your testing something other than the intended page. Typical examples are the delivery of a PC site to a mobile device, or the delivery of a partial or error page instead of the complete version. Validate tests (particularly if abnormally fast or slow) by examining the size of the page downloaded and/or the number of objects. If available, consider using screen capture functionality to confirm.
- Failure to discriminate between “fatal” errors
-
Fatal errors (i.e., those causing a page to fail, as opposed to individual content failures) are reflected as lack of availability in active testing. Always examine the point at which a page failed (i.e., how many objects successfully loaded). In addition to often providing insight into the nature of the root cause, such investigation will often indicate whether the error is of one consistent type or a mixture (although the latter may still have a common cause).
- Latency
-
Ensure that aberrant results are not due to round-trip latency (e.g., from poor ISP node selection or inadvertent inclusion of end-user peers using distant proxy DNS servers).
- Peerage
-
Group and compare results by ISP. Although there will always be some variation, systemic problems will be obvious if results over an extended period are compared. Filter and compare end-user results by tertiary ISP (and/or set up confirmatory tests) if in doubt.
- Banding
-
Average traces (while they have their uses) can hide a multitude of detail. Always examine a scattergram trace of individual results to identify patterns of outliers or the delivery of banded clusters of results. Further examination at object level may provide further insight. Banding is commonly an indication of poor load-balancer configuration.
- Browser version
-
Passive (RUM) data can be useful in identifying performance differences between browsers or versions—provided the browser concerned is recorded by your passive (RUM) tooling. Beware of reliance on active testing from a single browser agent without cross-validation.
- Device and/or PC client limitations
-
Differences in processor speed, operating system, signal strength, and memory state (and more) can affect recorded performance.
- Native versus third-party domains
-
Third-party affiliates can have significant and unpredictable effects on performance. Always examine at individual object level, plot suspect objects individually, and/or run confirmatory tests with object filtering.
- Connection speed
-
Particularly when testing from end users (especially if using wireless carriers), you absolutely must filter out any very low connectivity tests (and/or clearly specify test conditions). Very low connectivity conditions are extremely distortive. They can lead you to draw incorrect inferences despite them being, in fact, a correct representation of performance in those conditions.