
CHAPTER 7
HEALTH
Predict the future of customer-led growth for your organisation
C-CHANGE TAKEAWAYS
- Customer Health measurements are objective and data-driven – use them to better understand and predict customer behaviours, wants and needs – without even asking them! While an effective Voice of the Customer (VoC) programme is critical to understanding your customers, it represents only one side of the coin.
- Build a Customer Health index (CHI) to objectively measure your entire organisation's company-wide impact on the Customer Experience (CX). This index helps you better identify where to improve CX and how to mitigate the risk of customer churn or defection. Ensure this index is aligned to the customer journey you have built for your key customer segments. Set goals and compensation models for each function linked to the index.
- Develop client-specific health scores to align your own organisation's goals according to those of the customer. Link these scores back to the key performance indicators (KPIs) of the Customer Success teams. This will ensure that your organisation is focused on the things that matter to your customer, which will drive sustainable growth.
Customer Health is a new technique when it comes to understanding and predicting the views and behaviours of your customers. It provides real-time customer-led insight and intelligence to your entire business to drive the appropriate actions in support of sustainable business growth. It uses big data and artificial intelligence (AI), analysing multiple data sources to understand the total health of your customers throughout their entire journey with your organisation.
In the Voice of the Customer chapter, we exposed some of the drawbacks of relying solely on survey data, when it comes to understanding customers' feelings, opinions and, ultimately, actions. Customers simply get tired – especially if they see little or no positive follow-up after they have provided their feedback. Also, we considered some of the drawbacks associated with existing measurement systems such as the net promoter score (NPS). This is especially true for companies who run annual NPS surveys where responses can be many months out of date. The information gathered may represent just a small subset of ‘lagging indicator’ data points which do not tell the whole customer story, and will not necessarily allow a company to predict future customer behaviours.
Steven Walden, author of Customer Experience Management Rebooted, adds to this by stating that surveys are not always the best at helping us understand causality, sentiment or meaning with customers. Claire Sporton, CX leader at Confirmit, shares similar thoughts. Claire believes there are now tremendous opportunities to understand and, most importantly, to predict customer behaviours using other sources. These sources can include customer intelligence (whether from operational data, text or voice analytics) – and increasing AI. Indeed, Richard Owen, ex-CEO of Satmetrix, goes a step further by stating that the future is survey-less.
Despite their drawbacks, surveys are still an important part of a company's VoC measurement toolkit today. When combined with other VoC channels, it is possible to build an instant and continuous customer feedback loop, using both quantitative and qualitative data. This helps you to truly understand what customers are saying about the company and your products and services.
However, the VoC is just one side of the coin. What if companies could compare VoC knowledge with their own operational data to understand the health of every customer or consumer with which a company does business? It is already possible today to understand the health of the client base before the customer even tells a company what is happening in its commercial relationship! This is achieved by using ‘big data’ approaches (where data analysts can spot trends and causal links in data to reveal customer trends such as buying habits that are not apparent to the naked eye). Also, AI (where software algorithms teach themselves to ‘learn’ to read the data with increasing accuracy and insight) can facilitate this too. This applies equally in both B2B and B2C environments. As Clive Humby, ex CEO of leading data firm Dunhumby, pointed out, data is the new oil in the Customer Economy. It is all about how you mine the data to provide the right customer insight.
By way of further example: in a recent article in Forbes in 2019, Tom Taulli listed the ways in which AI will change B2B marketing forever. He interviewed Casey Carey, Product Marketing Leader at Adobe, who suggested that AI will help:
- Better identify target audiences to deliver more intelligent customer segmentation
- Provide more relevant offers and content
- Enable the selection of the best and most timely omnichannel communication routes
- Deliver the most insightful analytics of customer and consumer behaviour.
PUTTING A CUSTOMER HEALTH INDEX (CHI) IN PLACE
In the customer experience chapter, we considered ways in which companies can map out the journeys that their customers typically take with them. Most importantly, these journeys can be normalised (i.e. standardised into a single or small group of journey types) to produce a common customer journey framework, or a set of frameworks, which allow organisations to measure customer-aligned, cross-functional data.
The example in Table 7.1 is a common journey framework, which was validated with over 50 clients, developed by Misys (later Finastra), one of the world's leading fintechs. (For more information about the Misys CHI, see the case study later in this chapter.) This Misys customer journey framework comprises 10 stages, with each one being assigned a primary functional owner, as indicated in Table 7.1.
TABLE 7.1 Example journey stages from Misys.
Source: Finastra, with permission.
| Customer journey stage | Primary functional owner/department |
| Awareness and consideration | Marketing |
| Customer need assessment | Inside sales |
| Proof of concept | Pre-sales |
| Partner engagement | Partners |
| Purchase | Sales |
| Product/service implementation | Services |
| Post-sales support | Support |
| Training and communication | Training |
| Renewal and repurchase | Sales |
| Recommendation and endorsement | Marketing |
Once each customer journey stage is defined and each function owner is agreed, a KPI or a set of KPIs need to be agreed with each function for each part of the journey. The KPIs then should be weighted and normalised according to a % score, providing a health score for each journey stage and an overall score for each customer. By normalising data across many customers, it becomes possible to stack rank and compare clients against each other to understand the health of the entire business, from a customer. This is in contrast to measuring clients by the amount of pipeline they generate or their renewal value. Operational data about customers can come from a variety of sources and systems.
One of the most important factors in determining which KPIs to choose is what data is available, as well as how complete and accurate the data is. There is sometimes a trade-off between what the perfect, customer-aligned KPI should be, what the respective department is able to measure, and what data is available. Defining the perfect KPI or set of KPIs can be challenging, even if the rewards are massive.
OPERATIONAL DATA TOO INTERNALLY FOCUSED? WHAT ABOUT CUSTOMER-LED KPIS?
In the Customer Success chapter, we pointed out that many Customer Success metrics (or measurement of client outcomes) are too internally focused, and that Customer Success Managers (CSMs) should align with the customers' measures of success. This is true, especially at an individual customer level. However, this is a complementary perspective to that of establishing a CHI using a company's own internal data sources. It would, after all, be almost impossible to normalise the customers' own measures of success across multiple clients.
In order to implement change inside an organisation, individual departments still need to make a quantifiable link between their departmental or function-specific activities and the overall CX or health. For example, customer support tickets still need to be raised and issues need to be fixed, and projects still need to be tracked and delivered (hopefully on time and to budget). In addition, sales still needs to close deals. The power of CHI is that it turns internally focused, operational data into customer-aligned information which gives the business a standardised view for each single client, so that any business leader can compare apples with apples when assessing the health of their customer base.
Often, internal operational data is only ever seen at a macro or cross-regional level. For example, solution sales teams like to see the total sales pipeline for their product and services portfolio across multiple geographies. Similarly, marketing likes to see the total pipeline supported by an entire marketing campaign. As we said in the introduction, this often distracts executive attention from the real issue, the health of the customer base – as reflected by a set of customer-specific cross-company KPIs. Hence, when this data is reported in this way, at each individual customer level, it becomes powerful.
CUSTOMER HEALTH SCORES: GO DEEP AND OUTSIDE-IN TO UNDERSTAND ROOT CAUSES
The CHI, described in the preceding text, helps organisations understand their entire business and functional performance from the lens of the customer. This is a key perspective, especially for business leaders, so they can see the operational impact of each function's performance to customers.
However, Customer Health scores at an individual level can go deeper and do not necessarily need to include usage data. At Pulse Europe in 2018, Gainsight's Customer Success conference in London, Charli Rogers and Dave Jackson produced an ‘Advanced Health Scoring’ workbook. Designed to help CSMs intelligently assess how the overall health of their individual customers can be measured, they advised using health scores more than churn risk and to focus on the statistical reliability of the data components in the health score (see Figure 7.1). Most importantly, health scores should give some insights into how well the customers are achieving their goals with the product, which is the most important driver of retention for B2B SaaS customers.
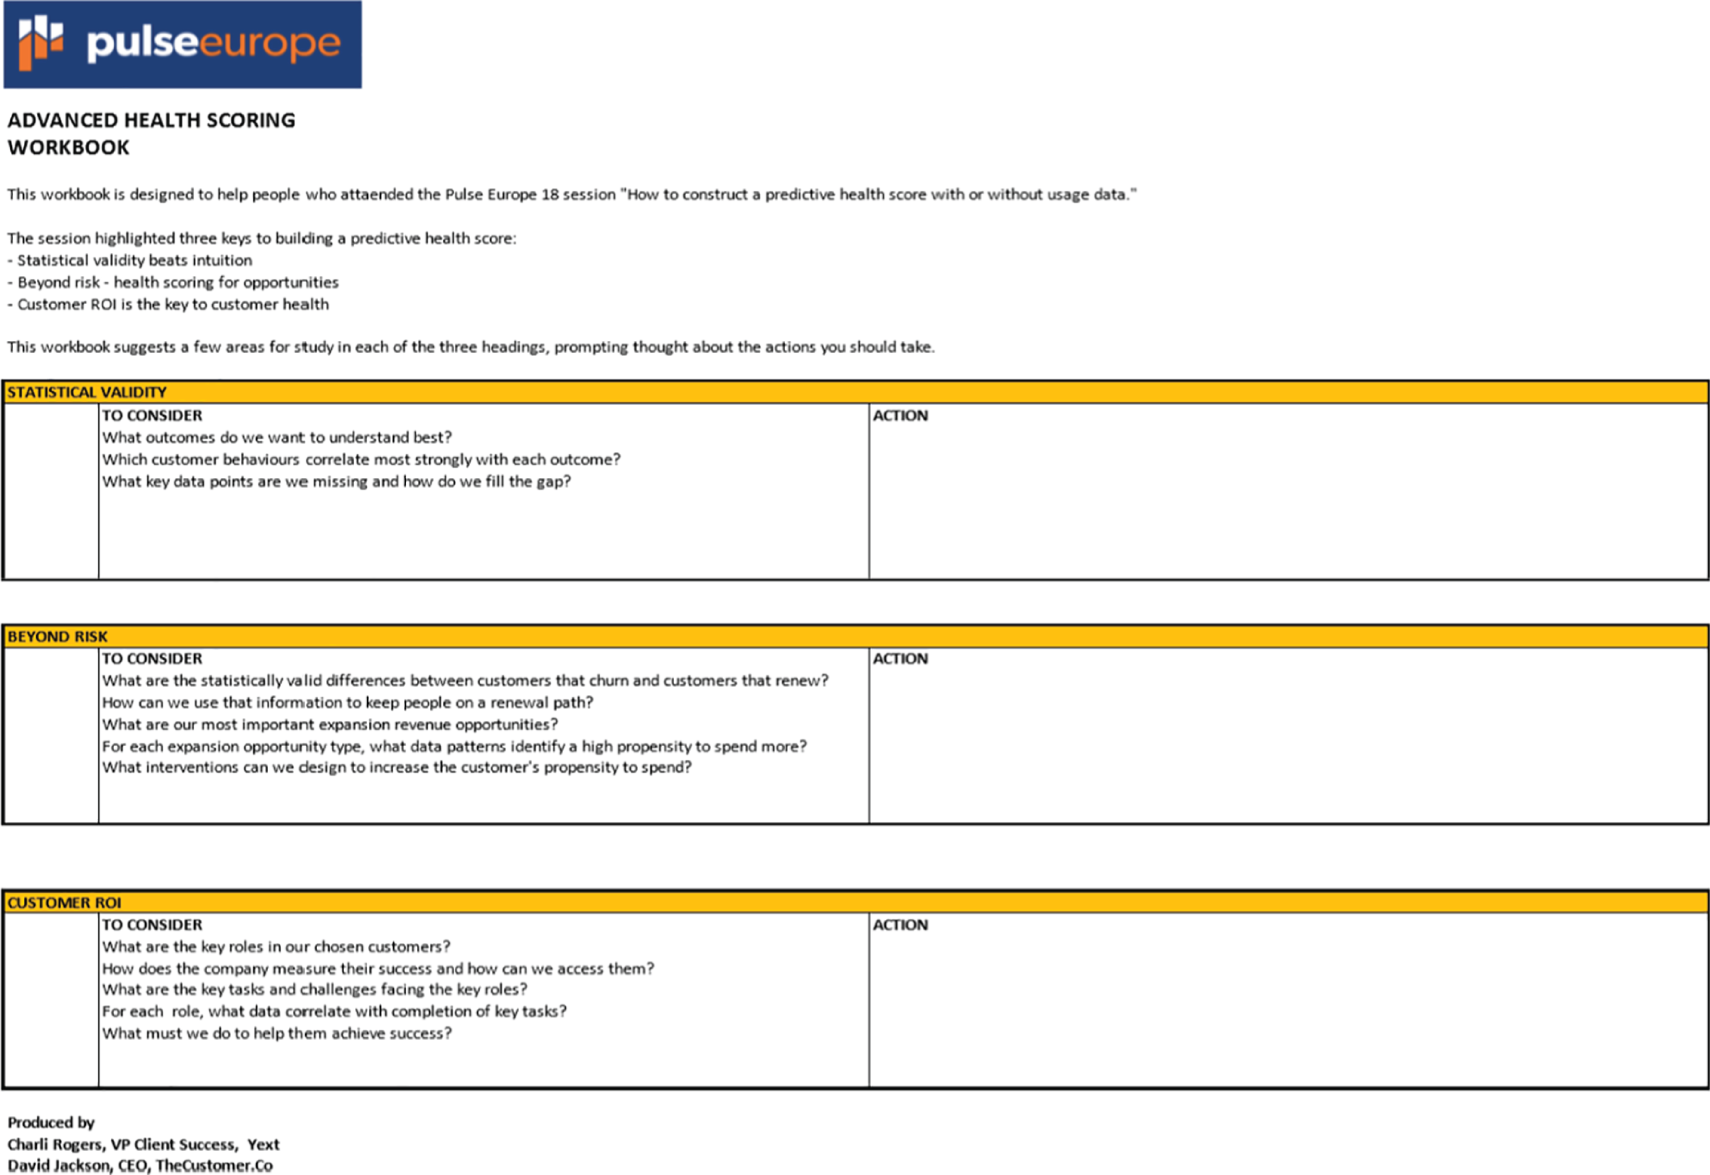
FIGURE 7.1 Advanced Health Scoring checklist.
Source: Dave Jackson. Reproduced with permission.
CUSTOMER HEALTH: WHAT CAN BE MEASURED?
When it comes to choosing the right measures, the possibilities are (almost) endless. The Finastra CHI, described later, contained 30 data points and shows a broad selection of measurements.
In her recent blog article titled ‘How do you measure CX success?’, leading CX expert Annette Franz listed out many possible considerations, including more employee-related measures around more qualitative issues such as culture, employee retention and employee satisfaction. Annette's suggestions are listed in Box 7.1.
While many of these measurements might be hard to implement in a pan-organisation CHI, they might be useful considerations at the customer level (e.g. by a CSM), or as macro-level, organisational metrics.
DO NOT LET PERFECT BE THE ENEMY OF GOOD
Recently, the magazine B2B Marketing produced a report titled ‘How to measure and monitor CX’. It considered many perspectives around the metrics of companies looking at improving their CX. According to author Paul Snell:
‘With so many metrics to track, there is the potential to go round in circles to find exactly the right dashboards to produce. The metrics are only ever an indicator and what really counts is action’.
In other words, while it is important to do as much up-front thinking and constructive discussion about metrics, with customers and employees alike, it is arguably more important to turn these insights into action. We will consider some of the work of Hg Capital in this light.
CUSTOMER HEALTH: AI AND BIG DATA
Customer Health scores and indices have the potential to leverage a lot of data. As you will see with the Finastra and Hg Capital Customer Health programmes, significant volumes of data and sources of data have been consolidated to produce a health score for their customers and those of their portfolio companies. This is starting to allow companies to develop sophisticated algorithms. In some cases, self-learning algorithms (like AI) will help them to better predict customer behaviours or recommend next best actions – for example, which departments need to be more proactive in engaging with the client.
AI AND BIG DATA: SOME WORDS OF CAUTION
In the customer experience chapter, we argued that ‘human first, technology second’ was a key principle when companies look to driving a positive experience for customers. Organisations should retain a healthy scepticism about the role of new and emerging technologies alone being a force for positive transformation. On a similar note, and according to Claire Sporton, Confirmit CX leader, ‘In many ways, I feel like we've gone back years with AI. We must look at causality and correlation and how it benefits customers before getting lost in data. Data alone is dumb’.
CASE STUDY: MISYS CATALYSES REVENUE GROWTH WITH THE HELP OF ITS CHI
In 2016, the UK-headquartered financial technology provider Misys launched the first version of its CHI. The company was combined with Canadian fintech D&H in 2017 to become Finastra. The new company brings breadth and depth across all areas of financial services: retail banking, transaction banking, lending and treasury and capital markets. Finastra has a global footprint, US$1.9 billion in revenue, 10,000 employees and over 8500 customers, including 90 of the top 100 banks globally.
CHI was the brainchild of Martin Haering, Chief Marketing Officer at Finastra, (see Figure 7.2). The company trademarked the CHI logo (see Figure 7.3) and unveiled this new technique for measuring customer centricity. As part of its ongoing strategic and operational push for customer-led growth, the CHI – together with its client engagement programme, Misys Connect – was a major factor in the reverse-significant annual loss of new deals to a significant increase in new deals over a 5-year period.

FIGURE 7.2 Martin Haering, CMO, Finastra.
Source: Martin Haering. Reproduced with permission.
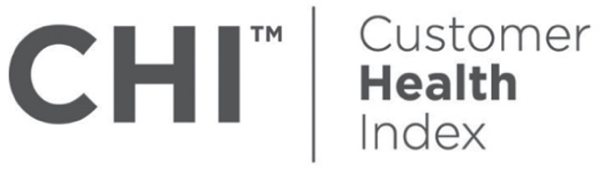
FIGURE 7.3 CHI logo.
Source: Martin Haering, Finastra. Reproduced with permission.
By launching the CHI, Misys became the pioneer of a brand-new, multi-variant, predictive algorithmic model for measuring Customer Health. At the time, Misys possessed a 2000-strong customer base, comprising mainly enterprise and mid-sized financial services organisations located across the world. In launching the CHI, Misys could measure the health of all its customers using 30 real-time, operational data points that it could derive from its CRM system, salesforce.com.
The journey to the CHI started in 2013. The company looked to the future by analysing all open sales opportunities across the globe. It turned out that the majority of all new license deals, both in terms of volume and value, were from existing customers. Adding renewal values on top, the company soon realised that over 90% of projected future business revenues and growth came from existing clients. Also, Misys analysed the average number of products per client, and it was clear that the opportunity for cross-sell and upsell was huge. According to Haering, ‘In 2013, we were losing a significant amount of net new revenue per year because of a lack of healthy, referenceable clients’. Hence, Misys set about addressing this issue.
As a forward-thinking, customer-centric marketing leader, Haering was dissatisfied with NPS and other industry-standard customer satisfaction measurements. So much so, in fact, that he even wrote a blog article in 2017 titled ‘NPS is dead’ (see Figure 7.4). The blog went viral, and he successfully managed to engage thousands of NPS supporters and sceptics in healthy discussion in the process. It was an inspired piece of brand awareness which cost nothing in programme-spend terms.

FIGURE 7.4 ‘NPS is dead’, LinkedIn blog.
Source: Martin Haering, Finastra. https://www.linkedin.com/pulse/nps-dead-martin-häring/?trk=prof-post. Accessed by Chris Adlard and Daniel Bausor on 18th June 2019. Reproduced with permission.
In his blog, Haering stated, ‘Basing customer satisfaction on a single question is a narrow and inaccurate measurement which does not take into account the full picture and definitely loses pace in an increasingly digitalised world. The answer to that single question [‘Would you recommend this company?’] is often driven by the last experience with the business, failing to give the complete view of the customer mindset and interactions that will have taken place right across the organisation’.
CHI provided an alternative that is far more suitable for a customer-centric organisation. According to Haering, ‘CHI is a transformational Customer Health framework that helps businesses align internally to better serve their customers. It provides an objective, normalised measure of Customer Health based on the full customer lifecycle from the moment the customer gets aware of your business to the moment they renew or upgrade your service or product’.
HOW WAS THE CHI CREATED?
Haering's mission for his Customer Engagement team was first to establish a common customer journey comprising 10 stages. This was planned with a single business function defined as the primary owner of its respective stage of the journey. The common customer journey was co-created with a selection of customer advocates. Then, it was sense-checked with customers at the company's annual customer advisory board meetings.
CONFRONTING THE BIGGEST CHALLENGE: CUSTOMER-CENTRIC KPIS!
Each stage of the customer journey, and therefore each function, had to select three customer-centric KPIs. Haering notes, ‘Choosing three KPIs sounds simple, but, in fact, it was the hardest part of building the Customer Health index. Every function had a vested interest in making their own department look good. The key was to define KPIs that provided the most balanced and insightful view of Customer Health, not ones that measured purely internal aspects of business performance’.
Once the KPIs had been defined, they were then laid out on a scale between 0 and 100, and the average of the three KPIs was built to give each function/stage a final score. Finally, all the stages were weighted. An overall CHI score could be displayed to cumulatively reflect the scores and relative weighting of all stages. The final score was between 0 and 100. The higher the score, the higher the probability that Misys had a healthy customer relationship. The following screenshots (see Figures 7.5 and 7.6) show the stage descriptions, functional owners and KPIs in each stage. In the following text, there is a more detailed breakdown of KPIs and their relative weightings that was used upon CHI launch.
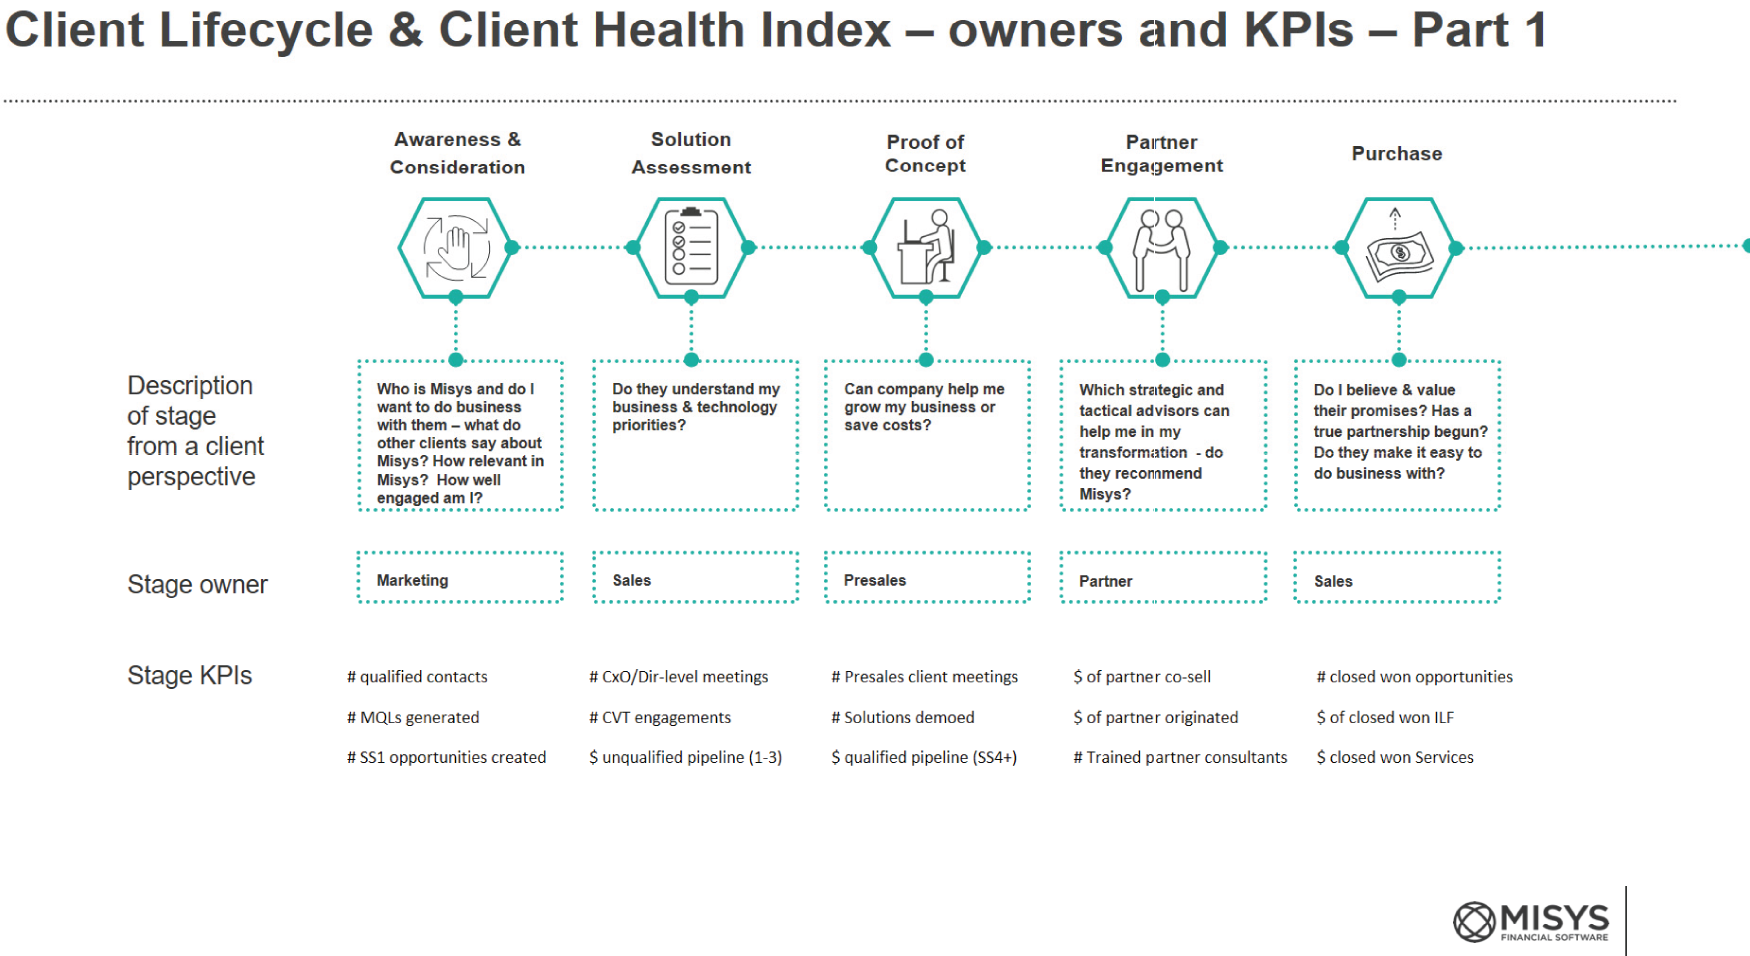
FIGURE 7.5 Customer Journey, Part 1.
Source: Martin Haering, Finastra. Reproduced with permission.
FIGURE 7.6 Customer Journey, Part 2.
Source: Martin Haering, Finastra. Reproduced with permission.
This meant that every customer could end up with a single health score, derived from 30 cross-functional KPIs. Since these scores were real-time, the CHI score could change on a daily basis. For impact, each score was colour coded – red, yellow or green – to represent areas of risk, concern or positive performance. Figure 7.7 is an example of how the CHI looks.
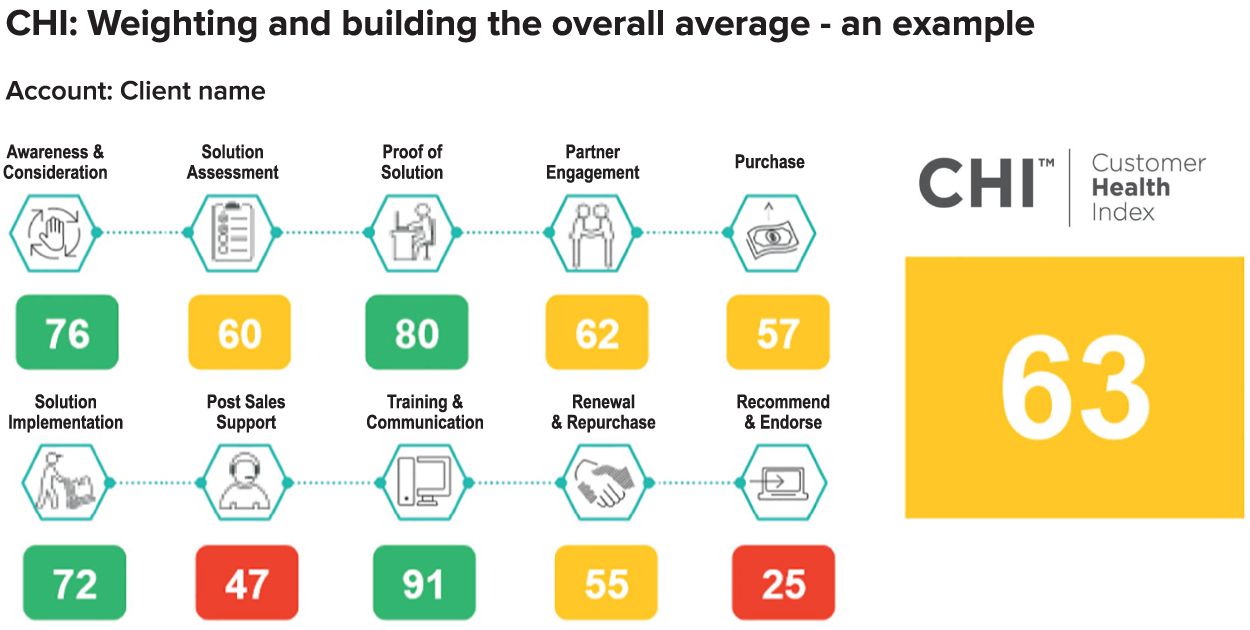
FIGURE 7.7 CHI with example scores.
Source: Martin Haering, Finastra. Reproduced with permission.
The CHI was then integrated into the company's account planning tool, Revegy. This allowed account managers (and, subsequently, CSMs) to track and improve the overall health scores of every customer to whom they were assigned. Thanks to the CHI and the customer engagement programme, Misys was able to capture the closure of significant net new revenue through a referenceable client base, thus reversing the original problem.
Since the combination of Misys and D&H, and the acquisition of thousands of new customers, Finastra is considering future iterations of the CHI that could better reflect the different customer segment groups associated with the new business.
The benefits
The CHI helps to improve the end-to-end CX – for example, to develop even more personalised and engaging marketing content; generate more senior-level customer meetings; maximise the effectiveness of customer engagement programmes; and decrease the number of outstanding invoices. The CHI table given in Table 7.2 provides a full breakdown of all the areas of improvement that CHI can help facilitate.
TABLE 7.2 The Finastra Customer Health Index
Source: Misys. Reproduced with permission.
| Stage | Stage weight | KPI | Definition | Health Score |
| Awareness and Consideration | 5% | Number of qualified contacts | Number of contacts with full details who have not opted out of email |
|
|
||||
| Number of MQLs generated | Number of contacts or leads who have not opted out of email and whose lead status is “Marketing Qualified Lead (MQL)” or “Marketing Engaged Lead (MEL) |
|
||
|
||||
| Number of SS1-3 opportunities created | Number of open opportunities which are currently in stages 1-3 (Plan, Create or Qualify) |
|
||
|
||||
|
||||
|
||||
|
||||
|
||||
| Need Assessment | 5% | Number of C/D-level meetings | Number of tasks / events completed in the last 12 months, where the contact has a level of 1 (C-level), 2 (Division head) or 3 (Head of business line) |
|
|
||||
|
||||
|
||||
|
||||
| Number of CVT engagements | Number of opportunities at the account created in the last 12 months where the CVT has been engaged |
|
||
|
||||
|
||||
| $ Unqualified pipeline | Amount of all ILF opportunities which are currently in stages 1-3 |
|
||
|
||||
| Proof of Concept | 10% | Number of presales client meetings | Number of tasks completed in the last 12 months where the sales role is GSC (BSG) Sales |
|
|
||||
|
||||
|
||||
|
||||
|
||||
| Number of demos | Number of tasks completed in the last 12 months where the sales role is GSC (BSG) Sales and the activity type is Customer Specific Demo, Generic Demo or Task Workshop POC |
|
||
|
||||
|
||||
|
||||
|
||||
|
||||
| $ Qualified pipeline | Amount of all ILF opportunities which are currently in stages 4-7 (Develop, Prove, Negotiate, Committed) |
|
||
|
||||
| Partner Engagement | 10% | $ Partner co-sell | Amount of all opportunities closed won in the last 12 months where a Partner has been used |
|
|
||||
| $ Partner originated | Amount of all opportunities closed won in the last 12 months where they have originated from that Partner |
|
||
|
||||
| Has certified partner consultants | Has an opportunity closed won in the last 12 months used a Partner that has certified consultants |
|
||
| Purchase | 10% | Number of closed won opportunities | Number of all ILF or PS (Services) opportunities closed won in the last 12 months |
|
|
||||
|
||||
| $ Closed won ILF | Amount of all ILF opportunities closed won in the last 12 months |
|
||
|
||||
| $ Closed won Services | Amount of all PS (Services) opportunities closed won in the last 12 months |
|
||
|
||||
| Solution Implementation | 20% | % Deviation from intended go-live | % Deviation between actual go-live date and intended go-live date on largest project in account. Defaults to 50% if no project. |
|
|
||||
|
||||
| % Business outcomes achieved | % Business outcomes achieved on largest project in account. Defaults to 50% if no project |
|
||
|
||||
|
||||
| % Deviation from original margin | % Deviation between actual margin and intended margin on largest project in account. Defaults to 50% if no project |
|
||
|
||||
|
||||
| Post Sales Support | 20% | Average resolution time for support requests | Average solution time for support request cases closed in the last 12 months |
|
|
||||
|
||||
|
||||
|
||||
| % Aged backlog of cases | % of open cases which are greater than 120 days old from all open cases |
|
||
|
||||
|
||||
| % Open defects with no targeted fix date | % of all defects which have no targeted fix date from all defects |
|
||
|
||||
|
||||
| Training and Communication | 5% | Number of contacts on Misys University | Number of contacts that have attended the Misys University (Academy) programme since 1st June 2015 |
|
|
||||
|
||||
|
||||
|
||||
|
||||
| Number of contacts on CABs, SAGs & UGs | Number of contacts that have attended a Customer Advisory Board, User Group or engaged SAG since 1st June 2015 |
|
||
| Number of contacts attending Misys Forum & Solution Days | Number of contacts who have attended a offline campaign in the last 12 months |
|
||
| Renewal and Repurchase | 10% | Number of active product sets | Number of active product sets |
|
|
||||
| $ RLF at risk | Amount of RLF at low, medium and high risk of loss |
|
||
|
||||
| $ Invoices outstanding | Amount of all overdue unpaid invoices |
|
||
|
||||
| Recommendation and Endorsement | 5% | Number of products they act as reference for | Number of products the customer has agreed to act as a reference for |
|
|
||||
|
||||
|
||||
|
||||
|
||||
| Number of supported reference activities | Number of times a client has either hosted a reference call or visit |
|
||
|
||||
|
||||
|
||||
|
||||
| Marketing / PR endorsement provided | Has the customer provided a marketing or PR endorsement |
|
CASE STUDY: HG – TAKING CUSTOMER HEALTH SCORES TO NEW HEIGHTS
Hg is a specialist private equity investor, primarily focused on software and service businesses. Hg is committed to ‘building businesses that change the way we all do business’, through deep sector specialisation and dedicated operational support. This means they are interested in investing and growing businesses for the benefit of their employees, customers and investors, which, in turn, leads to medium-term growth and profitability.
Customer Health as a portfolio assessment tool
Given the nature of the industry of Hg's portfolio companies (i.e. primarily SaaS and renewal software/services businesses), Hg places significant emphasis on the underlying causes and drivers (e.g. operations, processes, systems, culture, leadership, etc.) leading to net revenue retention (NRR) growth. For this reason, the assessment of a firm's customer-centric initiatives such as Customer Success and Customer Health is of paramount importance. According to Joachim Kiefer (see Figure 7.8), Operations Leader at Hg: ‘When we look at growing our portfolio, we carry out extensive due diligence around a company's philosophy and approach towards customer-centricity. Do they have a clear customer strategy, do they understand the ideal customer journey, do they have a customer maturity model? What is their approach to Customer Success? Then we go deeper into the day-to-day activities of customer-focused teams. For example, how are their Customer Success teams structured and incentivised, what is the quality of their customer onboarding?’

FIGURE 7.8 Joachim Kiefer, Principal, Portfolio Team at Hg
Source: Joachim Kiefer. Reproduced with permission.
That is not all. Also, Hg assesses the company's capability to score the health of their customers. Kiefer continues, ‘We like to know if the company in question has established a single view of the customer and whether they have executive support to drive cross-functional alignment around this single customer view. We also consider the capabilities and datasets of each prospective company to understand how a Customer Health scoring system can be layered on this single customer view. As a starting point, we always assess their net revenue retention and churn rates as key data points to understand the underlying quality of the customer base, and identify opportunities for improvement’.
Monitoring and improving Customer Health as a means of driving Net Revenue Retention
Once Hg invests in a company, they immediately make available their tools, guidance and operational experts. As part of this, Hg can put in place a health scoring system, using the Hg proprietary data analytics platform, which effectively automates NRR assessment across a business. The Customer Health scoring system collects data from a number of sources – including financial, operational, support and services systems – and maps it onto an analytics platform hosted in the cloud.
In order to accelerate the delivery of a Customer Health scoring system, Hg has a reference IT architecture that it recommends to its portfolio companies. Since platforms and data are the bedrock of all Customer Health scoring systems, Hg encourages its companies to adopt a best-practice blueprint of platforms, similar to that described in the Platforms chapter. However, this is by no means mandated – it is only encouraged, and is particularly valuable where portfolio companies have gaps in their technology. The great benefit of the analytics platform is that it is entirely flexible and can integrate with almost any system and a variety of datasets.
Hence, after just a few months' work by Hg's data analytics team, it is possible to produce a Customer Health scoring system for a given portfolio company. Once the Customer Health scoring system is in place, it helps Hg's portfolio companies drill down into the system to develop a whole host of customer-centric business insights. For example, what does the ideal client look like? Which clients should the business go after in the future? Which customers are most likely to churn? What are the next best solution sales opportunities? Even, which products and solutions are performing best with clients? The possibilities of predictive modelling across many areas of the business are endless.
Kiefer sums up Hg's view on Customer Health as follows: ‘At Hg, we live and breathe NRR as the ultimate measure of success of our portfolio companies. We always aspire to see NRR of 100% plus, which means we are not only helping our companies to minimise churn and keep their clients happy, we are also helping them to grow their business with them. Customer Health scoring provides an indispensable tool in doing this. In the private equity and investment market, the importance of NRR and Customer Health scoring is only set to grow’.
THE POWER OF COMBINING VOC AND CUSTOMER HEALTH
VoC information provides an essential view of how the customer is thinking and feeling about the relationship with a company. The CHI provides operational view. When the two perspectives are merged, by aligning them around a common customer journey framework, the combination can be very powerful in terms of understanding the customer base and driving customer-led growth.
Misys also updated its customer questionnaire to include more customer-centric questions that aligned to the same customer journey framework as the CHI. The questions were tested with customers first to check if they had meaning, and effectively represented the other side of the customer measurement coin (the former being the CHI) (see Figure 7.9).
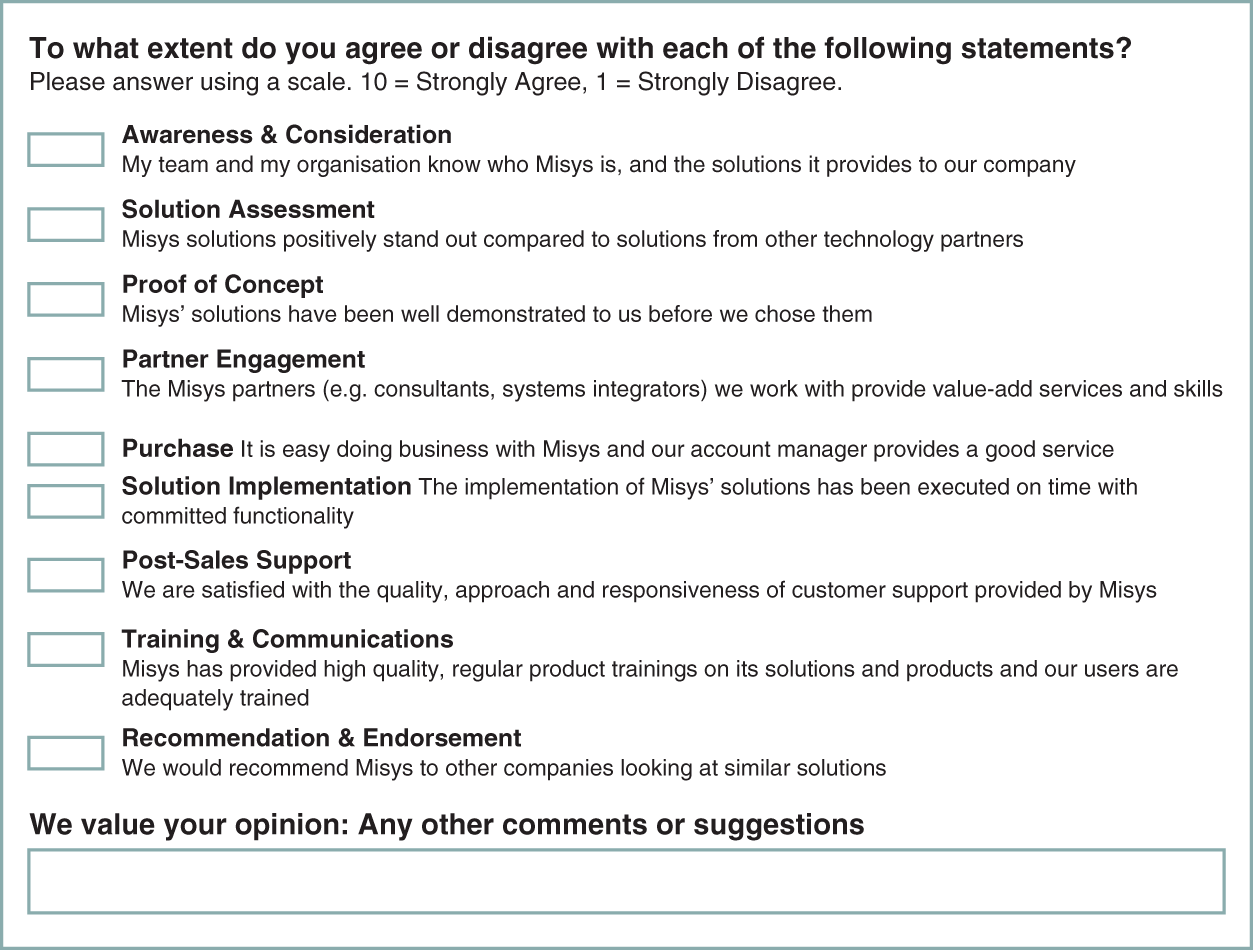
FIGURE 7.9 Aligning VoC to the customer journey.
Source: Martin Haering, Finastra. Reproduced with permission.
The following mock-up (not using live customer data) shows how Customer Health scores could be mapped to customer survey scores. This effectively meant that both leading and lagging indicators could be compared to balance the ‘as-is’ customer feedback against the ‘future-state’ likely actions. The example in Figure 7.10 shows, for example, that the customer was relatively happy today, but CHI data is showing warning signs for the future (e.g. increased likelihood of a customer to churn, not increase spend, etc.).
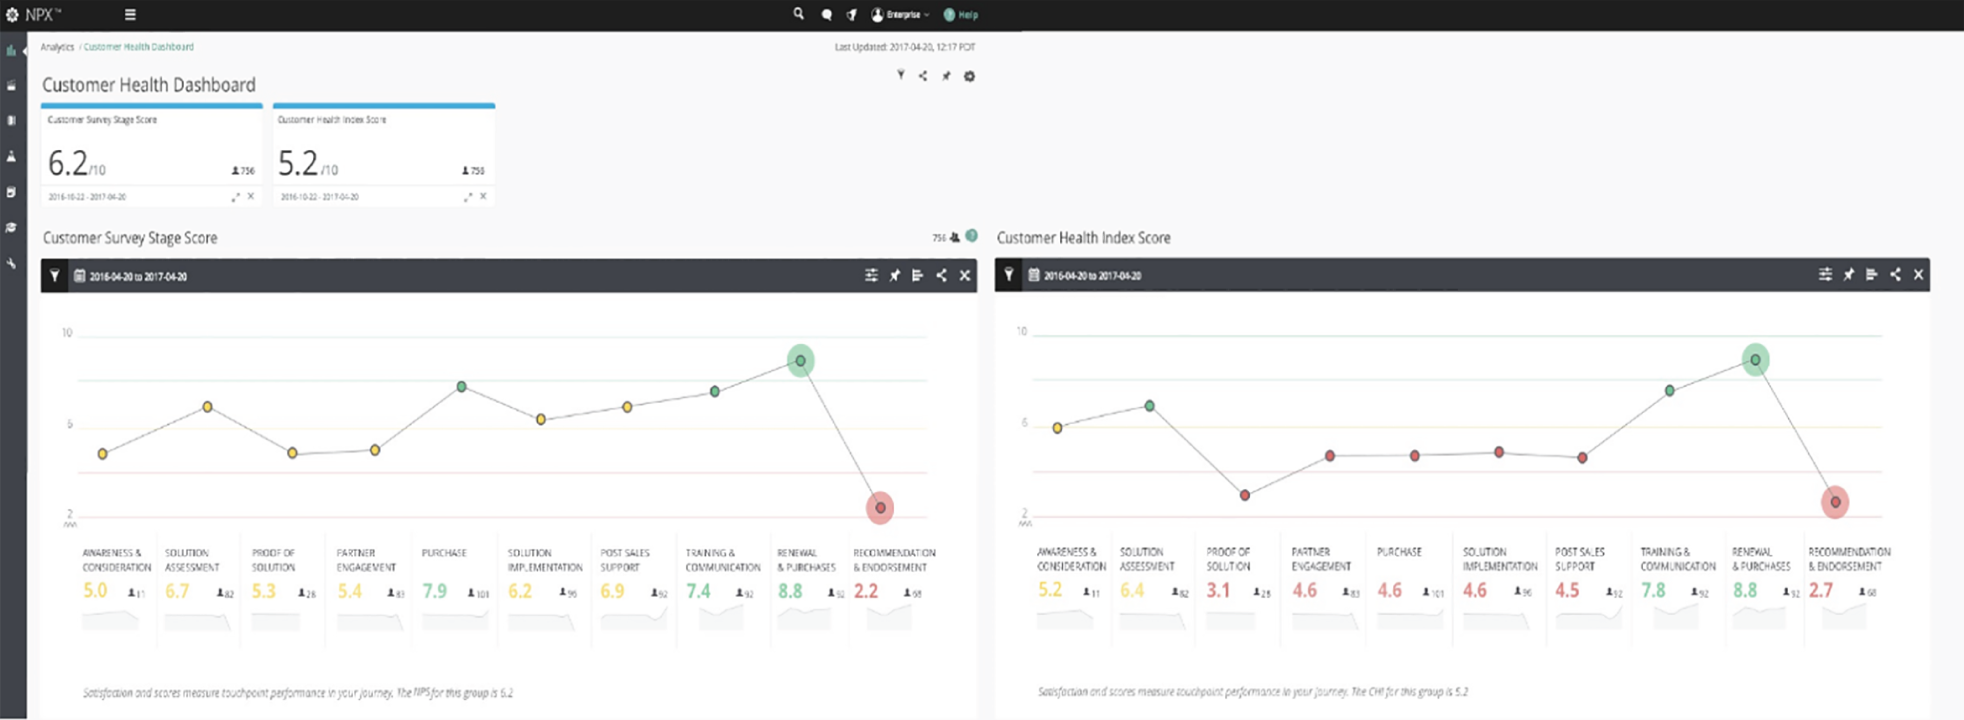
FIGURE 7.10 Comparing VoC and CHI scores.
Source: Martin Haering, Finastra. Reproduced with permission.
MAKING CUSTOMER HEALTH (AND VOC INFORMATION) ACTIONABLE
One of the biggest challenges of implementing customer-centric data is turning it into action. The CSM should be the ultimate orchestrator of cross-functional improvement to drive successful client outcomes. Therefore, embedding Customer Health and VoC information into the systems, tools and workflows of the CSMs, to trigger actions, is key.
Figure 7.11 is a screenshot of CHI (using sample data) that has been embedded into an account management planning tool (Revegy). The same principle can easily be applied in Customer Success management platforms such as Gainsight and Totango. Ultimately, one of the key roles of the CSM is to drive up health scores.
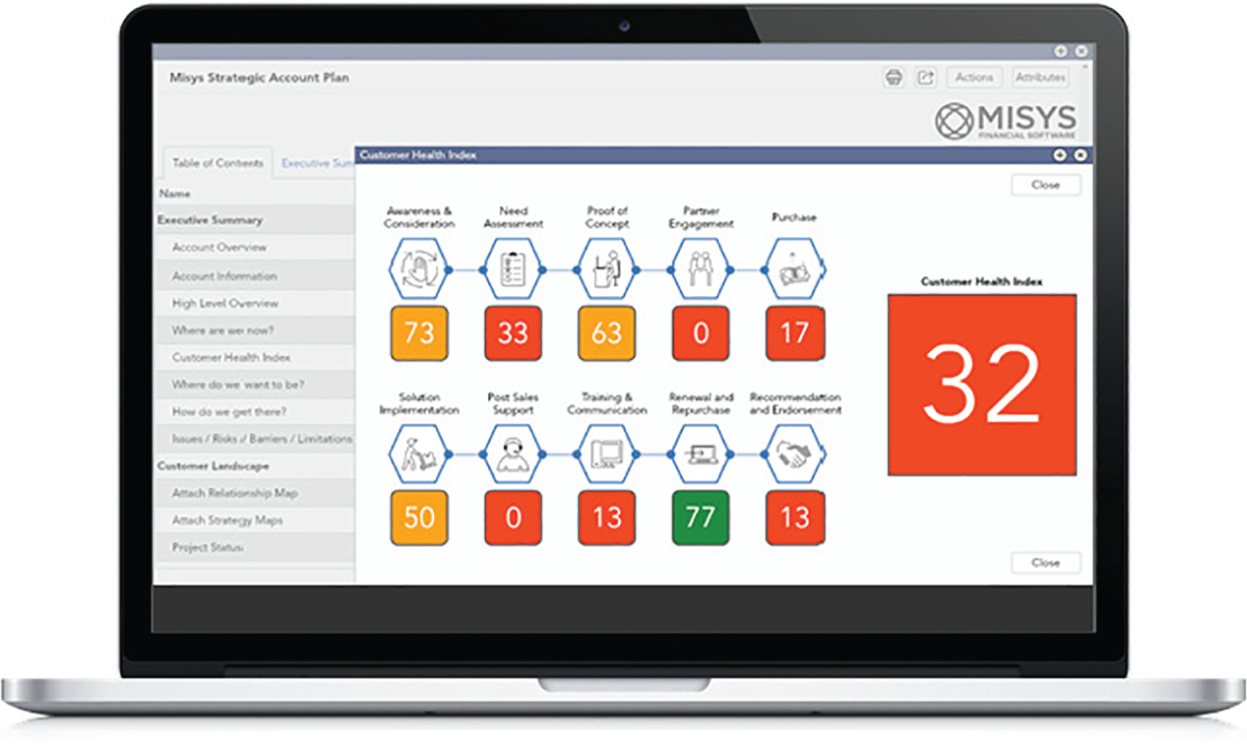
FIGURE 7.11 Embedding CHI scores into the account management (AM) or CSM workflow (screenshot showing sample data).
Source: Martin Haering, Finastra. Reproduced with permission.
CUSTOMER HEALTH AND COMPENSATION MODELS
Some companies put customer NPS into compensation plans for executives and customer-facing teams. This is a very risky approach and causes all kinds of gaming and manipulation of scores. For example, salespeople are likely to only ask for scores from happy customers or will encourage client contacts to skew their responses.
However, Customer Health scores are harder to game. Moreover, a CHI that is supported by all business functions can be more easily linked to the KPIs of ALL employees – whether they are directly interfacing with the customer or not. Everyone is ultimately part of the customer value chain, and their KPIs should align with the health scores of customers.
Therefore, as the organisation aligns more around the experience and customer journey, cross-functional team members should be compensated increasingly (either in salary or bonus terms) based on their impact on Customer Health scores. Even if this compensation is nominal, it is also an important message to the entire workforce. It says we are here to serve our customers, keep them happy and grow the relationship with them.
So, what can a CEO learn from Customer Health?
Today, organisations are generating huge volumes of untapped customer data, often packed with incredible yet unearthed insight. Often, all it takes is a data analyst, or a team of data specialists, led by, for example, a head of customer operations, to examine the data sources and compare them with the many VoC insight information sources and customer journey maps. Once they have done that, they can start building a CHI or a set of Customer Health scores.
Moreover, it is often better to assess people's true feelings and emotions based on their behaviours and actions, and not on their words. We should not assess them solely on how they respond to a survey, especially when survey fatigue is on the rise. For these reasons, Customer Health scoring and Customer Health indices will only become more prevalent in the future.