CHAPTER 15
Assess Your Starting Point
If you’re still reading, I will assume:
- You are frustrated with the inflexibility and diseconomy that decades of application-centric development have left us with.
- You accept the potential of the Data-Centric approach to reverse most of these trends.
- You are considering at least a partial model-driven future.
- You recognize some emerging technology that you might hitch your projects to.
- The case studies have created some proof that this approach can be brought to fruition.
Now, hopefully, you are wondering, “how can I get started?”
First understand that the transition to data-centrism is a journey, not just a few isolated projects. We believe that the journey starts with taking an objective assessment of your current situation.
Generally speaking, you’ll need to:
- Get a frank assessment of where you stand now. This will include quantifying areas that can be improved.
- Create a long-term road map. This will be a long-term transformation project. It won’t cost a lot, and after the first year or two the project will be funding itself, but it needs some consistency of support to thrive.
- Look for opportunities to jump-start the change process.
Accessing your current situation
This section is a bit long, but we think pretty essential. A detailed assessment of where you stand now will dispel any Pollyanna beliefs that you are already well on your way—unless of course, you are. We know a few firms that have made considerable progress on their own, but such firms are the exceptions.
Doing a detailed assessment will turn over a lot of rocks. Under some of those rocks will be opportunities that you can use to slingshot your transformation forward.
The other thing a detailed assessment will do is provide the metrics needed to stay the course. When you can start measuring tangible improvements that are coming from your architecture, it will be far easier to continue funding it.
Initial self-assessment
This self-assessment is available on our web site at: https://semanticarts.com/assessment/.
This will give you objective feedback on your responses. Ideally, several people in your firm would perform the assessment for a consistent read.
Data-centric self-assessment
The following are the questions from our self-assessment, along with their rationale.
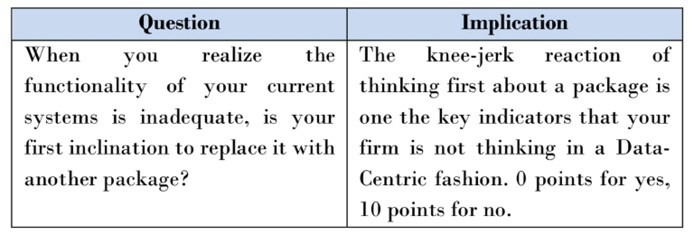


Most firms who are not yet on a Data-Centric path score 10 to 30 points. A perfect score of 100 points would represent a firm that has completely embraced the Data-Centric approach. Firms scoring over 70 points are considered Data-Centric, and well on their way to a fully mature environment. We discovered the S&P case study when they took this quiz online and informed us that they had scored 80 points.
Economic assessment
The next thing to do is a high-level information economic assessment. You can start with asking, “How much are we spending on information systems?” Depending on your industry, at a macro level, you are likely spending in the range of 3-10% of your gross revenue on Information Systems.60

If you are a $1 billion company, you are likely spending $50 million a year on your information systems. This is what you have to work with. As one of our clients says, this is “the size of the prize.” The rest of this section is about getting more precise and working out in your organization where the cost drivers really are and what the initial opportunities are.
Inventory
One of the first inputs you need is an exhaustive inventory of your systems and databases. If you are a large company, this very likely exists somewhere, and you just need to tap into it. If you are a medium to small company, you may have to take this on yourself. It’s not as hard as it sounds. Your IT department knows the main applications.
We worked for a State Agency that was concerned about the number of their applications and the complexity of the interfaces between them. They shared with us what they called their “spaghetti diagram”:

We strongly suspected this was just the tip of their under-documented iceberg of complexity. This State required all agencies to have a portfolio, which was a report describing all their applications. This portfolio contained the name, description, and key characteristics, such as technology, platforms, and number of users. It also contained a section with key interfaces to other systems. We were able to extract this information and put it in a database from which we drew a picture (a complex one, to be sure, but a very helpful picture).
This is an extremely shrunk version of the 12 foot by 4-foot wall chart of their applications and their relationship to each other. The systems from the spaghetti diagram were shown in this diagram and shaded so that people could see how they related to the many other systems that were uncovered.

Whether you have the fortune of starting with a portfolio or not, once you construct a first version, the developers and maintainers of the system can help you a lot at this point. What we’ve seen is the developers and maintainers become very fascinated seeing a picture like this for the first time. Spread this out on a large conference table and invite them in, 4 or 5 at a time. They will point at the lines, have discussions, disagree with the lines as drawn, “remember” other interfaces not shown. At this State agency, we added so many lines we had to color code them just to be able to follow the lines across the wide expanse of the drawing. They ended up calling the resulting diagram “the spider web on crack”:

It was actually somewhat readable at full scale. Either way, it makes graphically clear what the issue is: any change to any system potentially reverberates through the interfaces and into other systems.
Getting a full inventory of systems interfaces is much harder than it sounds, but the more you can do here, the better. Most of your spending and most of your lock-in is in these interfaces. Sooner or later, you will need to tackle these if you are to make progress.
The other thing that you will want to do is attempt to inventory “rogue IT” or your “shadow systems.” These are the Microsoft Access-based systems and the Excel spreadsheets that are complex enough to be systems on their own. These are harder to find. They can be found by scanning all the drives attached to your network, but you will get a huge number of false positives. You will find thousands of copies of “Northwinds,” the sample database that comes with Microsoft Access. You will find thousands of trivial spreadsheets that are neither helpful to nor dependent upon corporate data.
If your company is subject to the Sarbanes Oxley Act of 2002 (often referred to as “SOX”), see if there have been any studies about information provenance. SOX was meant to ensure that companies could trace all the figures on their financial statements through the many processes and programs they went through to get there. Such inventory is the raw material of the “getting better” plan. It is almost certainly the case that few of these systems are sharing databases, but it is also almost certain that they are sharing concepts.
Your goal, which you can measure progress toward, is to reduce the number of applications that are not sharing a core data model. Getting from 1000 applications to 500, even if you make no progress on a shared model, is progress. You will have freed up costs and resources.
As you migrate toward the Data-Centric architecture, you may increase the total number of applications. But having a large number of very small applications that are not interfaced with each other except through the shared model is a completely different economic situation. This is why we suggest counting the number of applications that are not sharing a core model.
Profile
The other thing you will want to do is inventory your data, which is even more of a challenge. If you are a billion-dollar company, you could easily have a million data elements under management. You might have a metadata repository (i.e., one place where you are managing the definition of all that data), but it won’t be of much use to you. It is too hard to try to understand what a million data elements represent. Metadata typically comprises small amounts of descriptive data, about what each data element means.
Unfortunately, in reality, metadata is often sparse and trivial. For instance, the metadata definition for a column called “order date” might just say, “This is the date of the order.” Of course, this isn’t particularly helpful, as it hasn’t given us any additional details. More useful metadata could specify whether this is the posting date, the effective date, or whether the date that triggers some commitment. Furthermore, this type of documentation (if it is present at all) won’t tell you whether the field is in use, or whether it is static or changeable. The names of data elements are often quite cryptic.
Perhaps counterintuitively, looking at the actual data can tell us a great deal more than the metadata. There is now software that can help considerably with this. GlobalIDs, Eccenca, and IoTahoe all provide software that interrogates the actual data and profiles what it finds. These profiles are incredibly useful. The first thing they do is eliminate all the elements you no longer need to consider. Any element that isn’t used or isn’t different is adding no new information.
A second thing these profiling tools do is generate a histogram for each column in each table. The histogram is a summary count of the frequency of data values by column. A column that has exactly one instance per value is likely a primary key, or some other uniquely identifying attribute, such as Social Security Number. If two columns in different tables or different databases share the same histogram, they are very often referring to the same thing. From there the products differ a bit but can include making a first cut assessment of the probable semantics of the data. This can drop the analyst’s mental load by a factor of ten.
Projects in flight
Find the projects that are in progress, and create an independent assessment of where they stand, how likely they are to complete, and what their net benefit will be if they do complete. We know of at least one firm who took the budget that was already committed to inflight projects and convinced management that they were taking the firm away from their strategic direction. They canceled the projects and reallocated their funds. This freed up funding to start a process to make progress. This is a difficult call to make but can be quite powerful.
Spotting an opportunity
Along the way, you will no doubt encounter some projects that will provide quick wins and could be used to bootstrap your Data-Centric initiative.
Additionally, you may come across projects in flight that are not candidates for being cancelled but that might benefit from a Data-Centric approach.
As discussed in the previous chapter, a great place to find opportunity is within trending technologies. Just look at a list of emerging technologies, figure out which one is either already funded or due to be funded, and reframe it with a Data-Centric spin. Virtually all emerging technology benefits from the Data-Centric approach. The trickier part is getting the sponsors of the project to agree.
A small core
In addition to finding a project (or projects) to initiate your move to a Data-Centric approach, you should establish a small core team. The function of this team will be to continue to make progress between projects, ensuring that gains achieved are not lost.
All of the successful case studies we have seen employed a small core team with a long-term commitment. Generally, there will not be a lot of turnover on these teams because the kind of people they attract are missionaries. They are typically convinced of the value of this approach and will persevere to get it accomplished. The risk is more that funding or budgets will dry up or that reorganization will disrupt them.
Your job is to find a way to isolate them from the quarter-by-quarter vagaries that so beset most firms. There are many ways to do this, but each is peculiar to the specific company. In some firms attaching this initiative to Enterprise Architecture is safe; in others, a strong data management or data governance discipline can be a good place; for others still, the Chief Data Officers staff is the place. In any event, it is a relatively small but important budget line item, typically being between 3 and 8 people.
Getting to self-funding
This is a long-term endeavor that only needs a modest investment to deliver superior results over a long period of time. Many firms are currently organizing their IT spend into three categories:
- Run the Business: What do we need to do to keep the lights on and keep the systems working? This is by far the largest portion of the budget, typically 60-70%. The intent is to fund the transform tasks from cost improvement via run-the-business tasks.
- Grow the Business: These are activities or projects that are expected to increase revenue or profit. One strategy will be to use some of this funding to implement and convert to the Data-Centric approach.
- Transform the Business: These are projects that fundamentally change the way IT and/or business is conducted. We submit that Data-Centric is perhaps the most fundamental of the revolutionary changes. Most strategy firms recommend about 10% of the IT spend be devoted to transformative projects.
Some transformative initiatives are changes in the business model or the way that value is delivered. Examples of major transformations include Netflix’s shift from DVDs to streaming, Box’s shift from consumers to enterprises, and Tesla’s shift from low volume, high-cost cars to high-production, mass market cars. Most firm’s legacy infrastructure will frustrate their ability to make such changes.
We contend that the move to Data-Centric is a meta-transformative initiative. By transforming the way IT supports the enterprise, you fundamentally change the enterprise’s ability to change itself. Along the way, the move to Data-Centric pays for itself by radically dropping the cost of change, the cost of integration, and the cost of adding new functionality. Data-centric methods reduce cost while they make initiatives to grow the business more effective.
Strategically, you want to make small investments in the transformation that continually funds growth projects and drops the cost of running IT. This chart outlines a representative example.

In this example, we start with a modest capital investment to kick start the Data-Centric transformation in years 1 and 2. The continued spend on transformation is maintaining the core team that will support and extend the Data-Centric architecture. In this example, we have left the grow-the-business funding constant. We would expect most grow-the-business initiatives to also be Data-Centric; as such, they should deliver much greater return on investment and much more business impact for the same level of investment.
We show the run-the-business share of IT spending gradually decreasing, as the cost of supporting older integration approaches drops and as functionality previously delivered in expensive legacy platforms is retired and replaced. In most cases, there will be a step function somewhere between years 4 and 8, where there is enough functionality in the architecture, and a track record of implementing in the new architecture, to provide the team the confidence to take on the larger projects. It is not until this point that the entrenched legacy systems can be addressed. We have watched firms attempt to tackle legacy modernization projects head on. Most fail without getting any new functionality implemented. Those few that succeed end up replacing one legacy system with a newer one. Most firms will be better off piling up a series of small wins, building capabilities, skills, and confidence in the new way. By the time they are ready to take on the legacy system, it should be obvious what needs to be done, and rather than launch a large death march project; the firm will launch a series of incremental initiatives.
Finally, in the example, we showed another blip in transformation spend in years 6 and 7. This is meant to represent a true business transformation, which will be possible once the infrastructure has become flexible. It is impossible to predict six years ahead of time the type of transformation the business wishes to do (if it were known now, the business would likely start it immediately despite the lack of infrastructure to support it). The expectation in the graph is that the flexibility in the architecture will encourage business leaders to adopt transformations that they previously would have avoided. By lowering the barriers to transformation, we believe this will encourage them.
Every case we have seen that has been successful has funded a small team for a long period of time. Typically, a team of 3-8 people is all it takes to make this kind of change. They need to be kept in place for a long time. In most enterprises, this means that they need to be delivering incremental value along the way, while they pave the ground for the larger, strategic transformations.
Chapter Summary
Preparing the ground is essential here. This is not the kind of initiative to be dabbled with. You need to know exactly where you are starting from and establish a strategy for making continual progress toward your vision.
A great deal of this initial effort will be in “knowing thyself” (that is, deeply introspecting the litany of systems and the economics of implementing and maintaining them). Not only will turning over all these rocks bring forward opportunities that may have been overlooked, they will fuel the inevitable economics discussions that will ensue.
You will no doubt come across projects that would benefit from – and, in turn, help kickstart – the Data-Centric movement within your firm. Organize this data and prepare for the implementation phase.
The other thing to do in the “assess and organize” phase is to figure out how you are going to maintain the consistent, small core team to carry your vision to fruition.