As an Excel analyst, you have no doubt created your fair share of Excel reports; complete with sorting, layout and formatting. But how often have you thought about creating your reports in Access? The truth is that most Excel analysts think of Access solely as a data store. Few analysts consider using Access' reporting layer (the Access Report object).
The Access Report is an incredibly powerful component of the Microsoft Access toolset. Acting as the presentation layer for your database, the Access Report allows you to easily integrate your database analysis with polished PDF-style reporting functionality, complete with grouping, sorting, and conditional formatting.
In this chapter, you explore Access Reports and discover how they can add a powerful new dimension to your reporting capabilities.
In this section, you create your first Access report and explore the different ways to view that report. After walking through this section, you'll have enough grounding to start building your own Access Reports.
The first step in creating a report in Access is to define the data source for the report. The data used in any Access reports can come from either a Table or a Query. One of the easiest ways to define a data source for a report is to build a query specifically designed to feed your report.
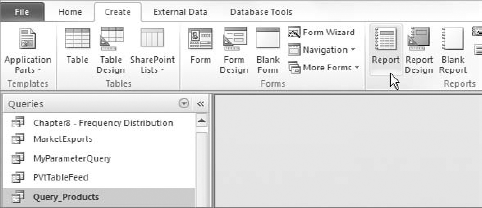
For your first report, you'll use the Query_Products query. Select the query and click Report command found in the Create tab (Figure 11-1).
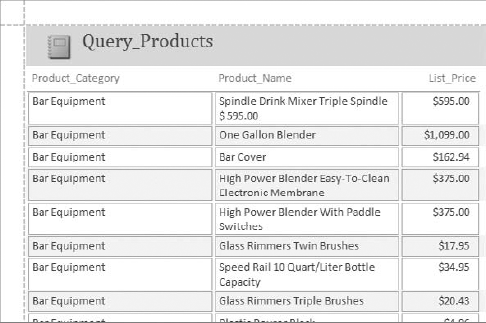
In a few seconds, Access produces a report that looks similar to the one illustrated here in Figure 11-2. As easy as that, you have created your first Access Report.
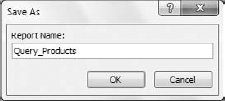
Close the report and you will a message asking if you want to save your changes. Clicking the No button leaves you with no report. Clicking the Yes button activates the dialog box you see in Figure 11-3. Here, you name your new report. As you can see, Access defaults the name of the report to the same name as its source. In this case, the name Query_Products is fine.
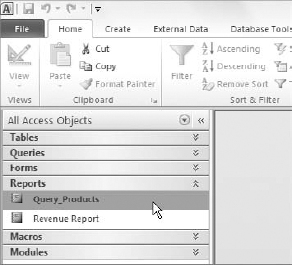
At this point, you will see your newly created report in the Navigation Pane (Figure 11-4). Simply double click on the report name to open it.
By default, your reports will open in Report view. The Report view simply lets you view and interact with your report as the report user would. You can't edit the data, labels or layout in Report view. However, Access does allow you to apply filters to your reports in real-time.
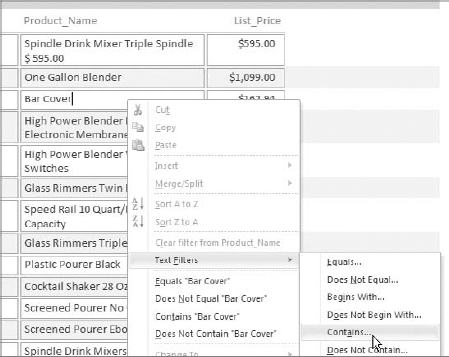
For instance, imagine you need to quickly find all the Refrigerator products in your newly created report. While in Report View, right-click any product name and select Text Filters
This activates the Custom Filter dialog box shown in Figure 11-6. Simply enter your search criteria. In this case, you would enter Refrigerator.
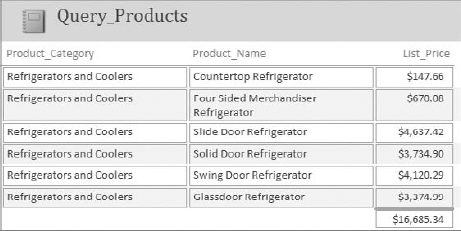
As you can see in Figure 11-7, Access responds by filtering out any product with the word Refrigerator in the product name.
The Layout view, introduced in Access 2007, allows you to edit the look and feel of your report while seeing how it will be displayed to the end user. To get to Layout view, open your Access report and select View
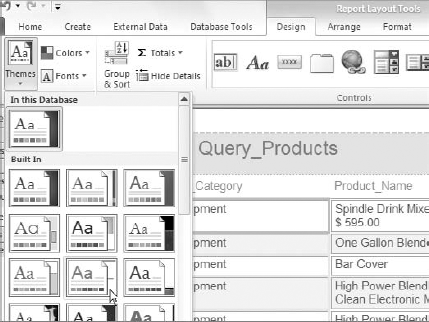
Once your report is in Layout view, you can do things like change the report title, change the data labels, resize columns, remove individual fields, or add new fields. For example, with your report open in Layout view, you can choose a theme for your report (See Figure 11-8). You will immediately notice that your changes take effect in real-time. You don't have to switch back to Report view to see the effect of your change; it shows up right there live on your screen.
The Design view allows you design your report in the traditional grid interface. For the Access novice, deciphering a report in Design view can be a little intimidating. However, once you understand the basics, creating reports will become much more intuitive and simple. To get to Design view, open your Access report and select View
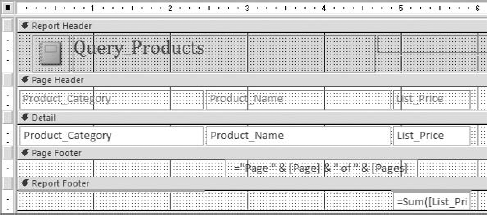
Opening the Query_Products report in Design view brings up the screen shown in Figure 11-9.
Notice that this report has five distinct sections: Report Header, Page Header, Detail, Page Footer, and Report Footer. These sections are typically what you see when you initially create your reports in Access. Take a moment to explore what each section is designed to do:
Report Header: This typically contains a label that serves as the main title for your report. Just like a header in Word, anything placed in the header section of the Access Design view shows up at the top of your report. As you can see, Access was nice enough to include an auto logo along with a report title; therefore that logo also shows up at the top of your report. It's important to note that items in the Report Header section need not be simple labels. They can be data driven as well, such as page number, current date, or virtually any other data element.
Page Header: This typically contains labels that serve as the heading for each page in your report. Again, items in the Page Header section need not be simple labels. They can be data fields, page count, a date indicator, or virtually any other data element. While it's not evident in this view, you can have different sub-header types. In each instance the header section gives you a place for data that will repeat only once at the top of each logical section, be it report, page, or grouping. You will explore sub-headers and grouping later in this chapter.
Tip
You can hover the cursor over the bottom boundary of any section and the cursor will change to a resizing arrow. Simply drag the bottom boundary up or down and you will resize that section of your report. Resizing the sections effectively changes the distance between the sections, allowing you to reduce the white space in your report, expand a section to make room for additional fields, or simply create bit more space to move around easier while working in a particular section.
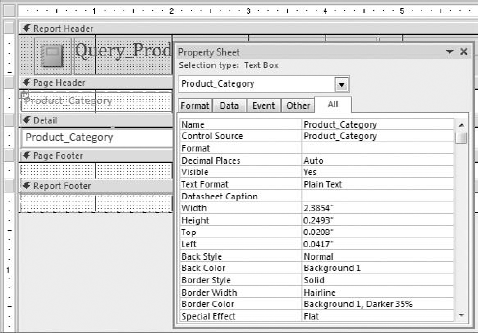
Detail: This section houses the actual data of your report. As you can see, each data field in your report is represented by a single text box. You can manipulate the content and formatting of any given field by right-clicking a field and selecting Properties. This activates the Property Sheet pane, shown in Figure 11-10. This pane allows you to easily edit and format the chosen field simply by adjusting the properties found here.
The Page Footer section is virtually identical to the Page Header section. The only difference is that labels and data in the footer section come at the end of each page view in the report. Common data elements in the footer include page number, date, and labels. As you can see in Figure 11-9, your report has a data driven page number field inserted in the footer section.
In this section, you begin to explore the true power of Access reports by illustrating grouping, sorting, and totaling techniques. You'll explore a set of specific example reports, using both the Design and Layout views to complete them.
Grouping your report is one of the easiest and most powerful ways to enhance your reports by adding layers of analyses. To explore grouping, open your Query_Products report in Layout View.
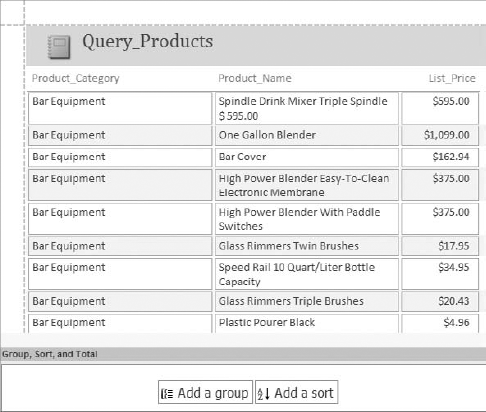
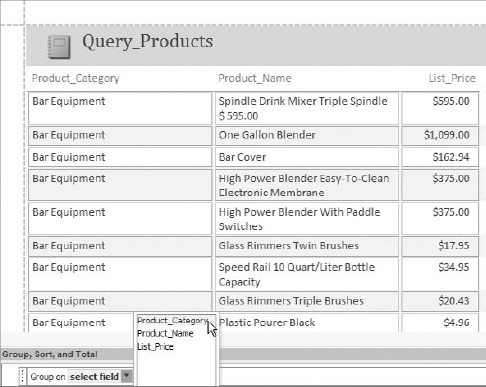
Once your report is opened, select the Group and Sort menu item found in the Design tab. This activates the Group, Sort, and Total pane, shown at the bottom of Figure 11-13.
Notice that there are two menu items in the Group, Sort, and Total pane—Add a group and Add a sort. Select the Add a group menu item. Doing so brings up a drop down menu asking on which field we wish to group by (see Figure 11-14).
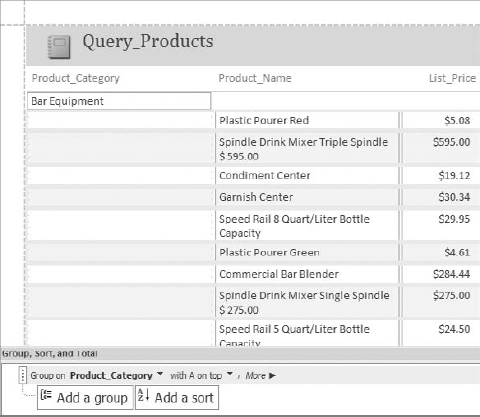
Figure 11-15 illustrates the applied grouping. Notice how Access moves your grouping field (Product_Category) to the far left of the report. In addition, product categories are now listed only once instead of repeatedly for each of the branch's service reps.
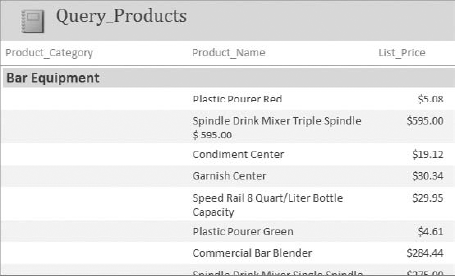
Figure 11-16 demonstrates how a bit of formatting work can make your groupings stand out. In this example, the font for the Product_Category field has been increased and made bold. Also, a little color has been added to the background to make it look more like a heading.
Fortunately, Access's Layout view makes sorting and totaling very easy and intuitive. Switch back to Layout view and take a closer look at the Group, Sort, and Total pane. As you can see in Figure 11-17, this pane now shows you the existing groupings.

Figure 11.17. The Group, Sort and Total pane shows you the groupings that have been applied to your reports.
The first line of the Group, Sort, and Total pane tells you that Access is grouping the report first by Product_Category, and sorting Product_Category in ascending order (with A on top). The second line is indented slightly. This is Access's way of sorting and grouping hierarchy within the report.
If you wish to manipulate anything related to the top group and sort, Product_Category, then you need to work with the menu items on the top line. For additional grouping or sorting underneath Product_Category, you would work with the menu items. In this example, you want to add a sorting by the ListPrice column. That is to say, you want to sort the product by its list price.
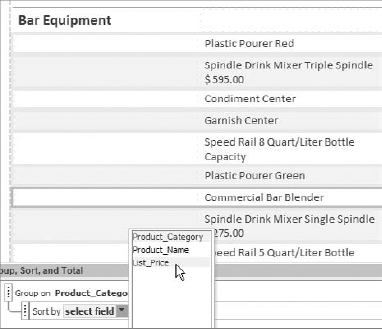
Start clicking the Add a sort menu item. As you can see in Figure 11-18, this activates a drop down menu asking you to select the field by which you want to sort. Choose the ListPrice field.
You'll notice that a new line appears in the Group, Sort, and Total pane. This line represents the sorting you just applied. Since the sales amount must be sorted in descending order, change the sort direction as demonstrated in Figure 11-19.
At this point, the products under each category should be sorted in descending order by list price.
This looks great, but this report could really use a total product count for each category. That is to say, you want to display a number which represents the count of products in that category.
In Layout view, go to the Group, Sort, and Total pane and select the More drill down button for the Product_Category grouping. Figure 11-20 demonstrates how.
As promised, you will see more options for your grouping. One of these is the totals option, which is set to "with no totals" by default. Click the dropdown selector for the totals option to reveal the Totals dialog box illustrated in Figure 11-21.
The Totals dialog box can be a bit tricky. The top menu item is a dropdown box where you choose a field to total. Notice that the default selection is the first field in your report. Again, you want to count the number of products. To do so, follow these steps:
Select the Product_Name field from the Total On dropdown menu.
Select Count of Records from the Type dropdown menu.
Click the Show in group footer box at the bottom of our menu. This tells Access to display the total in the footer section of your category groupings.
At this point, your Totals dialog box should look similar to the one shown in Figure 11-22.
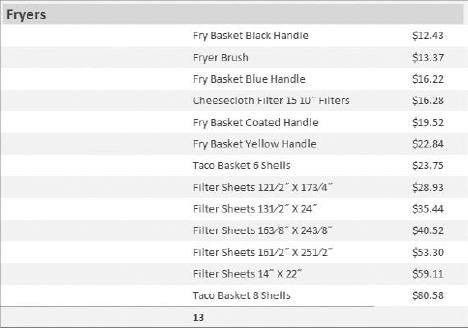
Take a moment to save your report; then switch to Report view. Figure 11-23 illustrates what the grouping, sorts, and totals look like for Fryers category. With just few clicks of the mouse, you've added layering to your report, making it much easier to comprehend.
In the previous exercise, you let Access generate your report automatically. Although this option is convenient, you may want to have a more involved hand in what your report looks and feels like. In this section, you'll discover how to create an Access report from scratch, starting from a blank slate.
For this endeavor, you'll walk through the creation of a specific type of report called an Alpha Roster. An Alpha Roster is a fancy name for an alphabetically grouped and sorted report, usually showing addresses, contact information, or something similar. This particular report will show customer information grouped by the first letter of the customer's name and sorted alphabetically.
The first thing you need is some source data. Instead of creating a separate external query for this, you'll build your data source directly into the Report object.
Go to the Create tab of the Access Ribbon and select Report Design.
Once in Design view, ensure the Property Sheet pane is activated by right clicking inside the white area of the report and selecting Properties (you can also select F4 on your keyboard).
Make sure the Selection Type dropdown menu in the Property Sheet pane is set to Report.
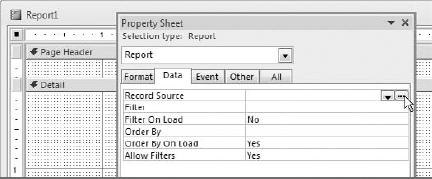
Now select the Data tab and click the ellipsis button (the button with the three dots) next to the Record Source property (Figure 11-25).
Selecting these three dots invokes the Query Builder, which you can use just as you would if you were building a standard query.
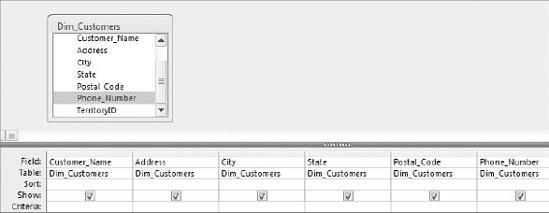
At this point, you can create the query you see here in Figure 11-26. As you want to make an alphabetical listing of customers, you will choose the most relevant pieces of data.
Now you must save your query to ensure it remains as the report record source. Click the close button from the Design menu and select the Yes button when presented with the message box shown in Figure 11-27.
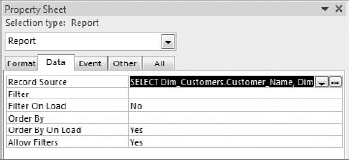
As a quick check, go to the Property Sheet pane and examine the RecordSource property of your report to make sure it contains your newly created query. If the query saved properly, you should see SQL syntax similar to that shown in Figure 11-28. If you don't see anything, repeat steps 4 through 6.
Once you have a data source defined, you can start designing your report. Because you are building your report from scratch, you'll have to add and arrange your report's content yourself. Follow these steps to build your report:
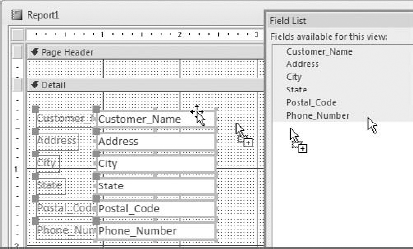
From the Design tab of the ribbon, select the Add Existing Fields button. This opens the Field List pane.
The idea is to drag the fields you want on your report. Drag the fields you need over to the detail section of your report as demonstrated in Figure 11-29.
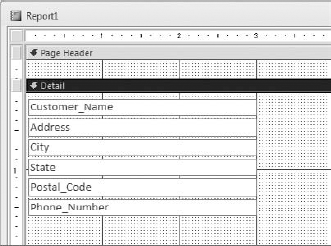
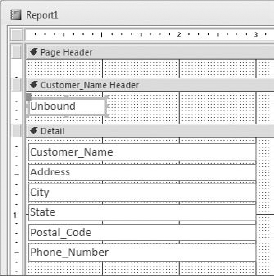
Now you have the basic data elements for your Customer roster. Before you go on, take some time to position your data fields and clean up your labels until it they look like Figure 11-30.
Tip
For quick and easy positioning of data and labels, highlight your fields and labels and then go to the Arrange tab on the ribbon and select Stacked. Access automatically aligns and distributes your labels and data into a neat block.
Remember that you want your report grouped and sorted alphabetically. So naturally, the next step is to add a grouping.
From the Design tab on the ribbon, click the Group and Sort icon.
You will see the same Group, Sort, and Total menu you saw earlier. From this menu, group the Customer_Name field by clicking the Add Group button and selecting Customer_Name.
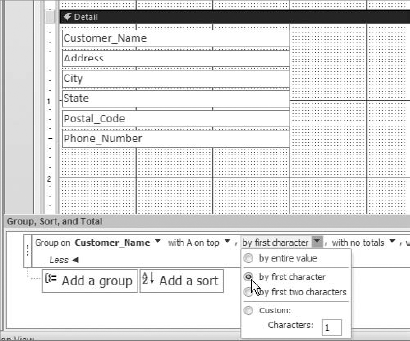
Expand the menu by clicking More and select the third dropdown menu (to the right of the text "with A on top").
As you can see in Figure 11-31, this menu gives different options for how to group by the Name field. Select to group by first character of the Customer_Name field.
Now you have a grouping that bundles all companies with the same first letter of their name. Things are starting to come together now, but you still aren't quite done. You need a field that explicitly shows users what grouping (what letter of the alphabet) they are viewing. For this, you must add a field to the group header section.
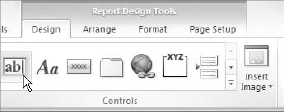
In the Design tab, click the Text Box control as demonstrated in Figure 11-32.
Place the new Text Box in the group header section of the Name field. Be sure to delete the label that came with the Text Box; then align the Text Box to the left (Figure 11-33).
Type the following in your new Text Box:
=LEFT([Customer_Name],1)
The
LEFTfunction parses out the leftmost characters of a text string. It requires two arguments: the string to be parsed and the number of characters to parse. The preceding code returns the single leftmost character in theCustomer_Nametext string.Take a moment to format your new text box so that the font is 24-pitch and bold. While you're at it, go ahead and make the
Customer_Namefield bold as well.
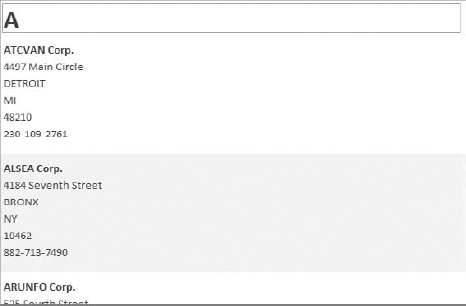
At this point, you can switch to Report view and admire your newly created report. Figure 11-34 illustrates what your report should look like.
Access Reports act as the presentation layer for your database and allows you to easily integrate your database analysis with polished PDF-style reporting.
Access Reports allow you to build data-driven reports right from the tables and queries in your database. You can either use the convenient Report Wizard to generate an Access Report or can create your Reports from scratch. Access Reports offer a full array of customization options, including: grouping, sorting, and formatting. The convenience and productivity improvements you can gain from Access reports are only limited by your creativity and initiative!

