26
Designing Performance for Long-Term Value
Aligning Business Strategy, Management Structure, and Incentive Design
Mark Van Clieaf
Partner, Organizational Capital Partners
- How should performance and success be measured in public companies?
- Why are total shareholder return and earnings per share not the optimal performance metrics for management incentives to align with long-term shareholder value?
- What key performance metrics should management be measured on to align the business strategy and value drivers of both the current and future value of the enterprise?
BlackRock, the largest asset manager in the world, wrote to the CEOs of the S&P 500 strongly reinforcing some of these performance measurement questions. Larry Fink, BlackRock's CEO, wrote:
It concerns us that, in the wake of the financial crisis, many companies have shied away from investing in the future growth of their companies. Too many companies have cut capital expenditure and even increased debt to boost dividends and increased share buybacks; we do recognize the balance that must be achieved to drive near-term performance while simultaneously making those investments—in innovation and product enhancements, capital and plant equipment, employee development, and internal controls and technology—that will sustain growth; explain to investors what metrics shareholders should use to assess their management team's success over time.1
A majority of public companies are missing essential strategic and operating performance metrics and incentive designs in their disclosures that align to the core operating drivers of growing long-term shareholder value. Creating value for customers and shareholders is best measured through operational excellence, five-year rolling revenue, profit growth, and levels of innovation that result in sustained returns on invested capital (ROIC) greater than the cost of capital.
Analysis of performance metrics for incentive design of the largest 1,200 U.S. public companies undertaken by IncentiveLab (ISS), identified that 70 percent of companies did not disclose capital efficiency and operating return metrics (i.e., ROIC, return on equity, economic profit) and 87 percent did not disclose direct line-of-sight performance metrics for innovation and capital reinvestment to drive future value.2 While many companies recognize the importance of innovation in driving their growth and realizing expected future value, few have explicitly designed innovation accountability into their disclosed executive performance metrics and incentive designs.
Examples of companies not using either category of performance measurement in their disclosed incentive designs include Alcoa, Anadarko Petroleum, Avon, Campbell Soup, Cisco, Corning, Dow, Dupont, HP, Hospira, IBM, Kellogg, Kraft Foods, McDonalds, Motorola, NCR, Newmont Mining, Office Max, J.C Penney, Sysco, Whirlpool, and Xerox to name a few. Many of these same companies have become targets for shareholder activism and or recently have disclosed actions to change their business strategy and or organization structure due to sustained underperformance.
Fixing these organizational design, performance measurement, and incentive design gaps with the current and future value of the enterprise will create tighter organizational alignment with creating long-term value. This is the performance improvement opportunity for many executive management teams and their boards of directors.
Defining Performance and Missing Metrics
How should performance and success be measured in public companies? There are a number of performance metrics that executive management and boards ideally need to measure to align business strategy with operating performance, shareholder value, and company valuation risk.
See the glossary at the end of this article for detailed definitions of key income statement (earnings before interest and tax, net operating profit after tax, earnings per share), balance sheet (invested capital, ROIC, economic profit), and company valuation related metrics (enterprise value, current value, future value, price-earnings ratio, weighted average cost of capital). While not a complete list of performance indicators and terms, these are foundational performance metrics that executive management and the board directors should be familiar with and need to consider in aligning performance measurement, accountability design, and incentive design with long-term value creation. These key performance indicators will be referenced throughout the balance of the chapter and the reader should ideally review the glossary to create a baseline of understanding about these key performance measures and how they are defined.
Only 20 percent of companies use capital efficiency metrics such as ROIC or economic profit (see Exhibit 26.1) in their disclosed strategic performance measurement, executive accountability, and incentive designs. This is partly because too many companies are overly focused on shorter-term earnings growth versus creating long-term value. It is the growth in revenues, net operating profit after tax (NOPAT), and a ROIC and ROE greater than the cost of capital (positive economic profit) that are key operational performance indicators of the enterprise and explain over 48 percent of shareholder returns over 10 years.3
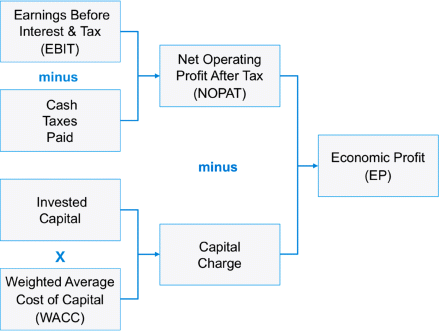
Exhibit 26.1 Economic Profit Value Driver Tree
Recent research from Credit Suisse Holt validates that companies that implement the use of return on invested capital performance metrics and alignment with their long-term incentive design improve shareholder returns.4 The use of return on invested capital metrics and incentives increased ROIC by 182 basis points over four years and also increased total shareholder return by 21 percent above the median return of the U.S. capital markets.
The effectiveness of management's business strategy and level of competitive advantage it has created and future value growth can best be measured through analyzing growth in revenues, earnings before interest, taxes, depreciation and amortization (EBITDA), net operating profit after tax (NOPAT), the level of ROIC or economic profit compared to their sector peers and compared to their cost of capital. True economic value and value for shareholders is only created if the ROIC is greater than the cost of capital. The weighted average cost of capital (WACC) is generally in the 7 to 8 percent range depending on the industry and company, and incorporates a required minimum return for both equity and debt capital. Only companies generating operating performance as measured by ROIC greater than their cost of capital (8 percent as a proxy benchmark) are creating long-term shareholder value. Some companies have narrow to wide moats that protect their performance, creates competitive advantage, and can lead to sustained, higher ROIC above 15 percent. These include intangible assets such as patents, branding, human capital, cost or scale advantages, or high customer-switching costs as drivers of these moats that support sustained, higher operating profit margins and returns on invested capital.5 Over the past 10 years only 27 percent of companies in the S&P 1500 had a 10-year average ROIC greater than 15 percent that resulted in top quartile sustained performance and competitive advantage.
Over 43 percent of the S&P 1500 over 10 years (2003 to 2012) had a five-year ROIC less than their cost of capital.6 This indicates that their accounting profits, when translated into economic profits by charging the traditional GAAP accounting income statement for a capital charge (invested capital times the cost of capital), generated negative economic profit and thus did not create true economic value over the long term. Enterprises that have not achieved excess and or growing returns above their cost of capital over five years or longer usually have a fundamental challenge with their business strategy, their business model, and its economics.
Management teams and boards that apply comparative peer performance analysis of their revenue growth, ROIC, and/or economic profit performance can generate performance and risk insights related to longer-term strategy effectiveness, the corporate life cycle,7 and the effective allocation of capital.8 Including revenue growth and NOPAT growth, return metrics (i.e., ROIC, ROE, economic profit) and innovation milestones in performance measurement can enable executive management and the board to create direct line of sight performance measurement with capital efficient growth and its contribution to long-term shareholder value. Strategic risk can be effectively measured using revenue growth, EBIT margins, and ROIC relative to the cost of capital and relative to peer group performance on these same metrics. For mature companies, business strategy and business model risk becomes evident in a sustained decline in revenues, operating profit margins, and declining returns on invested capital over a three- to five-year cycle. This strategic risk has been illustrated at such companies as Kodak, Avon, New York Times, Blackberry, Pitney Bowes, Lexmark, Unisys, Peabody Energy, Sears, Radio Shack, and Blockbuster Video to name a few.
What About Earnings per Share (EPS) as a Performance Metric?
EPS is the most frequently used operating performance metric for executive incentive design but does not take into account the level of invested capital, return on capital, or cost of capital and is subject to distortion due to share buybacks. Recent research from Credit Suisse and Organizational Capital Partners respectively identified that net income growth and EPS growth explains only 38 percent of relative total shareholder return (TSR) performance. The quality of EPS, as measured by ROIC, is just as important as the quantity of EPS and is why the EPS correlation with total shareholder return is only in the 38 percent range. A primary focus on EPS growth may force companies to pull back on investments in research and development (R&D), innovation, capital expenditures (CAPEX), and key organizational and human capital. Thus companies can generate short-term EPS growth without generating profitable growth that contributes to enhancing longer-term enterprise value. EPS, if used at all as a performance metric, should be viewed as only one part of the operating performance measurement mix given it does not measure capital efficiency or the quality of earnings from current operations.
Problems with EPS as a performance metric for executive management:
- Only correlates 38 percent with TSR.
- Does not measure capital efficiency or the quality of earnings which drive long-term company value.
- EPS growth destroys shareholder value if ROIC is less than cost of capital.
- May result in reduced investment in R&D, CAPEX, and innovation required to create future value to meet short-term EPS targets.
- Subject to earnings management due to share buybacks and may increase even though earnings did not.
- Subject to distortion due to level of discretion of what is exceptional if adjusted EPS is used.
- Should not be used in isolation as a performance or incentive metric.
Over 87 percent of public companies do not disclose line-of-sight performance metrics related to innovation, growth, and future value (FV).9 It is the expected investment in R&D, innovation, and capital expenditures to create new products, new markets and new business models (see Exhibit 26.2) and the growth in future cash flows they will generate that can explain over 50 percent of company market value not explained by current operating performance. Companies such as 3M, John Deere, Abbott Labs, Tesla, Novo Nordisk all recognize the importance of innovation in creating long-term customer and shareholder value and they include multiyear innovation and R&D-related metrics and milestones in their organization design, including their incentive designs, and disclosures for shareholders.
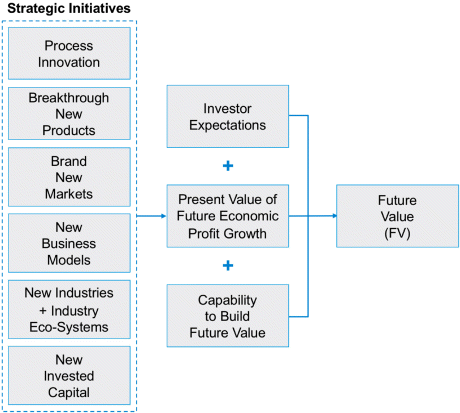
Exhibit 26.2 Innovation and Future Value Driver Tree
Connecting Current and Future Value to Total Shareholder Return
TSR or relative TSR, while seen by some as the silver bullet performance metric for management, has a number of limitations as a measure in isolating and evaluating the value add of executive management. This measurement problem includes the starting and end points for TSR calculation, which by changing just by one year can materially impact a multiyear TSR performance outcome and not reflect the true operating performance of the business. The use of TSR to measure management performance is further complicated by factors all outside the control of executive management that impact TSR performance—such as central bank policy on interest rates, GDP growth rates, global macroeconomics, commodity prices, or geo-political risks.
TSR as a metric lacks direct line-of-sight accountability to operating performance measurement. Yet we can decompose the drivers of total shareholder return and enterprise value (EV) and connect them to the operational value drivers so executive management can have direct line-of-sight accountability and be measured on it. The quality of strategic leadership can thus be measured against three performance categories: operational performance and their contribution to the current value (CV) of the enterprise including profit growth, returns on capital, and discounted cash flows from current operations; expected innovation and growth and their contribution to future value (FV) and future economic profit growth; financing drivers and capital allocation, including reinvestment for future growth and/or returning cash to shareholders through dividends and share buybacks (see Exhibit 26.3).
The first performance category that management controls that drives TSR performance, relates directly to the CV of the enterprise and can be optimally measured by revenue growth, margins, and excess returns on capital (ROIC or ROE) greater than the cost of capital from current products and current markets. CV is calculated as current-period NOPAT divided by the cost of capital and is the present value of NOPAT from current products, services, and markets in perpetuity. This indicates the quality of revenue and profit growth and the effectiveness of the business strategy and its execution. These dimensions are the underlying drivers of company cash flows resulting from operational excellence, and provide an indication of the level of competitive advantage as measured by the level of excess returns on capital greater than the cost of capital. Revenue and earnings growth only creates value if the ROIC is greater than the cost of capital. As previously outlined, companies generating sustained ROIC in excess of 15 percent are seen as having developed a strong competitive advantage. Together the mix of growth, profit, and operating return metrics and their performance can explain close to 50 percent of shareholder returns. The other 30 to 50 percent of shareholder returns, depending on the company, can be explained by the expectation for growth, innovation, and FV based on the disclosed strategy by management.
The second performance category that management directly controls relates to the FV of the enterprise and the expected growth and innovation beyond current operations from the disclosed 3 to 10-year strategic plans for investment. This includes growth from innovation by investing in the development of new products, new markets, new business models, and even creating new industries (e.g., Internet, genomics, clean energy, electric and hydrogen fuel cell vehicles, private space travel).The future value and growth expectation (future revenues, future returns on capital, and resulting cash flows) is implied in current stock price, enterprise valuation, and by using discounted cash flow modeling, and represents the consensus of how investors have interpreted management's disclosed growth strategy and investment plans. A simple implied FV is calculated as enterprise value minus CV.
The future value based on discounted cash flows is similar to a price–earnings (P/E) ratio, in that they both provide insight into the level of expected growth beyond current earnings and cash flows from current operations. The P/E ratio is not a perfect measure due to the factors impacting the market value of a company (price), including overall sentiment of investors, and the fact that earnings are managed by accounting rules, can be volatile and subject to distortion due to onetime events. It is generally accepted that a high P/E ratio company is a company with an expected high level of future growth and a low P/E ratio company is expected to have low future growth. The P/E ratio, as a measure, needs to be further qualified by the narrative and disclosures from executive management about the stated strategy and expected growth, returns, and to what extent they align.
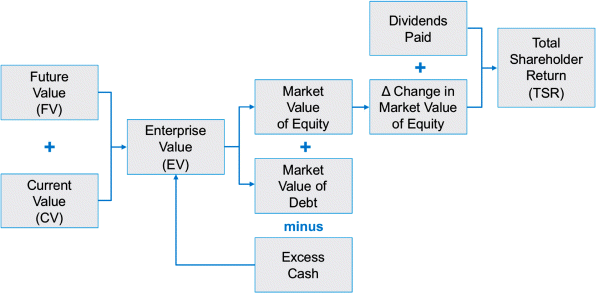
Exhibit 26.3 Total Shareholder Return Value Driver Tree
The P/E ratio relative to a relevant peer group—a median P/E ratio measured over one year and compared to its peers—can be used as a simple capital markets proxy indicator of the implied expected relative growth, innovation, and future value of a company based on the disclosed business strategy by executive management. The strategic risk for a higher P/E ratio or higher future value company is whether executive management has a long-term strategic plan, is actually making the required level of investments needed for growth and innovation, and creating a line of sight to deliver on the expected future growth in revenues, earnings, and excess returns on capital that are implied by the earnings multiple and market value of the company. A lower P/E and lower future value company suggests a consensus by investors that do not perceive the same level of future growth, relative to peers, based on management's disclosed strategy and plans.
At the start of 2014, Aswath Damodaran, a professor of finance at New York University's Stern School of Business, estimated the cost of equity capital in the United States to be 8 percent. This translates into a steady state, no growth price-earnings multiple of 12.5 times earnings and is calculated as 1 divided by the cost of equity (8 percent). In simple terms, this means the capital markets expect a company and its disclosed strategy to create future value beyond current operations if its stock trades above 12.5 times current earnings. Michael Mauboussin, head of global financial strategies at Credit Suisse, further elaborates that if a stock trades below a 12.5 times P/E multiple, the capital markets are interpreting management's strategy as either no growth and no future value or that future value creation will be insufficient to offset a decline and fade in the current base business (current value) over time.10 In other words, current earnings and returns on invested capital are not sustainable in the long term, nor is the expected level of innovation and growth in revenues and returns on capital large enough to make up the future performance gap.
A company with a 25-times P/E ratio is equivalent to a company with a FV of 50 percent of enterprise value (EV), assuming an 8 percent cost of capital, and is a significant growth and innovation expectation.
The third performance category that executive management directly controls relates to financing and capital allocation strategies and their impact on relative TSR performance. This includes capital allocation decisions such as reinvestment (R&D, innovation, CAPEX, branding, human and organizational capital, working capital), acquisition or divestitures to transform the business or product portfolio, and the use of dividends or share buybacks to return capital to shareholders. Thus, a key performance measurement question is how much of relative TSR performance and growth in enterprise value was driven by operational excellence versus innovation and future value alignment versus financing strategies.
Revenue growth, ROIC, and relative P/E ratios clearly differentiate high- versus low-performance companies and where these organizations are in their corporate life cycle. What is the performance profile of high-growth, life-stage enterprises such as Netflix, Google, Monster Beverage, MasterCard, Starbucks, and Novo Nordisk? Their annual revenue growth rates are in the 12 to 26 percent range or higher, returns on invested capital (operational advantage) are in the 15 to 40 percent range, and they have higher P/E ratios (expected growth and innovation advantage) in the 25 times to 50 times earnings range or greater. Enterprises that are strategically challenged—in the decline or restructure corporate life-stage, have a profile that usually exhibits flat to declining revenues, returns on capital less than their cost of capital (8 percent as a proxy for the cost of capital), and also have low P/E ratios in the 6 to 14 times earnings range, representing a capital markets expectation of limited to no expected growth from the disclosed business strategy. Example companies include Sears, Avon, Kodak, NCR, Boston Scientific, Conagra, and Tesco to mention a few. Strategic leadership is required and should be held accountable to fundamentally transform the business strategy, the business model, and its economics so it creates positive returns on capital and/or sell the business.
Based on the key operating value drivers of TSR that management can directly impact, many companies have an opportunity to return to first principles in defining how enterprise performance measurement should be designed and implemented. This starts with using key operating performance indicators that drive growth in both current and future value, return on invested capital, and economic profit. This also includes a hierarchy of performance measurement (strategic and operational) and how this is cascaded into an accountable managerial structure and its organizational layering, creating alignment with the long-term value drivers of the enterprise.
Aligning Management Structure with Innovation and Future Value
Designing clear accountability for current and future value into the managerial structure is critical to organizational effectiveness. The CEO of a single profit and loss (P&L) business should be accountable for the overall business strategy and business model innovation required to sustain growth and returns on capital over the next 5 to 10 years. In an optimal management structure, this level of role and innovation complexity has been identified through over 30 years of organizational effectiveness research and is named Work Level 5 (see Exhibit 26.4). The CEO of a portfolio of multiple business units (profit and loss centers) should be accountable for innovation that impacts the business portfolio and its composition, industry structure and ecosystems, competitive positioning, and focus on global growth and returns on capital 7 to 20 years into the future. This level of CEO role complexity and level of innovation has been named Work Level 6. The key value add of these different CEO roles should be their accountability and decision authority for creating current and future value concurrently.
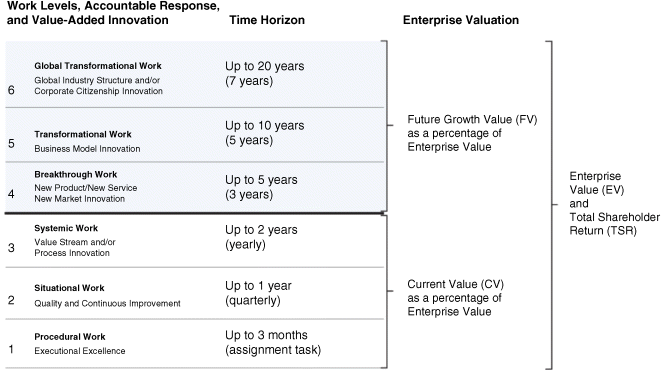
Exhibit 26.4 Management Structure, Levels of Innovation, and Valuation
Source: Copyright © 2015 Organizational Capital Partners.
Future value needs to be aligned to the 3- to 10-year strategic plans for R&D, innovation, CAPEX, M&A, and their contribution to driving revenue growth and incremental returns from new products, new markets, and new business models and even creating new industries. In the case of Toyota, they have recently disclosed their 30-year strategy and metrics related to transforming the global transportation industry from fossil fuel combustion engines and power trains to 90 percent electric, hydrogen fuel cell, and hybrid vehicles by 2050.11 Their disclosed long-term strategy, including R&D and CAPEX investment plans, are aimed at developing new technologies, new hydrogen-vehicle infrastructure, and environmental innovation. Innovation that will provide a quantum leap in fuel efficiency beyond traditional fossil fuel powered vehicles and at the same time a 90 percent reduction in carbon dioxide emissions, positively impacting the management of climate change around the world.
In our organizational effectiveness audits it is not unusual to find executive management spending too much time on operational issues and not enough time or with clear accountability and incentives for long-term strategy and future innovation.
If the top three layers of management in the company are measured and incented mostly on one- to three-year operating performance (i.e., revenue, earnings growth, and EPS from current products and markets) and does not include clear metrics for innovation, growth, and reinvestment of capital, then executive management can easily become too short term, operationally focused, and fail to invest enough to sustain long-term performance. This was the concern expressed by BlackRock, as a long-term institutional investor, in their recent letters to the CEOs in the S&P 500.
A dominant short-term focus by executive management many times creates an organizational jam-up: micromanagement and decision-authority compression by top executives with managers in the bottom one to two, value-adding layers of management (see Exhibit 26.5, work levels 2 and 3). The delegated accountability for operational performance to operational managers should be focused on developing and executing one- to two-year plans for business-process innovation (work level 3) and quarterly and yearly continuous improvement (work level 2). This is the operational performance that drives year-over-year growth in customer loyalty, revenues, margins, operating profit, and achieving invested capital and cash flow targets from current operations.
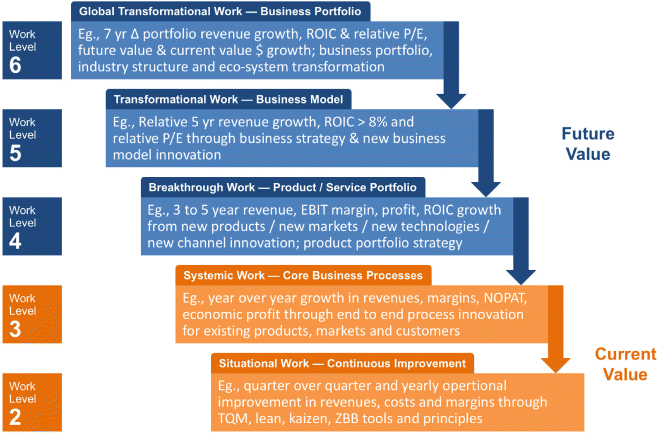
Exhibit 26.5 Hierarchy of Work Level Performance and Value Creation
Source: Copyright © 2015 Organizational Capital Partners.
Long-term performance to drive future value should align executive management with developing growth strategies and the levels of innovation at work level 4 (new products, new markets, new channels), work level 5 (new business models as required), and possibly even work level 6 (new industries, industry eco-systems, and global supply chains) as drivers of long-term enterprise value. It is this focus on long-term strategic growth and investment that justifies the significant pay differential between the CEO and the front line and middle managers. Differential work, decision making, and performance (strategic versus operational) justifies differential pay.
Executive management should ultimately be accountable for both current one-year operational performance (revenue growth and ROIC) and creating and executing long-term strategies, investment plans that drive innovation, and capital efficient growth (new products, new markets, and new business models). Thus executive management should be directly measured on the drivers of both current value and future value concurrently. Creating a hierarchy of performance measurement from strategic and future value to operational and current value as they cascade down the management structure and align the level of strategic decision making with the underlying operating drivers of TSR (see Exhibit 26.5).
Clear performance metric differentiation and cascade alignment in the organization design from the CEO role down the managerial structure, similar to the work levels model illustrated in Exhibit 26.5, appears to be missing in many companies and is an opportunity for improvement in organizational effectiveness and performance measurement that enables long-term performance. The research-based work levels model that aligns accountability design with the levels of innovation also creates a clear framework for integrating executive succession planning and the level of problem solving required by leaders at each value-adding work level.
Current Value, Future Value, and Rethinking Long-Term Incentive Design
A recent analysis by Steve O'Byrne of Shareholder Value Advisors identified the relationship between CEO pay and performance in the S&P 1500. A key finding was that, over the past five years, performance as measured by relative TSR, 5-year ROIC, and growth in economic profit explained only 12.4 percent of CEO pay variance.12 Over 65 percent of executive pay was explained by company revenue size, industry, and executive pay policy and how equity compensation was granted. There is a weak relationship between pay and economic performance. Until recently, much of executive compensation and long-term incentive design has mostly been focused on the delivery of competitive pay and not with a true alignment of executive pay for long-term performance.
There are three fundamental disconnects at a number of public companies between performance measurement, value creation, and long-term incentive design. This is the opportunity for redesign by management and board to create tighter alignment between the organizational design and long-term value creation. First is the assessment of return on capital relative to the cost of capital as a core performance indicator of the value creation of the business strategy and its execution. A value-creating business strategy can only be effectively evaluated if capital efficiency metrics, such as return on invested capital or economic profit, is used as part of the performance measurement and long-term incentive design mix and compared to the cost of capital. Less than 15 percent of companies disclose that they evaluate operating returns on capital relative to the cost of capital as an absolute performance benchmark. Including capital efficiency metrics in their key performance indicators, and related incentive designs, is a significant performance improvement opportunity for a number of companies.
The second incentive design disconnect is with future value and growth. Future value as driven by innovation and their expected future growth in revenues, incremental returns on invested capital, and cash flows is the other core component of the long-term performance beyond current operating performance that contributes to TSR performance and growing enterprise value. The use of TSR or EPS as incentive metrics does not create direct line-of-sight accountability for innovation and growth, even though there is an implied expected growth and future value that may account for 25 to 70 percent of enterprise value. Less than 13 percent of companies disclose specific innovation and future-value type metrics. Companies like 3M, John Deere, Abbott Labs, Tesla, Novo Nordisk have disclosed performance measures directly related to R&D, new product development pipeline milestones, investment in human capital, percentage of revenues and profits from new products introduced in the last five years as part of their long-term incentive design. These types of innovation-related metrics create a clear line of sight to the drivers of future value and future returns on capital as the other key contributor to what drives TSR performance that management directly controls. Most of these companies also use return-based metrics, such as ROIC or economic profit, as part of their incentive performance metrics, and thus have aligned the drivers of current and future value as an integrated incentive system for executive management.
The strategic planning horizon and long-term incentive design performance period is the third disconnect, and in a majority of companies is three years or less. Yet what drives real innovation that creates long-term value (developing new products, new markets, new technologies, and new business models and the related R&D and new invested capital) usually takes three to seven years or longer for positive returns on capital to be realized. This longer time frame is usually reflected in the internal capital budgeting processes of investee companies and their use of discounted cash flow models. The capital markets are actually focused on future value, future cash flows, and the long term. This shows up in enterprise valuation, when a future value percentage of enterprise value is in the 25 to 50 percent range or higher, and with P/E multiples in the 17 times to 25 times earnings range or higher. Measuring companies on a growth and innovation cycle that takes place over three to seven years, and designing long-term incentive plans focused on a minimum four-year performance period (three performance cycles), helps to ensure executive management is held accountable for balancing the trade-offs in achieving both one year and mid-term operating performance concurrently.
Using relative TSR as the sole or primary performance metric to trigger the delivery of executive compensation (performance shares) has a number of downsides for executive management and shareholders. The downside occurs when there is a material drop in the capital markets (e.g., the global financial crisis of 2007 to 2008) and stock price, yet the underlying business fundamentals and their contribution to the long-term value of the company are sound. Management comments that they delivered solid operating performance but this was not reflected in their take-home compensation that was realized. The flip side in the use of TSR in incentive design is the delivery of executive compensation windfalls far beyond what management, board, or shareholders ever considered as fair and defensible pay for performance. These compensation windfalls are partly due to upside volatility in share price not driven by operating performance and a capital markets disconnect from the underlying true value of the company in a three-year performance cycle.
From an overall long-term incentive design point of view, given that TSR performance has a number of factors that drive TSR outcomes beyond management control, one incentive design option is to use relative TSR as a rewards modifier metric paired with other fundamental operating performance indicators over a four- or five-year performance cycle. These operating indicators could include revenue growth, ROIC, and multiyear innovation milestones where management has more direct line-of-sight control and decision authority that impacts operating performance. This also creates a tighter alignment between business strategy, multiyear performance measurement, and long-term incentive design.
Explaining Performance and Pay for Performance
To explain the real story behind relative TSR performance, companies could consider disclosing to shareholders the relative percentile rank of performance on the following key dimensions relative to their selected peer group: revenue growth, return on invested capital, P/E ratio, TSR (see Exhibit 26.6). This provides the foundation from which to analyze and explain underlying relative operating performance and growth expectations, which together drive enterprise value relative to TSR performance.
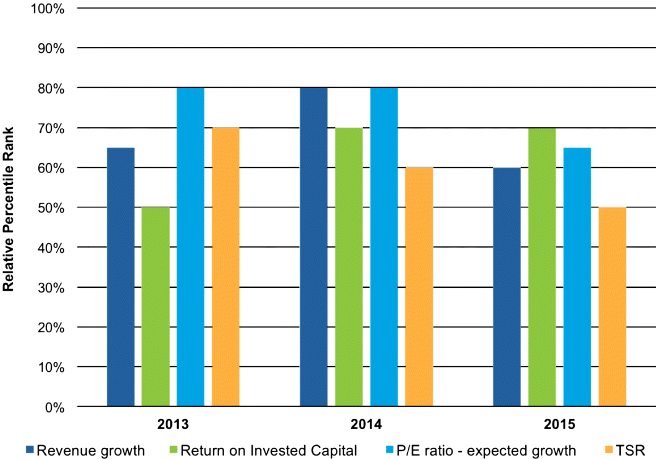
Exhibit 26.6 Relative Peer Performance Comparison
Source: Copyright © 2015 Organizational Capital Partners.
As an example, a company with an overall combined relative-performance rank on revenue growth, ROIC and P/E at the 70th percentile compared to its relevant peer group should ideally pay at the 70th percentile of total compensation to create tight pay-for-performance alignment. The targeted awards for operating performance could then be modified based on the relative TSR performance. Some companies are using a positive awards modifier of 25 percent applied to targeted awards if relative TSR is at the 75th percentile or higher. At the same time if relative TSR is at the 25th percentile or lower then companies are using a negative 25 percent modifier applied to targeted awards based on operating performance targets achieved. The benefit of this approach is the ability to more closely align strategic and operational performance, future and current value, and TSR performance for shareholders with equitable long-term incentive design for management.
Conclusion
There are a number of key takeaways for executive management and the board of directors for improving enterprise governance that create a significantly improved organizational alignment of business strategy, performance measurement, current and future value, managerial structure, incentive design, and long-term performance:
Recognize that economic value and operating performance that supports long-term shareholder value is only created when ROIC and ROE is greater than the cost of capital, and thus creates positive economic profit and growth in economic profit and free cash flow over time.
Ensure that performance measurement includes capital efficiency metrics such as ROIC, ROE, or economic profit and recognize that both revenue growth and capital efficiency are required to create long-term enterprise value.
Include performance metrics for innovation and future value aligned to growth and incremental returns from new products, new markets, new channels, and new business models; recognize that other metrics such as safety, environmental, human capital that materially impact current and future value may also be required.
Recognize a relative price/earnings ratio can be seen as a proxy for management's disclosed strategic plans for growth and innovation as interpreted by investors; a P/E ratio of 12.5 times earnings or less is a proxy for a company which is seen by investors to have a strategy and business model with limited to no future value beyond current operations; a 25-times price earnings ratio is equivalent to a company with a FV of 50 percent of EV, assuming an 8 percent cost of capital, a significant growth expectation.
Recognize that all P/E multiples are not created equal and that a review of revenue growth, ROIC, and relative P/Es across relevant peer companies is required to assess the effectiveness of the business strategy, its implementation, and overall performance.
Align the management structure, organizational layering, and metrics to the levels of innovation (work levels) that drive future value (new products, new markets, new business models, and even creating new industries) and current value (operational excellence through process innovation and continuous improvement).
Ensure that a hierarchy of performance measurement from strategic to operational is effectively designed, cascaded, and aligned down the managerial structure and layers from the CEO role to front-line managers; differentiate performance metrics for each value-adding layer of management (work level).
Redesign the longest performance periods for executive management to at least a four- or five-year rolling performance cycle to align closer to the innovation cycle and capital budgeting processes.
Explain relative total executive pay compared to relative performance by calculating performance percentiles for a relevant peer group using revenue growth, ROIC, and P/E ratio metrics as an enhanced way of aligning rewards with the underlying operating drivers of TSR performance.
Glossary
- Revenue growth from existing products, services and markets.
- Revenue growth from innovation from new products, new markets, and new business models.
- Earnings before interest and tax (EBIT), which is also known as operating profit, and is calculated as revenues minus cost of goods sold minus SG&A expenses minus R&D expenses minus depreciation and amortization.
- Net income is calculated as EBIT on the income statement minus interest expense minus tax expense.
- Net operating profit after tax (NOPAT) is calculated as EBIT on the income statement minus cash taxes paid.
- Invested capital is calculated as total assets on the balance sheet minus excess cash (beyond 2 percent of revenues not required to operate the business) minus noninterest-bearing current liabilities such as accounts payable and taxes payable.
- Earnings per share (EPS) is calculated as the net income available to common shareholders divided by the weighted average number of shares outstanding.
- Return on invested capital (ROIC) is calculated as NOPAT divided by invested capital and provides insight into the level of competitive advantage and effectiveness of the business strategy in creating value for both shareholders and debt holders.
- Return on equity (ROE) is calculated as net income from the income statement divided by the book value of shareholders' equity on the balance sheet; ROE is seen as a less optimal operating metric as it can be increased by just changing the capital structure of debt to equity and the number of shares outstanding.
- Weighted average cost of capital (WACC) is the weighted average of the cost of equity and cost of debt for the company; the median WACC for most companies, depending on the industry sector, is in the 7 to 8 percent range; this is the discount rate used to calculate internal rates of return on capital investments and incorporates expected minimum rates of return for both debt holders and shareholders.
- Capital charge is calculated as the level of beginning invested capital multiplied by the weighted average cost of capital.
- Economic profit is calculated as NOPAT minus a capital charge and is a non-GAAP measure of true economic profitability after a minimum return for both invested equity and debt capital.
- Discounted cash flow valuation (DCF) is a method of valuing an asset using the time value of money. DCF value is the present value of expected future cash flows discounted to present using the cost of capital.
- Total shareholder return (TSR) is the point-to-point measurement of the percentage gain or loss to shareholders, i.e., share price end of period minus share price beginning of period plus dividends divided by share price beginning of period.
- Relative total shareholders return is the TSR of a company relative to some type of comparative peer group or index such as the S&P 500 or FTSE 100.
- Market value of equity is the number of shares outstanding times stock price.
- Enterprise value (EV) is the market value of equity plus the market value of debt minus excess cash. We assume that the market value of debt is equal to its book value on the balance sheet. Enterprise value is also made up of two components, which are the current value (CV) and the future value (FV) of the enterprise. Enterprise value can also be calculated as the present value of current economic profit plus current invested capital plus present value of economic profit improvement.
- Current value (CV) of the enterprise is calculated as NOPAT divided by the cost of capital (WACC); this represents a discounted cash flow and the present value of after tax operating profit in perpetuity from current operations and is also known as the residual or intrinsic value of the company; this can also be calculated as economic profit divided by WACC plus invested capital.
- Future value (FV) of the enterprise is calculated as enterprise value minus current value and represents the present value of expected growth, innovation, and economic profit improvement beyond current operations that is implied in stock price and current company valuation.
- Price/Earnings or P/E ratio is calculated as the market value of equity (price) divided by net income (earnings) and can be seen as a proxy for the level of expected growth and innovation beyond current earnings implied in the current stock price and company valuation; the higher the P/E multiple, the higher are investors' expectation of future growth and innovation from the company relative to current earnings. Conversely, a stock with a low P/E multiple suggests that investors have more modest to low expectations for a company's future growth compared to a relevant peer group and the capital markets as a whole.
- Work level is the level of complexity and value add of a role in a managerial layer and the level of innovation over which a role has accountability and decision authority to make investments and drive performance; companies can have two or more organizational layers in the same work level creating a jam-up and micromanagement; organizational gaps are identified when there are missing work levels and missing levels of innovation in the organizational layering that impedes strategy development and execution; each more complex work level has a higher level of innovation, value add, and a longer time horizon for performance measurement and impact.
