
Chapter 6
Marketing Metrics
Metrics are quantitative measures that an organization can use to measure, compare, and track performance. In marketing, they are used to measure a series of activities such as sales growth, revenues, and advertising efficiency. They are often compared to industry benchmarks to ensure that a company is performing adequately, and that it is reaching its strategic targets. Measuring the impact of different marketing activities is essential to ensure optimal resource allocation in an organization, as it enables decision-makers to understand the relationship between strategic variables and executional variables.
In this section, we will go over some of the basic ratios life sciences companies can use once they reach commercialization. The ratios we will be looking at range from the more classical (such as return on sales) to the more complex ones (such as advertising-to-sales and customer acquisition cost [CAC]), as well as few specifically for pre-revenue organizations. We will close the chapter with a few ratios specific to digital marketing campaigns which measure traffic, conversion, and revenue.
6.1 Why Use Metrics?
The purpose of establishing marketing metrics is to operationalize the firm’s strategies and to track the impact of those strategies on target customers and the company’s financial objectives. Using metrics allows a company to quantify the impact of its strategy, and in doing so, it can better understand the relationships between strategic variables and its execution. As such, metrics are useful to diagnose issues and improve performance in a continuous manner, diagnose failures in marketing executions, and enable the organization to prioritize initiatives and issues that need the most attention.
6.2 Some Pre-revenue Ratios
The pre-revenue ratios we will be reviewing can be used before commercialization, for planning purposes. As such, we will be reviewing sales force coverage and break-even analysis.
6.2.1 Sales Force Coverage
As you reach the commercialization stage, you will need to hire specialized sales staff. Even at the planning stage, it might be useful to start to forecast how many individuals you will need to hire, if this is the route you choose in your commercialization effort. Each of these individuals will be responsible for a territory (based on a geographic region, sales potential, history, or a combination of these factors).
The purpose of this formula is to create balanced sales territories and align expectation internally. If a territory is underserved, it might lead to clients being underserved as well, and lead sales staff to engage in negative behaviors (identify fewer newer prospects, spend too little time with current clients). To balance this, you can use the following formula:
where
-
▪ Workload is the number of hours the individual is expected to work on client-related activity.
-
▪ Current accounts is the number of client accounts the individual is usually responsible for.
-
▪ Servicing an active account includes issues such as handling complaints, account maintenance, service meetings, as well as responding to special requests and collection;
-
▪ Prospects is the number of leads the salesperson is expected to maintain.
-
▪ Time spent trying to convert a prospect into an active account is the time spent each week working through the sales funnel.
So, in a situation where a company estimates that each week existing clients generate, on average, 5 hours of work, and a prospect takes about 6 hours to develop, you could optimize your salesforces accordingly:
Note that the sales representative’s time is not 100% covered by that workload and that some time should be allocated for items such as planning, administration, and order processing. Usually, you would allocate 10%–15% of a persons time to these activities.
6.2.2 Break-Even Analysis
The break-even analysis is a ratio that falls on the cusp of marketing and financial responsibilities. The objective is to calculate at which levels the sales generated by the company cover all the costs (both fixed and variable), so that you are neither losing nor making money. The formula is as follows:
Break-even analysis is built around three key assumptions:
-
Average price per unit: Determine the average price at which you are selling a unit. Include exceptional events (sales and discounts) into your average price if necessary. If you have more than one product for sale, you might need to average these out, or use scenario-based estimates.
-
Average cost per unit: This is the cost to produce each unit. If you are offering a service, it is the cost to provide the service on a per activity basis.
-
Fixed costs: These are the costs to operate the business, even if no products or services are sold. These include salaries, rent, equipment, and administrative fees.
If you have a problem calculating price and costs per unit, and are running a fairly standard set up, you can use a percentage estimate, running at a 50% margin (average cost per unit 0.5, average revenue per unit of 1). It will give you a rough estimate of your break-even point.
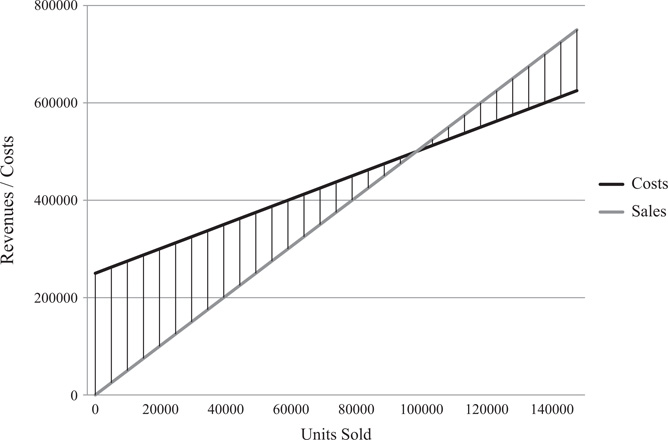
As an example, imagine a small medical device company that has a fixed operating cost of $250,000 per year, a variable cost of $2.5 per widget (cost to produce and sell each widget), and which sells its widget at $5 each. You would get the graph as shown in Figure 6.1.
The break-even point is exactly at 100,000 units. Any fewer units sold means the company is operating at a loss, and each unit over 100,000 units starts generating a profit for the company. Hence, the start-up founders can ask themselves the following: Can I realistically sell 100,000 units each year? If not, can I make changes in my costs (either variable or fixed) so as to reach the break-even point earlier?
Break-even is not as commonly used nowadays, since it relies on sometimes crude estimates for your costs per unit and your fixed costs. Furthermore, it is sometimes confused with payback period, which it is not. You do not include the investments to start your company, or the R&D to design your product. You focus exclusively on the costs to operate your organization, and the costs to manufacture and sell your products/services.
Nonetheless, break-even analysis is a useful tool to estimate minimum sales required to operate. If you are starting out, it might be more useful to calculate using more conservative numbers, to generate a conservative estimate. You could always calculate it again once you are in operations, with more precise numbers later on.
6.3 Ratios to Measure Sales Effectiveness
6.3.1 Return on Sales
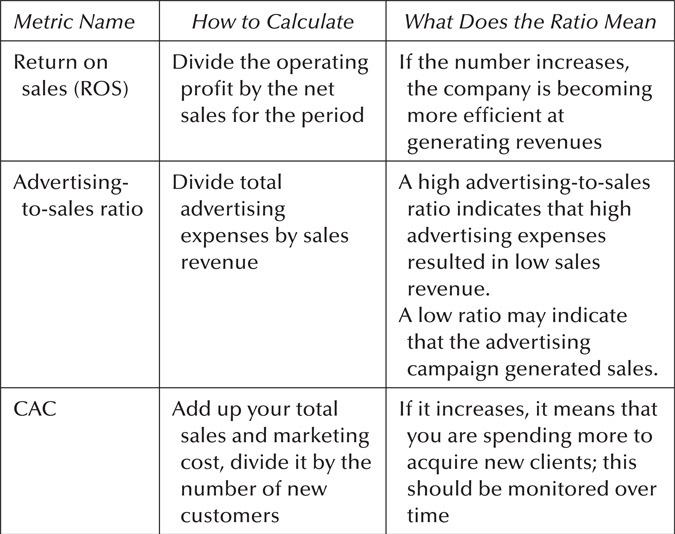
Return on sales (ROS) is a financial ratio that is used to monitor how efficient a company is at generating profits from its revenue, analyzing what percentage of total company revenues is actually converted into company profits.
Decision makers are interested in the ROS because it shows the percentage of money that the company actually makes on its revenues during a period. They can use this calculation to compare company performance from one period to the next.
The ROS formula is calculated by dividing the operating profit by the net sales for the selected period. For example, a company that generates $100,000 in net sales in a month has $90,000 in operating costs each month; hence, generating $10,000 in operating profits would have an overall ROS of 0.1. As such, the more efficient the company is, the higher the ratio.
6.3.2 Advertising-to-Sales Ratio
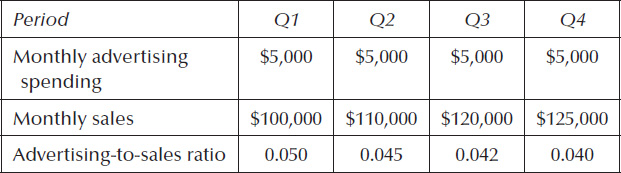
The advertising-to-sales ratio is used to measure how effective advertising was in generating short-term sales. This is calculated by dividing the total advertising expenses by sales revenue and measuring the impact over time.
An advertising-to-sales ratio that is diminishing over time would demonstrate that advertising expenses are generating new sales; this could mean the campaign was successful. A stable or increasing ratio indicates that the advertising campaign did not successfully generate sales. To better understand, let us go through an example.
A small company has decided to start an online advertising campaign, spending $5,000 each month (Table 6.1).
In our example, we can verify and confirm the effectiveness of the advertising campaign.
Note that some advertising campaigns are designed to generate long-term sales, or additional visibility, so looking at this ratio through short-term lens might not reflect the long-term benefits of the advertising.
6.3.3 Customer Acquisition Cost
This ratio is used to calculate how much you are spending to acquire each new client. To calculate it, add up your total sales and marketing cost and divide it by the number of new clients acquired. So, add up all the spending related to advertising, the relevant salaries, commissions, and bonuses, as well as add an overhead within a given time period, and then divide it by the number of new customers that you acquired in that same time period.
For instance, if you spent $15,000 on sales and marketing in a month and added 20 new customers that month, then your CAC is $750. You can then monitor this cost per customer over time. If it rises, it could be indicative that the strategies you are employing are losing their effectiveness and that some adjustments are warranted.
6.3.4 Marketing Percentage of CAC
To calculate the marketing percentage of CAC (M%-CAC), you simply calculate your marketing costs, and divide that number by the total sales and marketing cost, multiplied by 100. So, using our previous example, if the company calculated a marketing cost of $3,000, divided by the total sales and marketing cost of $15,000, it would have an M%-CAC of 20%.
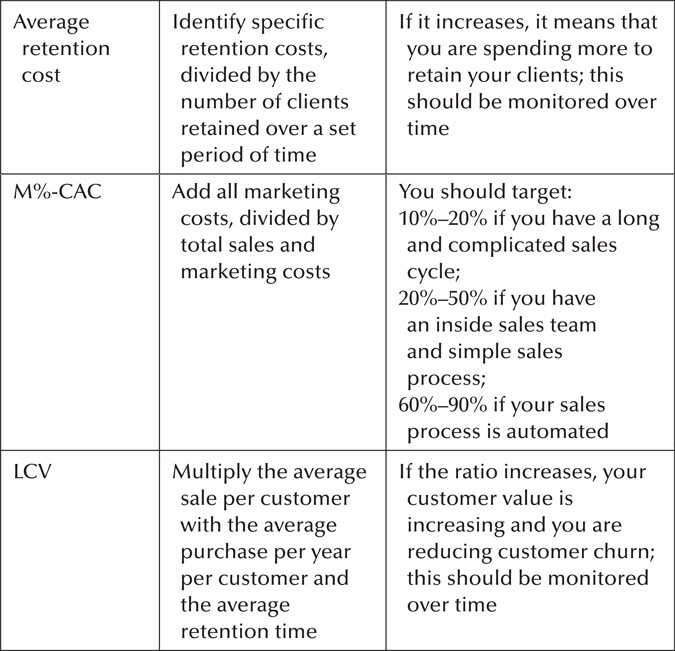
By calculating the share of marketing in the CAC, you can keep tabs if you are spending too much on marketing or too much on sales. If you depend mostly on an outside salesforce that deploys a long and complicated sales cycle, M%-CAC might be only 10%–20%. If you have an inside sales team and a simple sales process, M%-CAC might be closer to 20%–50%. And if you have a low sales cost and very simple sales cycle where sales are almost automated, the M%-CAC might be closer to 60%–90%.
6.3.5 Average Retention Cost
This ratio is used to calculate how much is being spent on customers to retain them. While it can be challenging to isolate direct costs related to retention, monitoring these costs on a per customer basis can help identify clients that are costing more to the organization than they are generating.
The average retention cost is usually calculated by isolating retention costs (from CACs) and dividing by the number of clients retained. As such, the firm needs to monitor the number of customers that it is attempting to retain and the total number it did manage to retain.
An additional source of difficulty is that some customers will be retained, even if no money is spent on them. As such, this ratio can be a little misleading, and increasing it will not necessarily increase customer retention.
6.3.6 Lifetime Customer Value
Calculating the value of each customer can be useful if you are trying to forecast revenue and growth, as well as comparing these numbers to customer acquisition and retention costs. You can calculate the lifetime value of your customers by multiplying the average sale per customer by the average number of times a customer buys per year by the average retention time in months or years for a typical customer.
Some ways to increase the lifetime value of your customers include preparing campaigns that reach out to existing customers and updating existing customers about new services and products (Table 6.2).
6.4 Digital Marketing Metrics
Your digital marketing efforts and advertising will require distinct metrics to measure. Fundamentally, there are three types of metrics you can measure: traffic metrics, conversion metrics, and revenue metrics.
6.4.1 Traffic Metrics
Traffic metrics are used to measure and monitor the number of users visiting your assets during the traffic generation stage of your campaign. At this stage, you should be focusing on visibility and overall presence.
6.4.1.1 Overall Site Traffic
Your website’s overall traffic is one of the easiest metrics to measure and monitor. Shifts (either upward or downward) can give you some basic insight on whether your overall campaign was a success. Some methods of measuring site traffic include the following:
-
▪ Page views: The number of times a page was loaded. This indicates how many times somebody reads your website. You can also see which pages garner the most views and adjust your content accordingly.
-
▪ Unique visitors: The number of unique visitors that visited your web page. Of note, this accounts only for the number of different “computers” that visited your website, not individuals. The accuracy of this metrics is debatable, but it is a good general indicator of how many different people are traveling to your web page.
6.4.1.2 Monitoring the Source of Web Traffic
Monitoring the source of your traffic can give you valuable clues as to why users are coming to your website and what keywords they used to find you. There are different elements you can monitor:
-
▪ Source of the web traffic: While most of the traffic you drive will come from search engines, it is possible to generate traffic from a variety of sources such as paid search, social media posts, social media ads, email marketing, content and blogs, and links from other sites. Identifying which sources are generating traffic can be useful to see if elements of your marketing strategy are successful.
-
▪ Type of web traffic: As users increasingly use mobile devices to surf the web, the growth in mobile traffic continually increases. As such, it might be useful to monitor if your traffic is being generated through traditional devices or if they are visiting your digital assets through mobile devices (such as their smartphones and other Internet-capable mobile devices). This metrics can offer insight on how you can successfully structure your content, ensuring better engagement with both mobile and non-mobile website visitors, as well as optimizing how your digital assets are displayed online.
6.4.1.3 Monitoring the Paid Traffic
If you paid to enhance your traffic (through sources such as Google Ads), then you will need additional and specialized ratios to analyze your traffic, to ensure that the traffic is generated by these paid advertisements, and is not being generated organically.
-
▪ Cost per click (CPC): CPC defines the amount of money you are paying to get a click on your ad. This will vary for the popularity of the word you choose, so choosing something generic like “lab services” will be a lot more expensive than “molecular pathology.”
-
▪ Click through rate (CTR): CTR measures how many people viewed your advertisement online, and then clicked on in to visit your website. Hence, it is an efficacy ratio, where you can see that the higher the CTR, the more people were the interested by your ads. This can also result in obtaining rebates from search engine marketing platforms such as Google AdWords due to the perceived high quality of your ad.
6.4.2 Conversion Metrics
The second set of metrics deals with the conversion of viewers, from interested to potential leads. As discussed earlier, converting website traffic into business leads or sales is the primary purpose for your digital marketing campaign. As such, metrics that provide insight into a successful campaign are important during conversion.
-
▪ Conversion rate (CVR): CVR is one of the most important metrics used to measure the success of your digital marketing effort. It is the percentage of unique visitors that complete a desired action on your website. Conversion goals can include signing up to receive a newsletter, contacting customer service to set up an appointment, or even an actual sale. As such, measuring how many visitors convert into leads is an important function, and can indicate opportunities to optimize your digital marketing. For example, you could create two distinct market campaigns and compare the CVR on them to choose which one to continue (often called split testing). In health and medical, CVR is usually around 2.5%. Lower conversion rates could be related to poor website design or disinterested visitors.
-
▪ Bounce rate (BR): The BR displays the percentage of visitors who leave your website after visiting a single page, without clicking any other links. In most cases, they will have found your content irrelevant to them. To lower your BR, you should start by looking at the traffic origin of your bounces, to see if some marketing channels are inappropriate and need optimization. If the problem is widespread, your overall content might need optimization.
-
▪ Average page views per visit/average time on site: These two indicators indicate how much time and content visitors consumed on average. Short visits could indicate lack of interest, whereas long visits could be indicative of attentiveness. Furthermore, the longer the visits, the more chances for engagement and conversion in leads/paying customers.
6.4.3 Revenue Metrics
The final goal of any digital marketing campaign is to generate sales. To quantifiably examine your web success, you should measure it using revenue metrics. Doing comparable testing (multiple campaigns) will enable you to find which campaigns are successful and which need optimization.
-
▪ Return on investment—digital (ROI-Digital): The digital ROI is measured by calculating traffic that converted into paying customer compared to the overall traffic generated. This will indicate the overall return of your campaign, relative to the amount directly invested into it. This is obtained by calculating revenues generated by new clients online during a certain period divided by the overall cost to acquire them.
-
▪ Cost to acquire a customer (CAC): While ROI will measure the number of new customers, it will not indicate the total cost to acquire each of these new customers. CAC calculations (total cost of digital marketing campaign divided by the number of new clients during the same period) will calculate the cost to acquire this new client and give you some insights into the profitability of your endeavor, especially when compared to the LCV of your customer. Depending on your marketing strategy and goals, if your CAC is higher than your LCV, some optimization is definitely warranted.
6.5 Final Notes
A few closing words on metrics before moving on to our last chapters.
For one thing, the usefulness of metrics is based on the quality of the data used. Using imprecise or incomplete data will hinder, not enhance, decision-making. As such, decision makers have to be especially cautious of the data they collect and use for their decision-making.
To conclude, it is important to understand that health-care is especially vulnerable to making decisions using ratios and metrics. The more you deal with human beings and the less you deal with objects, the less useful metrics should become. Over-rationalization of irrational elements seldom delivers great results for those involved.