
Chapter 9. An Introduction to Network Audit
Solutions in this chapter:
▪ A Survey of Vulnerability Assessment Tools
▪ Network Mapping
▪ Auditing Routers, Switches, and Other Network Infrastructure
Summary
Introduction
In this chapter we look at testing systems over the network. System testing is possible over the network, and provides a means to test compliance with:
▪ Change control processes,
▪ Patching and vulnerability mitigation,
▪ Malware (ensuring that no additional ports are listening),
▪ Basic Security configurations,
▪ Baselines Tests of systems, and
▪ Ensuring that no new or unauthorized hosts or networks have been connected.
What Is a Vulnerability Assessment?
The purpose of a vulnerability assessment is to ensure that systems are patched and locked down such that they are not running any unknown vulnerabilities. It the system is not checked, it will remain in an unknown state.
It is possible that a vulnerable system may be in use due to business need with compensating controls instead. For instance, a server may be running an insecure network service that is protected from remote exploit with a host firewall.
The Importance of Vulnerability Assessments
Risk is about assessing the likelihood of a threat exploiting a vulnerability. If you do not know what vulnerabilities exist – there is no way to determine risk.
Many compliance regimes necessitate the quantification of risk. It is also best practice from the perspective of due diligence.
A Survey of Vulnerability Assessment Tools
Some of the more widely used Scanning Tools are listed below. These are by no means all that is available. For a more complete list see www.sectools.org.
Nessus: The leading Open Source Vulnerability Assessment Tool
Nessus is a remote security scanner for Linux, BSD, Solaris, and other Unix solutions. It is plug- in-based, has a GTK interface, and performs over 1200 remote security checks. It allows for reports to be generated in HTML, XML, LaTeX, and ASCII text, and suggests solutions for security problems. Available from www.nessus.org/
NMAP: The King of Network Port Scanners
Nmap (“Network Mapper”) is a free and open source (GPL) utility for network exploration or security auditing. It is useful for network inventory, managing service upgrade schedules, and monitoring host or service uptime. Nmap uses multiple raw IP packets formats to determine what hosts are available on the network, what services (application type and version) are offered, what operating systems (and OS versions) are running on the hosts, what type of packet filters/firewalls are in use, and numerous other characteristics. (http://nmap.org/)
THC-Amap: An Application Fingerprinting Scanner
Amap is a new but powerful scanner which probes each port to identify applications and services rather than relying on static port mapping. Available from www.thc.org/releases.php
Paketto Keiretsu: Extreme TCP/IP
The Paketto Keiretsu is a collection of tools that use new and unusual strategies for manipulating TCP/IP networks. They tap functionality within existing infrastructure and stretch protocols beyond what they were originally intended for. It includes Scanrand, an unusually fast network service and topology discovery system, Minewt, a user space NAT/MAT router, linkcat, which presents a Ethernet link to stdio, Paratrace, which traces network paths without spawning new connections, and Phentropy, which uses OpenQVIS to render arbitrary amounts of entropy from data sources in three dimensional phase space. Available from www.doxpara.com/paketto.
ncops (newer cops)
Ncops is a tool that replaces Daniel Farmer and Gene Spafford's is_able and suid checks that come with their well-known COPS security software. As opposed to COPS, the check is exclusive rather than inclusive; this makes it ideal to scan a system without knowing what's on it as you're sure you won't be missing anything. It uses a recursive algorithm with a minimal number of forks to scan the entire file system and reports all files and directories that are world-writable unless they have been excluded. Available from www.angelfire.com/pq/osm/ncops/
NBTScan: Gathers NetBIOS Info from Windows Networks
NBTscan is a program for scanning IP networks for NetBIOS name information. It sends NetBIOS status query to each address in supplied range and lists received information in human readable form. For each responded host it lists IP address, NetBIOS computer name, logged-in user name and MAC address. Available from www.inetcat.org/software/nbtscan.html
LSOF: LiSt Open Files
This Unix-specific diagnostic and forensics tool lists information about any files that are open by processes currently running on the system. It can also list communications sockets open by each process. Available from ftp://vic.cc.purdue.edu/pub/tools/unix/lsof/
Network Mapping
One of the first tasks in a network audit is mapping the network. This process is used to find out what is running on the network. This is the systems and services being offered.
Premapping Tasks
Before you start to map the network, there are a few preliminary tasks that will ensure success. Most organizations will not have these initially and not all will apply. Starting this process will allow you to see what you have and what is missing. These are:
1 Determine the scope, what is it that you are planning to test?
a Individual networks
b A subnet range
c The entire network
d VPN and remote sites
2 Determine the risk. Have any previous assessments been completed?
3 Detail what your uptime requirements are. How long can the organization afford to be out of action for in the event of a:
a Non critical single component failure, and
b A critical single component failure,
c Total systems failure.
4 Collect the system and network design documentation. This can be broken down into the following components.
a System Logical/Infrastructure Diagram. This is a diagram showing the components of the system in enough detail to support the Concept of Operations document
b Concept of Operations documents for systems. This document details the purpose of each system (what is the purpose of the system, what does do/provide?)
i How it fulfills that purpose (how does it tick?)
ii Component dependencies on other components, (what parts of the system rely on)
iii Other parts of the system, what do they rely on them for and how?
5 List of Mandatory Requirements
a This component should detail exactly what mandatory requirements the organization is required by legislation, to meet. Attach copies of the relevant parts of the legislation.
b This should also show in a matrix, how you have met each regulation in enough so that there is no doubt that all requirements have been met and how.
6 Risk Based Requirements
a This should be a map of the prioritized countermeasures mapped out to the risks identified in the Risk Assessment, with specific reference to those countermeasures designed to counter the specific risks.
b Evidence is required that illustrates why the countermeasures are considered effective.
7 List of Critical Configurations
a These are the critical configurations that should be checked or changed on a regular basis, to ensure integrity of the system. It may include:
b firewall configuration (rule-sets, object definitions, filter lists),
c proxy server configuration file,
d web server configuration,
e mail server configuration,
f DNS server configuration,
g Database server configuration,
h Finance, Payroll and HR Systems and Applications
i O/S configuration (system auditing settings, passwords file settings, account profiles settings).
j The designers should also specify how these configurations/settings can be most efficiently checked on a regular basis.
8 Detailed Configuration Documentation
a This document should cover the detailed configurations of each component of the system. For non security enforcing devices, it should cover at least the following information for each component:
i Hostname
ii Network Address
iii Function
iv O/S Version and Patch Level
v Application Configuration Settings
vi User Accounts
vii Integrity Testing Settings
b For security enforcing devices, it should cover at least the following information for each component:
c Hostname
d Network Address
e Function
f O/S Version and Patch Level
g Application Configuration Settings
h User Accounts
i Integrity Testing Settings
j Router configurations listings
9 Detailed Network Diagrams – Detailed network diagrams clearly indicating:
a Host names of all components,
b Network addresses of all components,
c Function of all components,
d Network addresses of all network segments,
e Netmasks of all network segments, and
f Any VLANs and VPNs.
10 Policy Documents, Any related policy. This is likely to include an Access Policy
a The access policy should contain at least:
i Those services which are allowed to be:
ii Externally accessible by anyone,
iii Externally accessible by customers,
iv Externally accessible by external support providers.
v Those services available to all internally connected clients
b Access between internal networks, especially those networks that have different requirements for different levels of security. This should detail those services that are allowed between internal network segments,
i Those services to allow on an individual basis.
ii Those services available only from the system management segment.
iii Those services available only from the systems console
11 Procedures and Plans
a Change Implementation Procedures
b Operational Support Procedures
c Contingency Plans (something could go wrong during the test)
This process should provide information that will allow you to understand what your organization:
Any material that is not available can be created as a component of the initial review. In testing services and systems over the network, the end result is an increased understanding of what is running. Do not waste this. Use this to create an understanding of what and why. Most crucially, document this so that it is available next time.
What the Hackers Want to Know
Any attacker wants to find a vulnerable system that they have a tool to exploit. This does not mean that they need to get a “root” level exploit first time. A low level guest account may be enough to gain a foothold into your organization's systems.
As a result, an attacker will be trying to determine:
1 What systems are available
2 What operating system and patch level is being run
3 What application and version (patch level as well) is available
The attacker is working at an advantage. The advantage that allows them to have success is that there are so many insecure systems. Unlike the attacker, you can find out what you should be running and can verify this. This does not mean that you do not need to verify, but you know that a system is there, you do not need to spend the same amount of time finding the services running on a host.
What the auditor needs to do is validate that the list of services running on a host is limited to those that are formally authorized.
A hacker wants to know all they can about your system. Some of this will be from scanning the network and especially the perimeter, some of this information will be from other sources (such as social engineering).
Auditing Perimeter Defenses
Start testing by collecting information from the perimeter. When doing this, note what is discovered:
1 Are logs being produced, monitored and reviewed?
2 Does an IDS alert or an IPS block the connection?
3 Is the testing noted and recorded?
Many organizations fail to test their perimeter. Some state that firewalls are dead. The fact of the matter is that they are changing. It is far easier to protect 1 http tunnel with an RPC tunnel then 65,635 TCP ports with RPC as well.
Audit involves verification. Inquiry alone is never sufficient. Do not believe the firewall policy; do not trust a config that has been collected without being tested. To be compliant with any audit standard requires that it is also verified.
Network Mapping from Outside Your Firewall
Knowing what you should be allowing is only the start. The next stage involves firing packets through the firewall and security controls to see what is allowed and what is blocked.
Network Mapping from Inside Your Firewall
Ingress filters are great, but what about the traffic leaving the organization? To validate a system you need to test everything. In the case of a firewall, this means both ingress and egress filters need to be validated.
You need to be able to answer both what is allowed into and out of the organization.
Auditing Routers, Switches, and Other Network Infrastructure
System and Network vulnerability assessment is more than just ethical hacking or penetration testing of a target without any prior knowledge of its configuration or layout. Professional attackers in the real world will take considerable time to gain a detailed understanding of your environment before they actually launch their attack.
Unfortunately it takes a long time to collect all the information externally, without assistance, that it makes the exercise commercially unviable. This is a failing of most commercial security companies. The reason is that they do what is economically viable based on what they expect their competition to do. Understand what you are trying to achieve, and how you plan to achieve it. Aim to produce a result which can indicate:
▪ If your security is adequate for your needs
▪ If not, what you need to do to correct it
Ensure that you know what you need to secure. Risk is about determining the best path to minimize the effects of an incident.
A brief overview of this methodology is to:
▪ Gain an understanding of how your system was intended to operate and what you are trying to achieve by examining your “Concept of Operations” documentation about your system (this is the project plan or other scope materials such as business cases)
▪ Examine your supplied list of Access Requirements so you clearly understand what you wish to permit and what you wish to deny in regards to system access and from what locations
▪ Identify potential vulnerabilities with the design and configuration
▪ Identify the tools you will use to test the findings to see if the potential vulnerabilities do actually exist
▪ Prepare a test plan for testing the identified potential vulnerabilities
▪ Test each of the potential vulnerabilities to see if they actually exist
▪ Provide your organization with a report detailing the findings and recommendations on correcting the confirmed vulnerabilities and design flaws
Even if the report does not go to anyone else, it is evidence for compliance. You still need to make the report even if it will not be distributed.
The Methodology
Phase 1: Gain an Understanding of Your System
In the first phase of the examination, you should:
▪ Examine your concept of operations documentation to gain an understanding of what your system is intended to do, and how it is intended to do it.
▪ Analyze the network topology and systems configuration documentation, to identify all network devices including servers, workstations, routers and security enforcing devices.
▪ Examine you access requirements (access policy) to gain an understanding of what you intend to permit and what you wish to have denied by your system security. This is a very important aspect of the assessment
What a Cracker Does
To be able to attack a system systematically, a hacker has to know as much as possible about the target - reconnaissance is the first stage. A Hacker will want to get an overview of the network and host systems. Consulting the whois, ripe and arin databases is a good method of gaining information without leaving a trail. Information such as DNS servers used by the domain, administrator contacts and IP ranges routed to the Internet can be obtained. Searching the usenet for old postings of an administrator may reveal problems, products and occasionally configuration details.
An initial scan of the hosts may show up some interesting services where some in depth researching may lead to interesting attack possibilities. Another issue is looking up possible numbers for the company and trying to connect to a modem. Scanning telephone networks for answering devices and collecting these numbers for a later access attempt may lead to a first entry into the network. Such scans of telephone networks are usually referred to as “war dialling” and were used heavily before the Internet existed.
The reconnaissance phase may even consider going through trash bins which is known as “dumpster diving” or visiting loading docks of the target to collect additional intelligence. During the reconnaissance phase different kind of tools can be used such as network mapping tools, and vulnerability scanning tools. It is a great help during the attack phase to have an overview about the network.
Network mapping tools are especially important when doing an internal network assessment as more information is provided than an external scan. For getting a fast report on possible vulnerabilities and security weaknesses, a freeware or commercial vulnerability scanner is useful. These tools scan specified hosts or IP ranges for services and known vulnerabilities. These have to be checked as a large number of false positives are often reported.
Phase 2: System Design, Configuration and Support Vulnerability Assessment
A vulnerability assessment is conducted to speculate on induced vulnerabilities, which may have been generated by the network's use (or lack) of a certain product, component, or any topology design errors.
Some design and configuration problems you may find within your system are:
▪ Network topology design not as effective as current industry best practices
▪ Network management not as effective as current industry best practices
▪ Configurations not as effective as current industry best practices
▪ Well-known weaknesses in applications software
▪ A certain software package or configuration, which has known, exploitable weaknesses, is in use throughout the network;
▪ Well-known weaknesses in operating systems
▪ A certain type or family of devices, which has known, exploitable weaknesses, is in use throughout the network;
▪ Operating Systems configurations not as effective as with current industry best practices
While Phase 2 focuses on identifying weaknesses in the configuration of the networks and systems, an examination of management and administrative approaches is also undertaken.
For example, the vulnerability examination may point out the following types of weaknesses:
▪ Sensitive data being transmitted across the network in the clear;
▪ Passwords are not changed on a regular basis;
▪ Audit trail information is not being collected, or if it is collected, is not being reviewed to identify possible irregularities in system access or usage;
▪ There are no Security Practices and Procedures document which specifically states the user and administrator security features and responsibilities;
All weaknesses discovered need be prioritized in readiness for the next Phase.
Phase 3: Assessment Planning
The assessment planning phase is where we prepare to conduct the exploits required to compromise the potential vulnerabilities. In this phase, you identify what vulnerabilities you are going to attempt to exploit and put together a suite of tools in preparation for the next phase, the Attack. This eliminates false positives.
The tools which you will use can consist of:
▪ Commercially available security tools
▪ Publicly available hacker tools,
▪ Tools created for this purpose by your own staff
Once you have allocated all of the required tools functionality to the penetration plan, you can proceed to Phase 4.
Phase 4: The Attack
The penetration attack is an attempt to confirm or discount the presence of actual vulnerabilities from the list of potential vulnerabilities discovered in Phase 2.
In-depth testing will be conducted on selected network components. Use industry best practice tools and techniques (such as those from SANS and CISecurity.org), to identify:
A confirmation of your organization's security enforcing functions. Ensure that they support the access requirements by identifying what's accessible from:
1 Externally, normal public user
2 An internal restricted management segment
3 An internal network
Using specialist tools attempt to locate an exploit:
1 well-known weaknesses in applications software,
2 well-known weaknesses in operating systems,
3 well-known weaknesses in security enforcing devices,
Additionally, create tests to measure the ability of your:
1 audit capabilities
2 system administration practices and procedures
3 intrusion detection capabilities
4 reaction to intrusions when discovered by audit or intrusion detection mechanisms:
▪ Incident response plan,
▪ Contingency plans,
Phase 5: Report Preparation
The Report Preparation phase is where we put together all the information collected from the previous phases into a final report. A report should identify:
▪ The actual vulnerabilities confirmed from the list of potential vulnerabilities
▪ The nature of, and potential for loss, of each of the confirmed vulnerabilities
▪ Any remedial action required for each of actual vulnerabilities detected
▪ How effective your current security is in enforcing your access requirements.
Why This Approach Is Different
This approach differs from most; you don't just bang away blindly at your system with off the shelf commercial packages and obtain a printout from them at the end.
You should actually take the time to understand the following before you even start:
▪ What you are trying to accomplish,
▪ How you are planning to accomplish it, and
▪ What levels of security you desire the system to be able to accomplish?
Then begin testing, using:
▪ Commercially available tools,
▪ Some of the tools a would be hacker may use,
▪ Industry best practice methods (such as those from CIS and SANS).
When you finish the testing, you have a report, which doesn't just give you a pass or fail but actually tells you:
▪ If the planned level of security you desire from your system is being currently achieved,
▪ Any areas of your design, implementation, operational support procedures and policies that were considered below industry best practice and why,
▪ What vulnerabilities we discovered in your system,
▪ What the consequences of each of the identified vulnerabilities, and
▪ Recommendations on how to rectify each identified vulnerability.
Protection Testing?
Well-known security guru, Prof. Fred Cohen has stated:
“If you have to ask, you're not secure. To explain: You don't get computer security by accident. In fact, you can just barely get it if you work really hard at it. And if by some accidental miracle or magic, you were secure today, you would not be secure tomorrow, because things change.
I have heard many people talk about strong advocates of security as being paranoid. In fact, many people rate how seriously somebody takes information protection by saying that they are more or less paranoid. While the term may seem appropriate for anyone who would worry about somebody guessing a password and bringing down the entire corporate network, if guessing a single password would do this (there are several major corporations where this was the case) it is not paranoia. Paranoia is irrational fear. A serious concern about such weak protection is not irrational and is not fear.”
Why test is simple. It is better to know what problems your organization is facing rather than remaining blind to them. At least if you know what they are you can do something.
Penetration Testing or Ethical Attacks Vs Protection Testing
Fred Cohen started the movement towards openness in assessments. He defines this difference to be:
▪ Penetration testing is an effort to penetrate a system in order to demonstrate that protection has weaknesses.
▪ Protection testing is a way to confirm or refute, through empirical evidence that controls are functioning, as they should be.
Miscellaneous Tests
Network testing is more than just running a vulnerability scanner and printing the results. Try to automate the process and add other aspects of security into the mix.
Server Operating System Security Analysis
The Servers that are being protected by a firewall are often vulnerable to attack even with a firewall. One example of this would be an Windows based RRAS server that had been left in an unpatched state or was setup without enhanced security. An attacker, to gain unauthorized access to a site, could use these misconfigured and likely unknown lines. Another example is HTTPS. This service is passed via an encrypted tunnel through the Firewall. This means it bypasses any security considerations on the Firewall systems and is patched directly to the web server.
Testing systems over the network will help identify vulnerabilities early.
Phone Line Scanning
Phone Line Scanning identifies unauthorized and undocumented modems connecting client computers directly to the external telephone network. These phone lines and modems are important because they may represent security holes in the organization's security perimeter.
Large organizations employ hundreds of dial-up lines for voice communication with customers, suppliers and employees. As corporations computerize more of their activities, external phone lines and modems are used with increasing frequency to link internal computers with external computing resources.
These external phone links, while useful, often represent an undocumented back door into the corporate information network.
The objective is to gain an understanding and knowledge of the all entry points to the network. This is then measured against known vulnerabilities against each connection type (e.g. radio scanners or line tapping) and any system specific weaknesses. A vulnerabilities matrix is developed from this information relating to chances of attack, severity of the attack & expected uptime or availability given the system, platform & Susceptibility to attack (including Denial of Services). Phone line audits are more commonly known as War Dialing.
Phone/War dialing Audit Project tasks
▪ Review of all POTS and ISDN lines (Including PABX)
▪ Modem scans and sweeping.
This involves dialing each of the telephone numbers (that are in use in an organization) and making a determination whether a modem answers. If so, the question is whether there is a computer behind it. Some telephone numbers will be for lines connected to a fax, either computer generated or physical fax machine. However finding these fax systems is not the review goal.
Telephone lines which have authorized modems that are known to answer but are secure (i.e. those used for remote staff access going through TACACS+ or RADIUS for token authentication) could be culled from the list of telephone numbers to be tested depending on the aim of the test.
Social Engineering
Social Engineering is the acquisition of sensitive information or inappropriate access privileges by an outsider, based upon the building of inappropriate trust relationships with insiders. Attackers use this approach to attempt to gain confidential information, such as organizational charts, phone numbers, operational procedures, or passwords in order to evaluate the organization's vulnerability to social engineering attacks.
Social engineering involves cracking techniques that rely on weaknesses in wetware rather than software; the aim is to trick people into revealing passwords or other information that compromises a targetsystem's security. Classic scams include phoning up a mark who hasthe required information and posing as a field service tech or a fellow employee with an urgent access problem.
Social engineering can be defined also as “misrepresentation of oneself in a verbal manner to another person in order to obtain knowledge that is otherwise unattainable.”
Social engineering, from a narrow point of view, is analogous to a phone scam which pit your knowledge and wits against another human. This technique is used for a lot of things, such as gaining passwords, keycards and basic information on a system or organization.
Generally this is done in conjunction with other reviews, and is designed to ensure that your employees have an adequate awareness of security and the related issues.
Use the following methods to check the awareness levels within your organization:
1 Phone
2 Mail
3 Internet
4 Live visits
Network and Vulnerability Scanning
Some of the many ways to scan a network for services and vulnerabilities are listed below. There are many others and it is not important what the tool is, as long as it is effective and works within your organization.
1 Nessus Scans
a Differential Scans at automatic times
b Ad Hoc. Scans when required (may be automatically run at times).
2 Essential Net Tools – NBScan
a Used to list domains on a subnet
b May be used for up to a B Class at a time
3 CIS
a Ad. Hoc. Scans from NT Vulnerabilities (mainly)
b Detailed NBT Scanning
4 MBSA – Microsoft Baseline Security Analyzer (covered in the Windows Chapter)
a Requires Administrative Privileges
b Scans a range or Domain
c May be configured to scan as a script from the scheduler
In addition to the traditional scanning tools, network management software such as HP Openview can be configured as a reporter:
▪ HP Openview may be configured to receive traps from devices and report on them
▪ Cisco Switches are able to be configured to send traps when a NEW device is connected to the port
▪ A script should be configured on HP Openview to alert to NEW MAC addressing (i.e. not in a list)
Nessus
Nessus is one of the best vulnerability scanners on the market and best of all it is free (there are commercial versions). Nessus (www.nessus.org/nessus) tests a host or network configuration against a database of known vulnerabilities. This database is constantly being updated as new vulnerabilities are discovered.
Scanning and testing is carried out via the Nessus Attack Scripting Language (NASL) engine. NASL is the language that is used to describe the vulnerability checks and the NASL engine reads then execute the scripts. When a new vulnerability is discovered, a new NASL script is written to check for it, and is then made available as an update or “plug-in”. The commercial version of Nessus enables immediate updates as they are made available, while the free version allows for delayed updates.
Nessus can be configured as a client-server architecture where the servers are made to conduct the actual scanning and the clients are used to administer the servers. Servers can be placed in any part of the network and can perform the default scan policies or be configured to perform customized scans, which could include which host/network to scan, what to scan, which plug-ins to use, and so on. There can be one or several clients that can be used to configure the servers.
Nessus is currently available for the UNIX, Linux, FreeBSD and Windows platforms.
Detached Scans
A detached scan is a scan that runs in background, disconnected from the client. This document explains how to set up detached scans, and their potential use.
Installation
The KB saving experimental feature should be compiled in your nessusd. In addition to this, it is recommended that you use the session-saving module.
Once the KB saving feature is installed, you should notice the appearance of new options in the Scan options tab of the client (see Figure 9.1). Several new options will appear:
▪ Detached scan makes the test run detached. That is, the client will not get its output in real time.
▪ Continuous scan makes nessusd restart the test from scratch once it has been completed
▪ Send results to this email address: you can ask nessusd to send you the report directly by mail. See the constant scanning section to learn more about this feature.
▪ Delay between two scans defines, in seconds, how long should nessusd wait between two test being restarted from scratch (this option requires Continuous scan to be enabled)
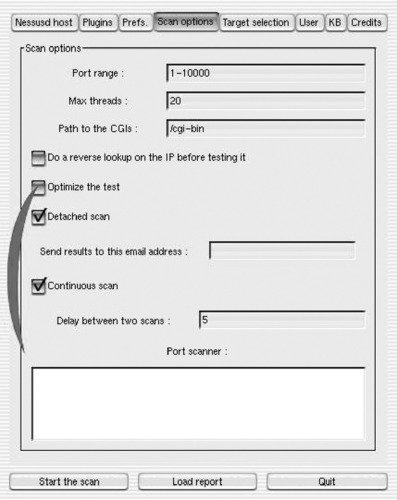 |
| Figure 9.1 Nessus Scan Option |
Using this feature to scan your network in background
A first use for this feature is to scan your network in background, quit the client, then come back a few hours later and download the results. This usage requires that you enable the session saving feature.
In the Scan options tab of the client :
▪ Activate the option Detached scan
▪ Deactivate the option Continuous scan
In the target selection tab of the client, activate the option Save this session.
Then start your scan, and quit the client. Restart it a few hours later, connect to nessusd, and you should see your session appear in the Previous sessions list in the tab Target selection (if you do not, then it probably means the test has not been completed yet, come back later). You can alternatively fill the email address field so that nessusd sends you the reports by mail when they are done (in .txt format).
Using the Nessus Client
Running the Nessus Client program from Tenable is the same as with any other Windows executable. When launched, an untitled Nessus screen will come up (see Figure 9.2). Note that the Select a scan policy pane is disabled until a connection to a server is established.
 |
| Figure 9.2 Starting the Client on Windows |
Since Nessus is based on a client-server model, you need to tell which server the scan will be running on. Clicking the Connect button at the lower left corner of the window will launch the Connection Manager (Figure 9.3).
 |
| Figure 9.3 Connecting to the Nessus Server |
In the default Windows installation, the local computer can also act as the default Nessus server. This allows the Nessus scans to be performed by the computer that launched the Nessus client. In the Connection Manager window, localhost is displayed as the default Server. Clicking the + or − buttons will add or remove servers. Selecting a server and then clicking on the Edit button will bring up the connection details. Clicking on the Connect button at the lower right corner of the Connection Manager window logs the local computer on to the server and, once connection is established, enables the selected computer (or if localhost is selected, the local computer) to perform Nessus scanning on a target computer or network.
After connection has been established, the user will be returned to the original Nessus Client interface. Notice that the Scan policy pane is now enabled, and shows the default scan policies for the machine. Selecting any of the policies and then clicking the Edit button brings up the Edit Policy window. Clicking on the + or – will buttons add or remove the policies.
For instance, to remotely scan one of the workstations in a network for common Windows operating system vulnerabilities, missing security updates/patches/hotfixes, and Windows local security misconfigurations is would be necessary to add a new policy and then select the appropriate plug-ins (It is also possible to modify an existing policy to include the plug-ins). We shall only focus on the settings that need to be changed and leave the rest to their default settings. Please make sure that you have been given permission to scan the target computer.
On the main Nessus client console, we click on the + button at the bottom of the Select a scan policy pane. This will bring up the Edit Policy window. Go to the Policy tab (Figure 9.4). Type the new policy name. Leave the Share this policy across multiple sessions.
 |
| Figure 9.4 Choose a Scan Policy |
Next, select the Options tab to select the options that match the requirements of the test (Figure 9.5).
 |
| Figure 9.5 Select the Options |
Clicking the Plug-in Selection tab (Figure 9.6) displays the available vulnerability test included in Nessus. These are grouped according to “family”. When you are configuring a new policy, by default all families and their individual plug-ins are ticked. If only checking for common Windows OS vulnerabilities, enable all the Windows family of plugins and disable all the others (Figure 9.6). Click Save to go back to the main Nessus Client screen.
 |
| Figure 9.6 Select the Vulnerability Checks via Plug-ins |
Now select the target host to be scanned. Click on the + button on the bottom left of the Network(s) to scan pane, then in the Edit target dialogue box. If the scan is against a single server, select Single Host, type in the Host Name field either the IP address or the host name of the target machine, then click Save (Figure 9.7). This will take you to the main Nessus Client screen, with the target machine shown on the left pane and the available scan policies on the right pane. Click once more on the customized policy to make sure it is selected. Now you are ready to run the scan.
 |
| Figure 9.7 Targeting the Scan on a Host or Network |
Click the Scan Now button. Nessus will automatically go to the Report tab and in a few moments will start displaying the results (Figure 9.8).
 |
| Figure 9.8 Reporting the Results |
If some of the open ports detected have been found to have vulnerabilities, the color of their fonts will change:
▪ Yellow For medium risk
▪ Red For high risk (Figure 9.9).
 |
| Figure 9.9 The Scan in Progress |
Clicking any of the open ports on the left pane will show the findings for that port (Figure 9.10).
 |
| Figure 9.10 Viewing the Output |
While running, a “Scan in progress” message will be displayed at the bottom of the screen, along with the buttons Pause and Stop. Clicking the Pause button interrupts the scanning to be resumed later. The Stop button terminates the scan altogether. The Scan in progress message and the Pause and Stop buttons will disappear when scanning is completed.
A detailed report of the findings can be exported via the Export button. The user is given the option what file- type, filename and in which folder to save the report. An example of the HTML report format is displayed in Figure 9.11.
 |
| Figure 9.11 The Report |
Using this feature to test your network automatically every “X” hours
Using this feature to keep one's KB up-to-date
This feature can also be used to keep your set of knowledge bases is always up-to-date, while making little noise on your network. The idea is to let nessusd scan your network again, and again with a restricted plug-in set (only nmap for instance), but to only scan hosts that have an outdated KB. You can then start a new session that will only scan hosts that have been port scanned already, thus saving some time.
To do so:
▪ In the KB tab of the client:
Activate Enable KB saving
Select Only test hosts that have never been tested in the past
Activate Reuse the knowledge bases about the hosts for the test
Activate the four Do not execute… options
Set the field Max age of a saved KB to some sensible value, like 432000 (5 days).
If you want to minimize network noise, then set the field Max threads to 1 in the same tab.
This way, nessusd will only scan the hosts that have not been scanned during the last 5 days on your network, then wait an hour, and restart this operation from scratch. You can then safely reconnect to nessusd a few days later, and ask it to only scan the hosts that have been port scanned already.
Constant Scanning
The main advantage of a detached continuous scan is that you can proactively check the security of your own network, and make sure that it's tested for all the new security flaws that appear on www.nessus.org.
Imagine the following : you configure nessusd once-for-all, then you let it run, and do not care anymore about it, and you even forget it, until the day you receive an email from it, saying: “Your web server is vulnerable to a new buffer overflow, here is how to patch it”.
You can use Nessus to do this on a UNIX or Linux server.
Initial Setup
Before You Start nessusd, Ensure That Sendmail is in Your $PATH !
You must first do a full security audit of your network. This makes noise and fills the logs, but you will not do that very often. You may choose to do it in background, although it is not recommended. Once you feel confident about the security of your network (or you consider having done what you could), fire up your nessus client and connect to nessusd. Then configure the following:
▪ In the ‘Scan options’ panel:
▪ Set the max threads option to something low (except if you are scanning a big network).
▪ Enable the ‘Optimize the test’ option
▪ Enable the ‘Detached scan’ option
▪ Fill the ‘Send results to this email address’ field with your email address
▪ Enable the option ‘Continuous scan’
▪ Set the ‘Delay between two scans’ value to whatever you want (I suggest a low value)
▪ In the ‘KB’ panel:
▪ Enable the ‘Enable KB saving’ option
▪ Toggle on the ‘Test all hosts’ button
▪ Enable the ‘Reuse the knowledge bases about the hosts for the test’ option
▪ Enable the options ‘Do not execute…’, to reduce network noise if you wish. You can choose to run all the tests but the port scans, in which case you'll just want to enable the option Do not execute scanners that have already been executed'. If you care more about the network noise generated by Nessus rather than security, set all these options.
▪ Enable the option ‘Only show the differences with the previous scan’ (this is imperative)
▪ Set the max. age of a saved KB to something decent (a few days at least)
▪ In the ‘Target selection’ panel
▪ Enable the option ‘Save this session’ (optional)
▪ Enter the IP addresses of the hosts the security of which you want to check
Now, you can start the test, and nessusd will slowly scan your network, and send you a mail if anything is found.
Keeping your Plugins Up-to-Date
Linux or UNIX support using cron jobs to call nessus-update-plugins every X hours (with X being the time in hours between update checking). This ensures that the nessus-update-plugins will add new plugins to you collection, and nessusd will load them between two scans.
Differential Scanning
Vulnerability assessments across entire networks produce volumes of noise, both in network traffic and the information collected. Vulnerability scanners are producing more and more inclusive reports. Meanwhile they need to be run more and more often against a network to do proactive assessment.
A diff scan doesn't produce a complete report. It is limited to displaying only those areas that have changed since the last Nessus report. New issues and vulnerabilities can easily be noted, and hence be resolved more quickly.
This section explains how to use differential scans in Nessus. Using continuous scans with diff scan together can (with other Nessus options) reduce network traffic. This also minimizes the time between discovering vulnerable systems.
How to Use It
To use the diff scan, you need to be know about KB saving. When Nessus performs a vulnerability assessment, it fills the KB (knowledge base) with the data collected about the remote host (see Figure 9.12). To implement the diff scan feature, you need to:
▪ Enable KB saving
▪ Enable the re-use of the KBs.
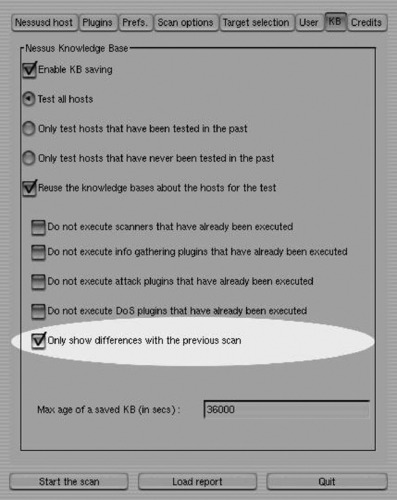 |
| Figure 9.12 Knowledgebase Options |
The first option forces nessusd to note down all the information collected about a remote host. The second option asks it to load the KB of a host before a test is done. This allows it to compare new entries in the KB with the current one, and determine if things have changed or appeared. Using this option will result in a report covering only those areas that have changed between scans.
More Reading
Read the documentation. Nessus provides detailed guidelines on how to both implement and run on a number of platforms and also provides ideas that may be useful increasing an automated compliance program for the network.
Essential Net Tools (EST)
EST is available from -www.tamos.com/. ENT has a selection of GUI Based Windows Networking Tools, the most useful of these being NBScan. NBScan is able to scan a subnet (up to a Class B network) for Domains and Workgroups.
This may be used to list unknown Domains and Workgroups within your organization and to look for unauthorized systems that have been connected to the network or which have been removed from the domain (see Figure 9.13).
 |
| Figure 9.13 Essential Net Tools in Action |
Cerberus Internet Scanner
Cerberus Internet Scanner (CIS) uses a modular approach to vulnerability scanning. Each scan module is implemented as a DLL so when an update to a particular module occurs the user only needs to download the updated DLL. The administrator can select all or only those which modules they want to run.
The command line capability of CIS allows it to run scans in the background. This means that if a user wants to scan a large number of hosts they can implement this in a batch file and once a scan has started control is returned to the command prompt so the next and subsequent scans can start immediately. Some of the CIS features include:
▪ Host Scan modules include WWW, SQL, ftp, various NT checks, SMTP, POP3, DNS, finger and more
▪ Reports generated are HTML based with hyper-text links to more information
▪ Graphical User Interface
▪ Multi-threaded so scan time is minimized.
▪ Light on memory usage
Summary
There are many good commercial and freeware network and vulnerability scanners. Many of these may be automated. This is an important aspect of network compliance. Compliance is not only about security, but also proving that controls work. This requires evidence and the scheduled processes that can be provided using automation supplies that evidence.
Remember, verify and validate.
..................Content has been hidden....................
You can't read the all page of ebook, please click here login for view all page.