CHAPTER 5
How to Read and Use a Gantt Chart
“I’ve seen lots of timeline charts,” Patrick observed. “In fact, you have a magnetic scheduling board hanging on the wall. Yes, it shows the sequence and the deadline, but it seems like an awful lot of work.”
Patrick’s information needs about his projects not only involve time but also issues such as the following.
![]() How many people do I need to accomplish the work?
How many people do I need to accomplish the work?
![]() How do I assign and schedule people to get the most accomplished?
How do I assign and schedule people to get the most accomplished?
![]() How can I reorganize my project if my deadlines get cut?
How can I reorganize my project if my deadlines get cut?
![]() How do I track and monitor the actual performance of the work compared to the original plan?
How do I track and monitor the actual performance of the work compared to the original plan?
The Gantt chart, properly used and understood, can help Patrick with a number of these problems.
DEFINITIONS
Here are the key terms you will need to understand for this chapter.
A Gantt chart is a timeline chart that shows the sequence of tasks in a project over a calendar period.
Project management software is one of various software packages that create and calculate project management charts, such as Gantt, PERT, and CPM.
A resource includes people, tools, equipment, and money that one must assign and allocate to get the work done.
Resource planning is the process of determining how to get the best use of people, equipment, tools, and money to get the job done.
A lag activity is a task that requires you to allocate time but no resources.
A slack resource is a resource without a job during some periods of a project.
Resource overload occurs when more jobs than resources exist during some periods of a project.
Leveling is rearranging a schedule to eliminate resource overloads.
Leveling within slack is rearranging a schedule without letting the deadline slip.
A resource Gantt chart is a Gantt chart that shows how resources are allocated.
A tracking Gantt chart is a Gantt chart that allows comparison of the actual to the plan for project tasks.
GANTT CHARTING FOR SINGLE PROJECTS
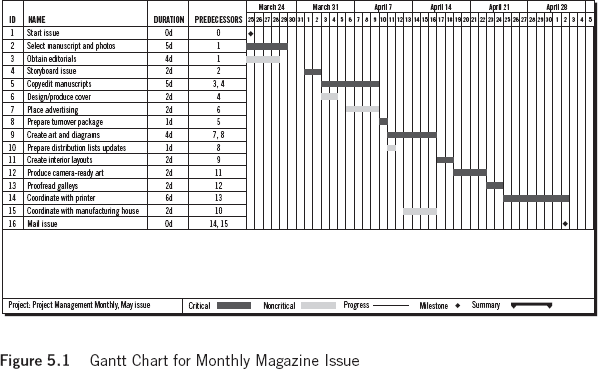
The Gantt chart in Figure 5.1 uses the task table from Chapter 4 (see Figure 4.7) and applies the Gantt chart techniques in the last exercise.
This chart aided the creation of a computer program called Microsoft Project. To make the chart, task-table data is entered in the project window, and the program does the rest, including determining the critical path.
Computer Software in Project Management
If you do not have a problem, do not try to fix it with a computer. This is always good advice but particularly in the area of project management software, which once won a category award in a computer magazine for “type of software most often purchased merely to sit unopened on the shelf.”
In the same way that a word processing system is of little use to someone who does not know how to type, project management software is absolutely no use to someone who does not know how to create Gantt charts and other tools by hand. If you already know how to use the tools, a computer can speed up the work, do the arithmetic, keep good records, and draw diagrams neatly. Although these are considerable benefits, they do not constitute project management. Project management is what project managers do, not what software does. It would be more accurate to say that there is no such thing as project management software—rather, there is project tracking and scheduling software.
Project management software will do some or all of the following: create Gantt, PERT, and CPM charts from task-table information (you still have to do the task table yourself); allow assignment of resources to tasks; keep track of your resource scheduling; signal conflicts between resource availability and workload; track resources allocated among projects; create task lists; compare plan to actual task accomplishment; calculate the critical path; and more. Updating ease and the ability to look at multiple options are other advantages.
The availability and ease of use of project management software have improved remarkably in the last several years. Many project managers who previously found software too complicated now find it useful. Much good software is now available, and the field is changing rapidly. Read test reports in leading computer magazines, analyze your needs, and shop accordingly. Do not focus attention on price of the package; the least expensive part of using software will be the cost of the software itself. Most of the real cost will be user time.
Project management software packages fall into a few categories. These are power categories, not quality categories.
Major projects. For the very largest projects ($10 million plus), purchase comprehensive packages that run on mainframes and networks. Primavera is one well-known package in this category.
Medium projects. The most popular category of project management software includes titles such as Workbench, Timeline, SuperProject, and Microsoft Project. This category of full-featured programs allows management of projects containing up to one thousand or fifteen hundred tasks comfortably. Most cost from $400 to $700.
Small projects. For basic Gantt charting, small projects, or other projects not using resource planning software, numerous packages including FastTrack Scheduler, InstaPlan 5000, and OnTarget are available. Some organizer software packages and personal information managers now include Gantt-chart functions. Some shareware (EasyProject) works at this level.
Nonproject management software. “If the only tool you have is a hammer, all problems look like nails.” Use the right tools for the job. In addition to formal project management software, you can use spreadsheets, drawing programs, flowcharters, and other tools.
INTERPRETING YOUR GANTT CHART
For a tool that is so visually simple and clear, the Gantt chart is surprisingly rich and powerful in helping you understand your project and solving problems.
Five Ways to Use a Gantt Chart for Project Management Success
Use Gantt charts to:
1. See how long the project will take.
2. Prepare easy-to-read and easy-to-understand reports for management, customers, and team members.
3. Determine resource requirements for your project.
4. Determine who must do each job.
5. Measure your progress.
The following discussion examines how to use a Gantt chart to achieve project management success.
See How Long the Project Will Take
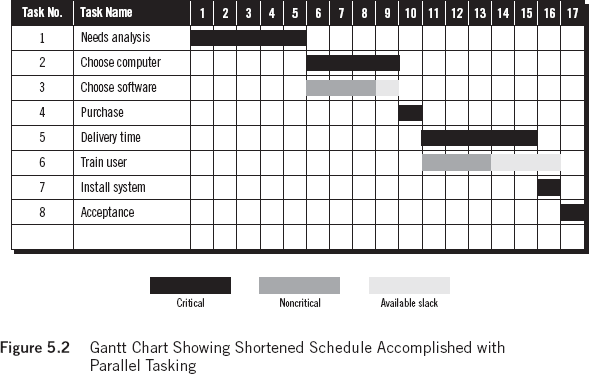
When you drew your own Gantt chart in the exercise that ended Chapter 4 and reviewed the computer-drawn Gantt chart that began this chapter, the first piece of information you obtained is how long the project will take. The hand-drawn Gantt chart shows working days: exactly seventeen. There are twenty-three days of scheduled activities, but the project ends up taking seventeen days because some tasks are parallel (see Figure 5.2).
The more sophisticated computer-drawn chart includes an allowance for weekends. If a task takes five days and starts on Thursday, it ends the following Wednesday. The computer will also allow you to mark holidays and vacations for individual staff members on the internal calendar, and it will adjust your tasks accordingly.
If your plan shows that you will finish on or ahead of schedule, then you are ready for the next step. But what if it does not?
Imagine that your boss tells you that you have fifteen days available to buy the project management software. Your plan says it will take you seventeen days. Have you made a mistake in your Gantt chart?
No, you have not. In a more complex project with many parallel activities, sometimes there is no easy way to tell how you are doing until you finish the task table and draw your first Gantt chart. Neither is it unusual nor is it a sign of poor planning to find that your first-draft Gantt chart shows you to be over schedule; however, you cannot stop with your first draft.
What can you do? When your plan shows you to be over schedule, and you need to shorten the plan, try one of these ideas: crash tasks, make more tasks parallel, or reduce scope.
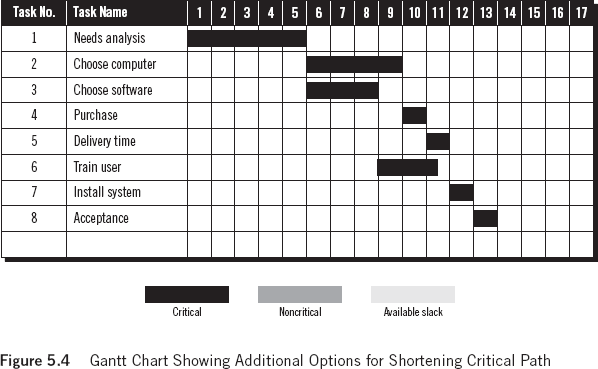
Crash tasks. Remember, crashing a task means that you add resources in order to lower time. You might, for example, put two people onto Needs analysis if you feel that would cut the time needed by two days. Putting two people on Choose software to save two days would not work because that task is noncritical. Shortening a noncritical task will not speed up the project; it will give you more slack.
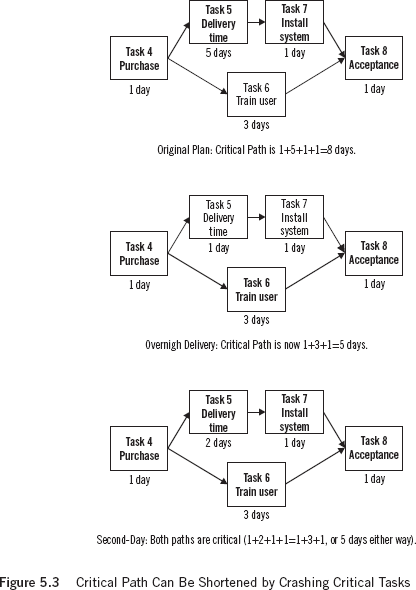
Extra resources are not only extra people. Take a look at Task 5 in Figure 5.2, Delivery time. Imagine that you are ordering our computer and software from a mail order house. This is called a lag activity, a task that involves time (waiting for the box to arrive) but no work (you can do other things while waiting for the box). What if you paid for express delivery?
Say there are two options in the mail order catalog besides regular delivery: overnight, which would reduce the task to one day, and second day, which would reduce the task to two days. Which is the better choice if time is of the essence?
Common sense says that overnight delivery is faster than second-day delivery but not in this case (see Figure 5.3). If you make Delivery time a one-day task, it takes one more day to Install system. That is two days; but Train user takes three days! Whether Delivery time takes one or two days, Task 8, Acceptance, starts at the same time. In project management language, it is usually not productive to crash a task more than the slack available on the noncritical parallel path.
The exception is that sometimes you can crash a task to lower risk elsewhere in the project. If you believe that Install system is particularly risky, you might choose overnight delivery because you wanted a day’s margin in the project.
Make more tasks parallel. You may go back to your original sticky-note PERT chart and ask yourself if more tasks can be made parallel. Say that you want to use express delivery. Remember, these strategies for shortening your project can be combined. You could, in theory, start the training as soon as you decide which software package you are going to buy, as long as you do it out-of-house.
If you make Train user dependent on Choose software, notice you now can go with overnight delivery to save more time!
Now the critical path is only thirteen days—but all tasks are now critical. The lack of any slack indicates that the risk of this project has increased somewhat, but you still have two days to hit your fifteen-day target.
Remember, any project can normally be laid out in different ways. Make sure you know the various options beforehand, so you can make the choice that is strategically best for your project.
Reduce scope. Similar to crashing, reducing scope means deciding to do less work on a given task, which will reduce time. One example is to do a less-detailed needs analysis rather than a comprehensive one. That allows completion of the project in two or three days. Or you might decide that you are only going to look in a certain range of computers and ignore everything else. That would cut Task 2 back a day. Reducing scope is not necessarily reducing quality. You have to focus on what is important and what is not. Sometimes a project experiences mission creep, when many optional (and possibly unimportant) work assignments add up to a serious burden.
If you are cutting trivia, then you can reduce the scope of certain tasks without harming project quality.
Prepare Easy-to-Read and Easy-to-Understand Reports for Management, Customers, and Team Members
Even if your project has complex needs, many of your managers, customers, and team members will need less-detailed information. The clarity and simplicity of a Gantt chart makes it an ideal tool for management-reporting requirements. It is visual, has a high impact, and does not require special training in project management to interpret. Project management software programs often allow you to print your project schedule with varying detail and specificity. Select more simple charts for people with more general information needs.
Determine Resource Requirements for Your Project
One of the greatest challenges in managing single or multiple projects is figuring team size and assigning and allocating people and other resources to project tasks. A Gantt chart can be an extremely helpful tool in resource planning.
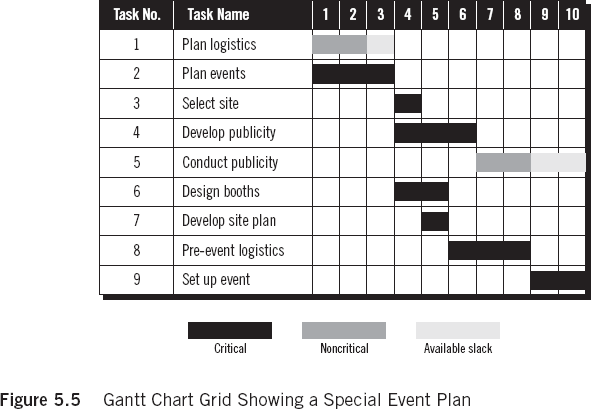
Now look at a slightly more complex project to illustrate the various ways you can allocate resources on your project (see Figure 5.5).
In the project in Figure 5.5, you are planning a special event. You have the basic Gantt chart and now must plan resource needs. Assuming each bar on the Gantt chart represents one person working full time for each period, and assuming that all people on the team have all the skills necessary to do the tasks, what is the optimum size of the project team for this project? Follow these steps.
1. Determine resources needed in each period. Add the number of bars in each column. You will see the answer in Figure 5.6.
If your situation is more complex (some jobs require less than one full-time person; others require more than one person), you will need to note on each bar how many person-hours of work are required, then add those numbers.
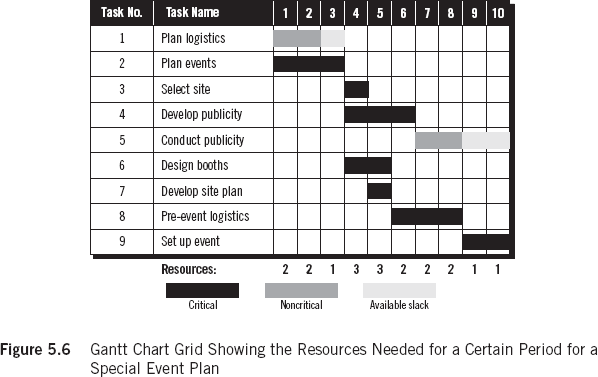
2. Determine greatest, smallest, and median resource requirements. The greatest resource requirement in any given period is three. The smallest resource requirement is one. In the majority of weeks, however, you need two.
3. Use the median resource requirement as your standard. Your project team should consist of two people.
4. Determine what to do with underutilized resources. You have two potential problems. In three days (Day 3, Day 9, and Day 10) of your project, you are paying two people, but you have work for one. The person without a job those days is called a slack resource. Is that a bad thing? Not necessarily.
First, you do not assume everything in the project will go perfectly, because that is frequently not the case. A little slack resource time lowers project risk. Use the resource if things go wrong. If nothing goes wrong, find something else for that resource to do (such as help somebody else to speed up his task).
Second, slack resources can be used for crashing other tasks. If you find slack resource time in your project, for which you have to pay, look for crash opportunities. They may be a bargain.
Third, since you are dealing with multiple projects, a slack resource can be moved to work on other projects during any slack periods. (You will learn how to do that in much greater detail later.)
5. Figure what to do when you have more work than resources. You have a much tougher problem during days 4 and 5 of your schedule, when you have jobs for three people and two people on your team. Deal with periods of resource overload in one of two ways.
![]() Get more resources. Not all project resources have to be on the project from start to finish. Temporary resources, including overtime work, borrowing someone from elsewhere in the organization, hiring temporary workers, or contracting out may be available. If you can get someone outside our regular team to come in and do Task 6, Design booths, then you will be able to complete the rest of the work according to schedule.
Get more resources. Not all project resources have to be on the project from start to finish. Temporary resources, including overtime work, borrowing someone from elsewhere in the organization, hiring temporary workers, or contracting out may be available. If you can get someone outside our regular team to come in and do Task 6, Design booths, then you will be able to complete the rest of the work according to schedule.
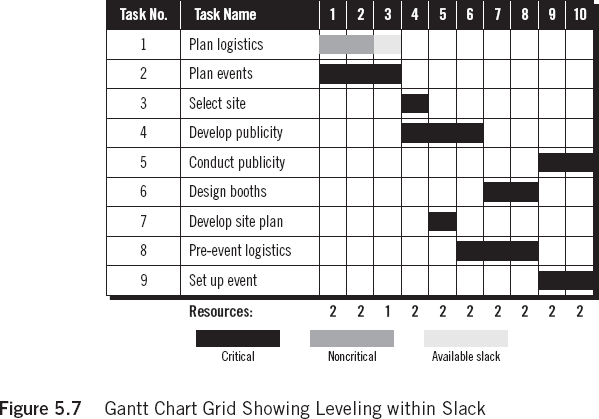
![]() Level the schedule. Rearrange the project schedule to avoid resource overload. This is called leveling the project. When you make any two tasks parallel, assume that you have (or can get) resources to do the jobs at the same time. If that is not true, then you cannot make the jobs parallel after all. When time is not the project driver, leveling is not necessarily bad news. The project just takes a little longer.
Level the schedule. Rearrange the project schedule to avoid resource overload. This is called leveling the project. When you make any two tasks parallel, assume that you have (or can get) resources to do the jobs at the same time. If that is not true, then you cannot make the jobs parallel after all. When time is not the project driver, leveling is not necessarily bad news. The project just takes a little longer.
When time is the driver, you can only level within slack. This means that you look for ways to shift noncritical tasks so that they do not bump any critical tasks and still eliminate any resource overloads. This is not always possible but is often worth trying. When successful, it makes the resource problem go away without pushing out the deadline.
In the sample project, slack time is available in days 9 and 10. The booths do not need to be ready until the start of Task 9, Set up event. You can move Task 6 into days 7 and 8, but that shifts the resource overload; it does not make it go away. Task 5, Conduct publicity, has two days of slack. If you move Task 5 so that it is parallel with Task 9, all of the overload goes away. You have successfully leveled within slack.
Remember, nothing is perfect. Although you have eliminated the resource overload and kept the project on schedule without spending money on additional resources, you have also eliminated most of the slack and made another task critical. This increases project risk. As a project manager of single or multiple projects, you frequently make risk/time/budget tradeoffs in deciding how best to achieve your goals.
Determine Who Must Do Each Job
Determining team size is important. The next step is to assign our team. Consider nonleveled project, and have a team of two full-timers and one temporary person.
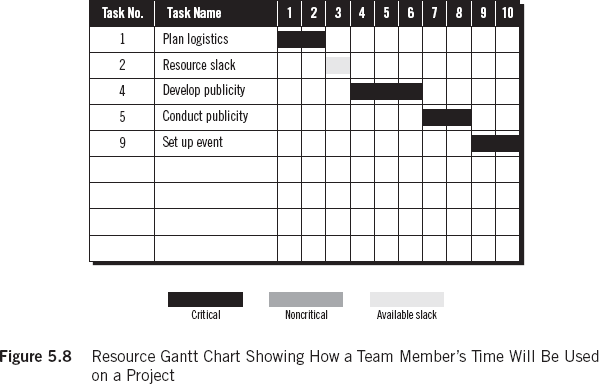
You know that the temporary person will do Task 6, Design booths; that leaves two people to do all remaining tasks: Sam and Gary. Assign Sam to Task 1, Plan logistics, and put Gary on Task 2, Plan events.
Sam will finish at the end of Day 2. To find his next job assignment, look down the next column in Figure 5.8 and see that no task starts on Day 3. Sam is a slack resource for that day. You may keep him in reserve for problems, have him help Gary on Task 2, or assign him to other work within the department.
Gary finishes Task 2 at the end of Day 3. Now, Gary and Sam are both available for new tasks. Looking down the Day 4 column, we see that three tasks start. One of them, Task 6, is already assigned. It is at this point that you must do skill matching for jobs.
The first possibility is that Sam has the skills to do either of the jobs. In that case, wait and schedule other team members who may be more limited in expertise, then have Sam do what remains.
The second possibility is that Sam has the technical skill to do one job but not the other. In that case, Sam has to be assigned the job for which he has skills, and Gary takes the other one.
The third possibility is that Sam does not have the technical skills to do either of the jobs starting on Day 4. Now what? Sam would then become another slack resource, and you would have a resource overload in Day 4. You either find something for Sam to do elsewhere, get another temporary resource, or level the schedule to cope with the resource overload. (This does not mean that Sam is not a valuable employee. It means that the skills needed that day do not match what your team has to offer. Now, if Sam cannot do any of the jobs in the project, he is on the wrong team. This is much less common.)
You continue through the project, assigning Sam and Gary to tasks. If you are using project management software, it will often allow you to assign people to tasks and will keep track of how much they have been delegated. In more complex projects, the theory is no more involved than that described, but the arithmetic can become beastly.
Especially in managing multiple projects, but also in managing a single large project, it is important to keep track of assignments. You can use a Gantt chart to help. Since it shows how work is allocated over time, you can draw a resource Gantt chart (see Figure 5.8) showing how a resource can be used just as easily as a project is managed. If you are using project management software, your program may create a resource Gantt chart automatically.
Notice that in Sam’s case, there cannot be any parallel bars (that would mean he is working sixteen hours that day). If the jobs take partial rather than full days, Sam’s schedule can include overlaps.
Resource Gantt charts have a number of uses. First, they help a project manager keep track of staff assignments. Second, they help team members track their own schedules and identify potential conflicts well in advance of trouble.
Third, and possibly most important, when managing multiple projects using the same staff, you can find cross-project dependencies, where someone’s delay on one task in Project A can affect another task in Project B—because the same person is scheduled to do both tasks. The resource Gantt chart, listing all tasks in all projects for each team member, helps identify those problems and allows solving them in advance.
Measure Your Progress
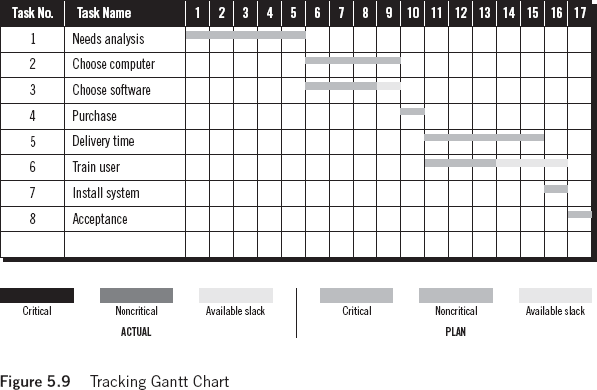
The final way you can use a Gantt chart is to measure progress. This is called a Tracking Gantt Chart (see Figure 5.9), and it facilitates seeing the consequences of various project events.
Refer to the Gantt chart you completed at the end of Chapter 4.
You will notice that the bars have changed pattern and size (see Figure 5.10); they now represent the original plan. To make a tracking Gantt chart, you keep the original plan, then draw in new bars to accurately represent how long the tasks take, not how long you think they will take.
What happened on the project?
The first thing you will notice is that Task 1 took one day less than scheduled. That means tasks 2 and 3, both dependent on Task 1, could start a day early. Unfortunately, Task 3 went a day over schedule.
Does that make things even? You gained a day and lost a day, but you are still a day ahead. The day you gained on Task 1 was on the critical path, and the day you lost in Task 3 was noncritical—it was slack. Task 4 starts a day early in spite of Task 3 being delayed.
The paperwork got stuck in purchasing, and a one-day task dragged into three days. Task 4 is critical. That means you go into Task 5 running a day behind schedule, since Task 4 has eaten up the day you had gained in Task 1 and another one.
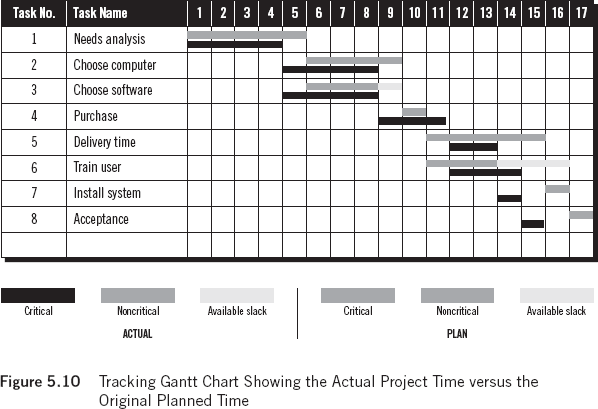
Then you decided to crash Task 5 (you chose second-day air), reducing it to two days. The training started a day late, but the project finished early.
The value of this process is that at every stage you know what each early or late task means to the fate of the project as a whole. You can forecast a revised deadline at any time. You are empowered to act when you see the deadline slipping, and you save the project by understanding how to crash when needed.
EXERCISE
Analyze a Project Gantt Chart
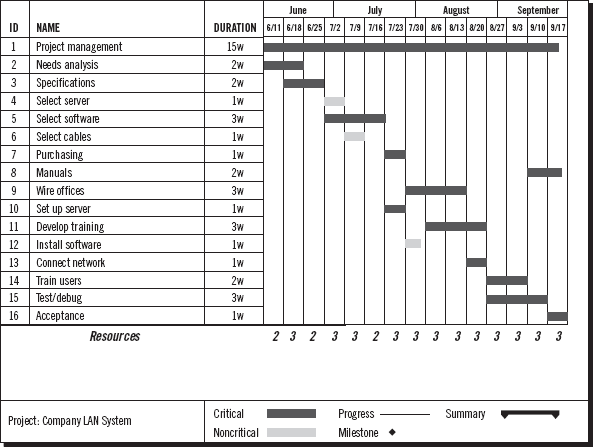
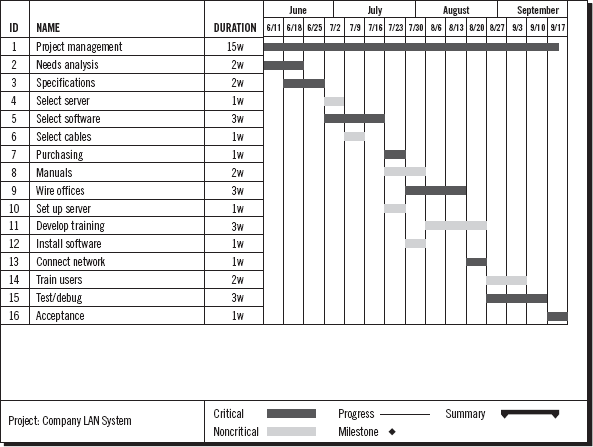
Your project is to install a company LAN system. You have been given the accompanying computer-created Gantt chart. Each job takes one full-time person. Team members possess all the necessary skills. Your job is to:
- Determine the optimum team size, including the project manager.
- Identify periods of resource slack.
- Identify periods of resource overloads.
- Determine if it is possible to level within slack.
Answer Key
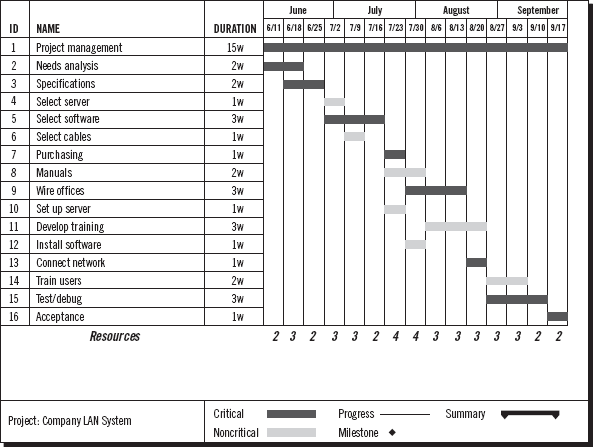
1. The first answer key shows the number of resources required each week of the project. The minimum is two, the maximum is four, and three is most common. Three is therefore the optimum team size.
2. Resource slack is available in the weeks of 6/11, 6/25, 7/16, 9/10, and 9/17, with one person each available those weeks (Resources = 2, Team Size =3).
3. Resource overload occurs in the weeks of 7/23 and 7/30, with the team being one person short in those weeks (Resources = 4, Team Size = 3).
4. One way to level within slack is shown in the second answer key. Assuming that Task 8, Manuals, can wait until the end of the project, you can shift that task so it takes place in the weeks of 9/10 and 9/17, when resource slack is available. This eliminates one week of resource overload. Second, you are delaying the start of Task 12, Install software, by one week, which eliminates the second week of resource overload.
First Answer Key
Second Answer Key