
19. Principles of Database Design
In our first chapter, we introduced the notion that relational databases are a collection of data, stored in any number of tables. The tables are assumed to be related to each other in some fashion. In the previous chapter, on maintaining tables, we made clear that database designers can, if they choose, assign foreign keys to ensure that certain relationships between tables are properly maintained.
However, even with our knowledge of primary and foreign keys, we still have not yet addressed the basic issue of how to design a database in the first place. The main questions to address are:
![]() How should data be organized into a set of related tables?
How should data be organized into a set of related tables?
![]() What data elements should be placed in each table?
What data elements should be placed in each table?
Once tables and their data elements are defined, then a database administrator can go about the business of creating foreign keys, indexes, appropriate datatypes, and so on.
There is never be a single correct answer to these questions. Besides the fact that every organization or business is unique, there is seldom a definitive solution for any given situation. Much depends on how flexible a business wants its data design to be. Another factor is the existence of current data and the need to maintain continuity with that data. Very few organizations have the luxury of designing their databases in a vacuum, apart from what already exists.
Despite these provisions, certain database design principles have evolved over time to guide us in our quest for an optimal design structure. Many of these design principles stem from the most influential architect of relational database design, E.F. Codd, who published his groundbreaking article “A Relational Model of Data for Large Shared Data Banks” in 1979. This article laid the foundation for what we now call the relational model and the concept of normalization.
Goals of Normalization
The term normalization refers to a specific process that allows database architects to turn unstructured data into a properly designed set of tables and data elements.
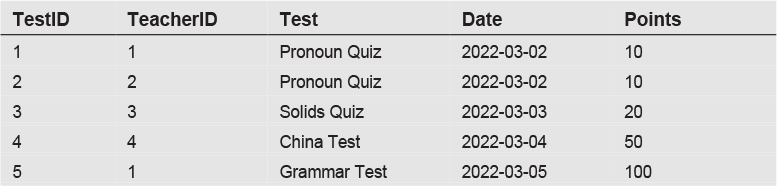
The best way to understand normalization is to illustrate what it isn’t. To do this, we’ll start with the presentation of a poorly designed table with a number of obvious problems. The following table attempts to present information about all the grades that students have received for the tests they’ve taken. Each row represents a grade for a particular student.

Let’s first briefly describe the information that each column in this table is meant to provide. The columns are:
![]() Test: A description of the test or quiz given
Test: A description of the test or quiz given
![]() Student: The student who took the test
Student: The student who took the test
![]() Date: The date on which the test was taken
Date: The date on which the test was taken
![]() Points: The total number of possible points for the test
Points: The total number of possible points for the test
![]() Grade: The number of points that the student received
Grade: The number of points that the student received
![]() Format: The format of the test: essay, multiple choice, or both
Format: The format of the test: essay, multiple choice, or both
![]() Teacher: The teacher who gave the test
Teacher: The teacher who gave the test
![]() Assistant: The person assigned to assist the teacher
Assistant: The person assigned to assist the teacher
We’ll assume that the primary key for this table is a composite primary key consisting of the Test and Student columns. Each row in the table is meant to express a grade for a specific test and student.
There are two obvious problems with this table. First, certain data is unnecessarily duplicated. For example, we can see that the Pronoun Quiz, given on 2022-03-02, had a total of 10 points. The problem is that this information must be repeated in every row for that quiz. It would be better if we could simply view the total points for that particular quiz just once.
A second problem is that data is repeated within certain single cells. In the sixth row, the Format is both Multiple Choice and Essay. This scenario exists because this test had both types of questions. This makes the data difficult to use. If we wanted to retrieve all tests with essay questions, how could we do that?
More generally, the problem with this table is that it attempts to put all known information into a single table. It would be much better to break down the information in this table into separate entities, such as students, grades, and teachers, and represent each entity as a separate table. The power of SQL can then be used to join tables together as needed to retrieve any desired information.
With this discussion in mind, let’s now formalize what the process of normalization hopes to accomplish. There are two main goals:
![]() Eliminate redundant data. The previous example clearly illustrates the issue of redundant data. But why is this important? What exactly is the problem with listing the same data on multiple rows? Well, besides the unnecessary duplication of effort, redundancy reduces flexibility. When data is repeated, any changes to particular values affect multiple rows rather than just one.
Eliminate redundant data. The previous example clearly illustrates the issue of redundant data. But why is this important? What exactly is the problem with listing the same data on multiple rows? Well, besides the unnecessary duplication of effort, redundancy reduces flexibility. When data is repeated, any changes to particular values affect multiple rows rather than just one.
![]() Eliminate insert, delete, and update anomalies. The problem of redundant data also relates to this second goal, which is to eliminate insert, delete, and update anomalies. Suppose, for example, that a teacher gets married and changes her name. Because we would like the data to reflect the new name, we must now update all rows that contain her name. However, because the data is stored redundantly, we must update a large amount of data, rather than just one row.
Eliminate insert, delete, and update anomalies. The problem of redundant data also relates to this second goal, which is to eliminate insert, delete, and update anomalies. Suppose, for example, that a teacher gets married and changes her name. Because we would like the data to reflect the new name, we must now update all rows that contain her name. However, because the data is stored redundantly, we must update a large amount of data, rather than just one row.
There are also insert and delete anomalies. For example, let’s say we just hired a new teacher to teach music. We would like to record this information somewhere in the database. However, because the teacher hasn’t yet given any tests, there is nowhere to put this information, because we don’t have a table specific to the entity of teachers.
Similarly, a delete anomaly would occur if we wanted to delete a row, but by doing so would eliminate some related piece of information. To use another example, if we had a database of books and wanted to delete a row for a book by George Orwell, and if that were the only book for Mr. Orwell in the database, then that row deletion would eliminate not only the book, but also the fact that George Orwell is an author of other books that might be acquired in the future.
How to Normalize Data
What, specifically, does normalization mean?
The term itself originates with E.F. Codd and refers to a series of recommended steps for removing redundancy and updating anomalies from a database design. The steps involved in the normalization process are commonly referred to as first normal form, second normal form, third normal form, and so on. Although some individuals have described steps up to a sixth normal form, the usual practice is to go through only the first, second, and third normal form. When data is in third normal form, it is generally understood to be sufficiently normalized.
We won’t describe the entire set of rules and procedures for converting data into these forms. Other texts elaborate on the process in great detail, showing how to transform data into first normal form, then into second normal form, and finally into third normal form.
Instead, we’ll summarize the rules for getting data into third normal form. In practice, an experienced database administrator can jump from unstructured data to third normal form without having to follow every intermediate procedure. We’ll do the same here.
The three main rules for normalizing data are as follows:
![]() Eliminate repeating data. This rule means that no multivalued attributes are allowed. In the previous example, we cannot allow a value such as “Multiple Choice, Essay” to exist in a single data cell. The existence of multiple values in a single cell creates obvious difficulties in retrieving data by any given specified value.
Eliminate repeating data. This rule means that no multivalued attributes are allowed. In the previous example, we cannot allow a value such as “Multiple Choice, Essay” to exist in a single data cell. The existence of multiple values in a single cell creates obvious difficulties in retrieving data by any given specified value.
A corollary to this rule is that repeated columns are not allowed. In our example, the database might have been designed so that, rather than a single column named Format, we had two separate columns named Format1 and Format2. With this alternative approach, we might have placed the value “Multiple Choice” in the Format1 column and “Essay” in the Format2 column. Under rules of normalization, this would not be permitted. We don’t want repeated data, whether it is represented as multiple values in a single column or as multiple columns.
![]() Eliminate partial dependencies. This rule refers primarily to situations in which the primary key for a table is a composite key, meaning a key composed of multiple columns. The rule states that no column in a table can be related to only part of the primary key.
Eliminate partial dependencies. This rule refers primarily to situations in which the primary key for a table is a composite key, meaning a key composed of multiple columns. The rule states that no column in a table can be related to only part of the primary key.
Let’s illustrate this with an example. As mentioned, the primary key in the Grades table is a composite key consisting of the Student and Test columns. The problem occurs with columns such as Points. The Points column is really an attribute of the test and has nothing to do with students. This rule mandates that all non-key columns in a table refer to the entire key and not just a part of the key. Essentially, partial dependencies indicate that the data in the table relates to more than one entity.
![]() Eliminate transitive dependencies. This rule refers to situations in which a column in the table refers not to the primary key, but to another non-key column in the same table. In our example, the Assistant column is really an attribute of the Teacher column. The fact that the assistant relates to the teacher and not to anything in the primary key (the test or the student) indicates that the information doesn’t belong in this table.
Eliminate transitive dependencies. This rule refers to situations in which a column in the table refers not to the primary key, but to another non-key column in the same table. In our example, the Assistant column is really an attribute of the Teacher column. The fact that the assistant relates to the teacher and not to anything in the primary key (the test or the student) indicates that the information doesn’t belong in this table.
We’ve now seen the problems and discussed rules for fixing the data, but how are proper database design changes actually determined? This is where experience comes in. And there is generally not a single solution to any given problem.
That said, the following is one solution to this design problem. In this new design, several tables have been created from the one original table, and all data is now in normalized form. Figure 19.1 uses an entity-relationship diagram to show the tables in the new design.

Figure 19.1 Normalized design
As mentioned in Chapter 11, entity-relationship diagrams do not display detailed data. Instead, they indicate the overall structure of the data. The primary keys in each table are shown in bold. A number of ID columns with auto-increment values have been added to the tables, allowing relationships between the tables to be defined. All other columns are the same as seen previously.
The main point to notice is that every entity discussed in this example has been broken out into separate tables. The Students table includes information about each student. The only attribute in this table is the student name.
The Grades table includes information about each grade. It has a composite primary key of StudentID and TestID, because each grade is tied to a student and to a specific test.
The Tests table has information about each test, such as date, TeacherID, test description, and the total points for the test.
The Formats table includes information about the test formats. Multiple rows are added to this table for each test to indicate whether the test is multiple choice, essay, or both.
The Teachers table includes information about each teacher, including the teacher’s assistant, if one exists.
Following is the data contained in these new tables, corresponding to the data in the original Grades table.
Students table:

Teachers table:

Tests table:
Formats table:

Grades table:

Your first impression might be that we have unnecessarily complicated the situation, rather than improving upon it. For example, the Grades table is now a mass of numbers, the meaning of which is not completely obvious upon quick inspection.
However, remembering SQL’s ability to easily join tables together, you can also see that there is now much greater flexibility in this new design. Not only are we free to join only those tables needed for any particular analysis, but we can now also add new columns to these tables much more readily without affecting anything else.
Our information has become more modularized. Now if we decide that we want to capture additional information about each student, such as address and phone number, we can simply add new columns to the Students table. And, when we want to modify a student’s address or phone number later, that change will affect only one row in the table.
The Art of Database Design
Ultimately, designing a database is much more than simply going through normalization procedures. Database design is really more of an art than a science, and it requires asking and thinking about relevant business issues.
In our grades example, we presented one possible database design as an illustration of how to normalize data. In truth, many possibilities exist for designing this database. Much depends on the realities of how the data will be accessed and modified. Numerous questions can be asked to ascertain whether a design is as flexible and meaningful as it needs to be. For example:
![]() Are there other tables that need to be added to the database? One obvious choice would be a Subjects table, which would allow for the selection of tests by subject, such as English or Math. If a Subjects table were added, it could then be asked whether we’d want to relate the subject to the test or to the teacher who administered the test.
Are there other tables that need to be added to the database? One obvious choice would be a Subjects table, which would allow for the selection of tests by subject, such as English or Math. If a Subjects table were added, it could then be asked whether we’d want to relate the subject to the test or to the teacher who administered the test.
![]() Is it possible for a grade to count in more than one subject? It might be that the English and Social Studies teachers are doing a combined lesson and want certain tests to count for both subjects. How would we account for that?
Is it possible for a grade to count in more than one subject? It might be that the English and Social Studies teachers are doing a combined lesson and want certain tests to count for both subjects. How would we account for that?
![]() What do we do if a child flunks a grade and is now taking the same tests a second time? We would need to determine how we would differentiate the student’s grades each time the test is taken.
What do we do if a child flunks a grade and is now taking the same tests a second time? We would need to determine how we would differentiate the student’s grades each time the test is taken.
![]() How do we allow for special rules that teachers might implement? For example, a teacher might want to drop the lowest quiz score in a particular time period.
How do we allow for special rules that teachers might implement? For example, a teacher might want to drop the lowest quiz score in a particular time period.
![]() Does the data have special analysis requirements? If there is more than one teacher for the same subject, do we want to be able to compare the average grades for the students of each teacher, to ensure that one teacher isn’t inflating grades?
Does the data have special analysis requirements? If there is more than one teacher for the same subject, do we want to be able to compare the average grades for the students of each teacher, to ensure that one teacher isn’t inflating grades?
The list of possible questions is almost endless. The point is that data doesn’t exist in a vacuum. There is a necessary interaction between data design and real-world requirements. Databases must be designed to allow for flexibility and ease of use. However, there is also a danger that databases can be over-designed to a point where the data becomes unintelligible. An overzealous data administrator might decide to create 20 tables to allow for every possible situation. That, too, is inadvisable. Database design is something of a balancing act in the search for a design that is sufficiently flexible but also intuitive and understandable by users of the system.
Alternatives to Normalization
We have emphasized that normalization is the overriding principle that should be followed in designing a database. However, this is not always the case.
For example, in the realm of data warehouse systems and reporting software, many practitioners advocate using a star schema design for databases rather than normalization. In a star schema, a certain amount of redundancy is allowed and encouraged. The emphasis is on creating a data structure that more intuitively reflects business realities, and also one that allows for quick processing of data by special analytical software.
To give a brief overview of the principles of star schema design, the main idea is to create a central fact table, which is related to any number of dimension tables. The fact table contains all the quantitative numbers that are additive in nature. In our previous example, the Grade column is such a number, because we can add up grades to obtain a meaningful total grade. The dimension tables contain information on all the entities related to the central facts, such as subject, time, teacher, student, and so on.
As an additional possibility, special analytical software can be employed that allows database developers to create cubes from their star schema databases. These cubes extend analysis capabilities, allowing users to drill down through predefined hierarchies in the various dimensions. For example, a user of such a system would be able to drill down from viewing a student’s entire semester grades to seeing grades in an individual week.
Figure 19.2 shows what a database with a star schema design might look like for our grades example.

Figure 19.2 Star schema design
In this design, the Grades table is the central fact table. All other tables are dimension tables.
The first four columns in the Grades table (Date, TestID, StudentID, and TeacherID) allow each row in the fact table to be related to the corresponding row in a dimension table. For example, the StudentID column in the Grades table can be joined to a StudentID value in the Students table. The other two columns in the Grades table have additive numeric quantities. Notice that Points is now in the Grades table. In our normalized design, points was an attribute of the Tests table and the grade was in the Grades table. By putting both the Grade and Points in a single fact table, we can more easily sum grades and compute averages (Grade divided by Points) for any set of data.
Certainly, this is only a brief introduction to the subject of designing databases for data warehouse applications. However, it illustrates the point that there are many different ways to design a database, and the best way often relates to the type of software that will be used with the data.
Looking Ahead
This chapter covered the principles of database design. We discussed the basics of the normalization process, showing how a database with a single table can be converted into a more flexible structure with multiple tables, related by additional key columns. We also emphasized that database design is not merely a technical exercise. Attention must be paid to the organizational realities and to considerations as to how the data will be accessed and utilized. Finally, we briefly described the star schema as an alternative to conventional normalized design, in an effort to emphasize that there is often more than one feasible approach.
In our final chapter, “Strategies for Using Excel,” we’ll discuss some interesting possibilities for using Excel to complement our knowledge of SQL. In our quest to sharpen our SQL skills, we must not forget that there is a world out there beyond SQL. We should not expend efforts on SQL when the underlying objective can be accomplished more effectively through other means.