
CHAPTER 7
Conventional Views on Sources of Market Inefficiencies
One goal of this book is to help investors choose a research emphasis that conforms to the source of market opportunities. We want to make sure that if we are spending time on research and security selection, we are focused on what’s important. A starting place in our research is accepting that when we engage in active management, when we research stocks under the guise that market beating portfolios can be constructed as a result of our research, we are first and foremost acknowledging that there are inefficiencies present in the market. If one does not accept that markets are inefficient, then one shouldn’t be spending time researching stocks or paying an active management fee. It’s as simple as that. To be actively engaged in the management of stock portfolios—whether as a professional or an amateur—is to believe that markets are inefficient.
But one will find that there are different types of inefficiencies, and there are strategies that are formed to take advantage of particular inefficiencies. So it’s important to not only differentiate among various types of inefficiencies that exist in the market, but also to understand how one’s strategy is attempting to capitalize on the inefficiencies. This, in my view, is of paramount importance. How can you know what you’ve found if you don’t know what you’re looking for? Also, is what you’re looking for likely to be present?
For discussion purposes, I consider market inefficiencies and opportunities that arise from market inefficiencies from two different perspectives: behavioral view and conventional view.
The behavioral view is not as concerned with access to information as it is with our assessment of uncertain assumptions that are based on the information that’s currently available. The conventional view is concerned with access to information and finding information that gives one an informational advantage. In this way, what I term the structure of the market plays a particularly important role. Structural elements to a market’s efficiency may include the dissemination of information, liquidity, and the depth of professional involvement in securities markets. Some markets and subsets of the domestic market may have structural elements that impede the efficient pricing of some securities.
I discussed behavioral errors and the behavioral view of investor decision making in Chapter 5. In this chapter, I talk about the conventional view of sources of market inefficiency, with a more specific look at structural impediments to efficient pricing. Still, there are no rules that state that behavioral errors and structural impediments can’t intermix. For example, structural impediments may exacerbate the effects of behavioral inefficiencies in the pricing of some micro-cap stocks. This chapter will focus on one type of structural impediment to market efficiency, but I would note at the outset that investment analysis in the large-capitalization subset of the market is probably much more affected by behavioral errors. While this chapter is meant to give the reader a broad perspective on how most professional investors approach the sourcing of investment opportunities (the conventional approach), the remainder of this book will spend additional time on behaviorally based inefficiencies and how we shape our research processes to take advantage of poor decision making on the part of others (or combat insidious behavioral errors that seep into our own processes and thinking).
In addition, note that not all money managers, mutual funds, and sell-side analysts adhere to a conventional view of market inefficiencies. There are a number of firms that now take a behavioral approach to stock selection, and there are a number of analysts that integrate a similar idea into their process. Still, the fact that many marketing messages convey a conventional approach to the selection of securities speaks to the appeal of the conventional approach to consumers and likely the analyst community. At the very least, it’s worth understanding the connections and differences between the two differing views.
To start, I would note that the conventional view of market inefficiencies fits neatly within the confines of the efficient markets hypothesis (EMH). Recall from Chapter 3 Fama’s1 delineation of three sources of market inefficiencies:
| Weak-form efficiency: | Past price behavior cannot be used to predict future price behavior. |
| Semistrong-form efficiency: | Public information cannot be used as the basis to profit in investment markets, as the market assimilates public information immediately. |
| Strong-form efficiency: | Nonpublic information cannot be used as the basis to profit in investment markets as the market assimilates all information (public and private) immediately. |
In short, the inefficiencies that Fama is concerned about in the EMH are related to three forms of information. The weak-form efficiency concerns information that is taken from price movements, which directly relates to technical analysis. The semistrong-form efficiency concerns publicly available information, such as information found in regulatory filings and in company presentations, which directly relates to fundamental analysis. The strong-form efficiency concerns all information available including nonpublic information, which relates to insider trading and the inequitable dissemination of company information. The underlying assumptions, of course, are that behavioral errors do not play a part in security mispricing, or if they do, they are not problematic, as the other two theories underpinning the efficiency of markets (not the EMH) discussed in Chapter 6 work to effectively maintain an efficient market.
However, the construct that Fama delineated with the EMH was drawn from our understanding of markets in 1969. It’s based on the notion that the primary elements to market inefficiencies are information based, not behaviorally based. Information at one time was likely a factor in the pricing of securities, as the dissemination of information was slow and unreliable, and the regulatory environment was not as concerned with information dissemination. What we’ve learned over the past 30 years is that it’s not only information that’s important, but also the way in which security analysts approach the use of information in forecasting future uncertainties. Indeed, the world today is saturated with information, and the dissemination of information is quicker than ever. Moreover, the regulatory environment in the United States has evolved to emphasize information and its equitable and speedy dissemination. The world has changed much since the late 1960s. Still, as discussed in Chapter 4, we continue to find anomalous pricing and a seemingly never-ending parade of market bubbles and market crashes, so market efficiency has hardly been cured by new technology and new regulation.
As was discussed in Chapter 3, beginning in the 1970s, a new movement began to take shape that sought to explain market inefficiencies with newer understandings of individual decision making. This new behaviorally based research questioned the Fama-Friedman arguments underpinning the broader theory of market efficiency, but importantly has never been a very good fit within the EMH. Behaviorally based theories explaining why markets are inefficient relate to the way in which individuals analyze information and form uncertain assumptions; they don’t pertain to information access.
It may be that the EMH is correct, even in the strong form. Information of any kind may not give an investor an edge in their analysis of a common stock. But this doesn’t mean that the assessments of forward uncertainties, based on current information, are formed rationally. In Chapter 3, when I briefly discussed the EMH, the reader may have been surprised at my brevity. The reason I only touched on this topic was that I don’t generally disagree with the EMH. Information that is currently available does not give investors an edge. It’s the way in which we approach uncertainties based on information that gives us an edge, not the availability of information.
If we are undertaking research in a large-capitalization stock such as IBM or even a mid-cap stock such as Lexmark International, it’s unlikely that we are going to uncover information that is “new” or that will give a practitioner an advantage. Still, that is not to say that our research of these two companies will necessarily concur with research others have done or with the market’s assessments of value. In many cases, they will, and our resulting estimates of intrinsic value will not differ greatly from others. In other cases, our research will result in valuations that are significantly different than the market’s values or the values that others arrive at, but the difference will not reflect new information but more reasonable or unreasonable assessments of underlying uncertainties. A central point that I’ll make time and again is that behavioral factors skew our (or others’) impression and estimates of important uncertainties. I come back to the notion that it is the way that we approach uncertainties that’s important, not just uncovering the uncertainties.
This is not a book on economics; it’s a book about investing. While it’s fair to argue that behavioral theories don’t point to reliably actionable policies, my purposes are not as grand. Indeed, I have a fairly jaded view of economics in general. Too many in politics and finance conflate theory with fact and science with art. Beware of those who rely solely on a single economist’s theories or a “school of thought.” These charlatans don’t understand that economics is not science and not logic; economics is a tool to help us understand the world around us. To this end, it is very useful to society, but it can also be dangerous when we use it as a crutch. Markets, like life, are complex.
Additionally, this chapter may provide some insights to those that evaluate money managers or mutual funds (or invest in them). While performance is often the barometer on which investors make decisions, I would propose that a more forward-looking manager identification process would first and foremost determine if the manager is fishing in a pond with fish in it. In other words, the consultant should determine if the manager’s process reflects the type of opportunities that are present in the manager’s universe. Performance is fleeting and is very time-period dependent; it can provide conflicting signals, depending on the time horizon examined and the start date and stop date. In a reflection of the inconsistent signals resulting from measures of performance, savvy institutional investors are increasingly focused on process. Does the process make sense, and is the manager’s process one that can identify opportunities, or is it a process that is focused on factors that are not really applicable to the manager’s opportunity set or universe? To this end, this chapter may provide some insights into what to look for.
In the next section, I’ll discuss structural impediments to market efficiency, with a particular focus on underfollowed stocks. I’ll end this chapter with some thoughts on the pertinence of structural impediments to the large-cap universe. In an appendix to this chapter, I’ll discuss what I term underexplained phenomena. While the anomalies discussed in this chapter’s appendix undermine weak-form efficiency in the EMH and are often grouped as anomalies with discussions of behavioral theories, they are less relevant to investors looking to capitalize on behaviorally based market inefficiencies.
Structural Impediments to Market Efficiency
Professional investors are always looking for ways to persuade potential clients that they can add value and that they can provide a service that is differentiated and unobtainable elsewhere. Interestingly, much of this focus is on company-specific research, and an effort to uncover the latest diamond in the rough. The implication is that hard work, and simply a desire to “dig deep” and get to know a company better, will result in better investment decisions and a clearer understanding of a company. For example, Janus, the mutual fund behemoth notes:
At the core of our investment process is meticulous, hands-on research. When our investment team examines potential investments for our Funds, they don’t just rely on numbers in a balance sheet. They don’t simply talk with a company’s management team. Our portfolio managers and analysts dig deeper, looking for new growth catalysts, innovative marketing ideas and new technologies. They strive to recognize tomorrow’s leaders by getting as close to a company as possible.2
American Funds puts on the rubber gloves and gets to know the company “inside and out”:
In order to determine a security’s true worth, our investment professionals get to know a company inside and out. Today, American Funds operates one of the industry’s most extensive global research efforts.3
Interestingly, Fidelity Investments is concerned with speed. They feel in this electronic age that they get to the “good ideas” faster:
With Fidelity, you can put our size and agility to work for you. We’ve got more than 350 analysts, comprising one of the largest research departments in the industry.
We’ve also set up smaller working groups dedicated to specific regions and sectors, which means the good ideas get to our fund managers faster.4
True, these firms are rather easy targets. They’re three of the largest mutual fund companies in the world, and it’s easy to pick apart marketing materials. However, there is a sense in our business that we can try a little harder, dig a little deeper, and be more thorough in our analysis. The implication is that we just need to look more closely at the companies, that the market efficiency is one of neglect, or undercoverage. This “digging deeper” mentality presumes that the semistrong form of market efficiency described in the EMH doesn’t hold in practice. It implicitly assumes that markets are not incorporating all publicly available information into security prices.
The “digging deeper” mentality speaks to a structural impediment to market efficiency, not a behavioral impediment. As noted previously, structural impediments stem from the structure of a market: lack of participants (liquidity), lack of regulation, or lack of professional investors or analysts. The “digging deeper” mentality relates directly to the “lack of professional investors or analysts,” as it’s presumed that the stock in question has not been thoroughly analyzed. To determine if there is merit to the “digging deeper” mentality, we will look at “neglected” companies as a proxy for this research emphasis. Neglected companies are companies that have fewer professional sell-side analysts covering them, and have been the source of a number of studies that have delved into this topic. In this manner, we can determine whether the “digging deeper” mentality is a suitable construct for establishing a process to identify market opportunities in large capitalization stocks.
To start, let’s set aside the discussion of whether this type of inefficiency would be present in domestic mid- to large-cap stocks, and examine whether there is any validity to the claim in a look at smaller stocks. Why smaller stocks? Because we would expect that there would be less coverage as one moves down the market capitalization spectrum, examining ever-smaller companies ranked in this manner. Market capitalization obviously plays a very large role in determining analyst following: the smaller the stock, the less following by the analyst community. To understand why this is the case, it’s important to understand a problem inherent in managing large sums of money—the immateriality of the smallest stocks.
Larger institutions, in general, see less benefit from smaller stocks. If, for example, I manage a mutual fund with $100 billion in assets, how appealing is the stock of a company with a market capitalization of $50 million. Even outright, full ownership of such a company is going to have a minimal impact on my returns. If a $100 billion fund owned all of the common stock in a company with a $50 million market capitalization, then that stock holding would represent 0.05 percent of the fund’s total holdings. Even if this stock moves higher by 100 percent in a given period, the return effect is going to be very small.
This is not to say that smaller-capitalization stocks don’t have a place in portfolios. However, it is to say that as funds are increasingly successful, or become larger, smaller-capitalization stocks have a less meaningful impact. As a consequence, the marketplace for such investments would be smaller, and the competition for the stock of such companies could conceivably be less. In a related manner, the research community that surrounds smaller-capitalization stocks would be, as expected, smaller, as the size of the investor community interested in such stocks would likely be smaller. And, indeed, this is one of the principal claims put forth by advisors who manage mutual funds in this space: fewer people are looking at these stocks so the stocks themselves are more prone to pricing errors.
Still, it isn’t simply a matter of considering the returns of small-capitalization stocks in relation to larger-capitalization stocks. Indeed, simply looking at analyst coverage may result in the same comparison. There is much that is embodied in return, not the least of which is the risk inherent in owning a smaller enterprise. So, we must back up still further and consider the role that small-cap stocks have in the debate over market efficiency. After a brief discussion of small-cap stocks and market efficiency, I’ll return to a consideration of the lack of analyst following as a source of market opportunity.
Small-cap stocks have a storied and well-researched place in a discussion of market efficiency. When Rolf Banz first noted that “small NYSE firms have had significantly larger risk-adjusted returns than large NYSE firms,”5 he started a quest that continues to have reverberations today. Eugene Fama and Kenneth French famously concluded that neither beta (β), nor earnings-to-price ratios (in effect, an inverted price-to-earnings ratio) add any explanatory power to models that rely on a firm’s size and its book equity to market equity (in essence an inverted price-to-book [P/B] ratio)6. The view of Fama and French was that a company’s size and P/B ratio where all that were needed in order to explain return deviations.
Economists and finance professionals are always attempting to specify risk. We realize that higher-risk investments should have higher returns, but the question remains: why do some firms produce returns that would seem to outpace what we would expect from firms with such a risk profile. So we run regressions and more regressions and look at multivariate models (arbitrage-pricing models) as opposed to univariate models (such as the capital asset pricing model), all in an attempt to discern what is driving stock returns.
But it is hard not to accept that much of what we talk about with regard to a small-firm effect may just be a misspecified estimation of risk. Indeed, in an interesting examination of the size enigma, Jonathan Berk found this to be the case. Berk found that the size enigma (the excess returns that many researchers point to in an examination of small-capitalization common stocks) “results from the measure of firm size—the market value of common equity.”7 When one examines other definitions of size, the resulting difference between the performance of the largest companies and smallest companies becomes much more consistent with views of market efficiency. Table 7.1 is a reproduction of Berk’s data on deciles of New York Stock Exchange (NYSE) stocks from 1967 to 1987, sorted by different measures of size: market value, book value of assets, and sales.
TABLE 7.1 Value of $1 Invested from 1967 to 1987, by Three Different Size Deciles: Market Value of Assets, Book Value of Assets, and Sales
Data Source: Jonathan B. Berk, “Does Size Really Matter?” Financial Analysts Journal 53(5) (1997): 14.
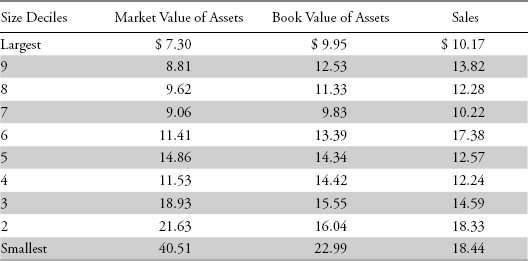
As the data in Table 7.1 reveal, the divergence in return found between the smaller deciles of NYSE stocks and larger deciles diminishes significantly if we use book value of assets or sales as the basis for determining size. Indeed, the return for the very smallest group of the 10 deciles is almost halved in both cases. In Berk’s view, if there are abnormal returns to be had based on a company’s size, then we would see these abnormal returns reflected in rankings using various proxies for size—with market capitalization being one, but sales and book value of assets being others. The implication is that market value is conveying more information that just the firm’s size. Market value is, in this context, also conveying information about risk (through the discount rates implicitly used in calculations of market value). Berk concludes by noting that “the idea that somehow this extra return comes as a ‘free lunch’ is misguided. Firms with low relative market values earn higher returns than others because they are riskier.”
Given my prior skepticism regarding the existence of market efficiency, it’s difficult for me to accept that this explanation reflects reality. Moreover, note that studies of this kind reflect aggregated stock information and do not reflect individual stock performance. Still, it is likely that there is so much wrapped into small firms’ risk that it may just be too complex a relationship for researchers to model with any precision or consistency. The risk inherent in small companies emanates from multiple points, as shown in Figure 7.1.
FIGURE 7.1 Components of Small-Company Stock Risk
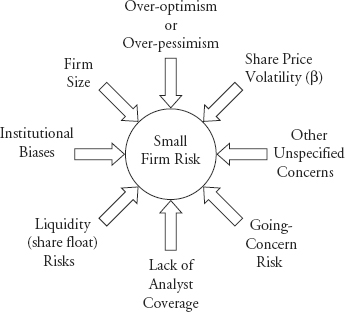
Small-cap stocks should provide higher returns, as they are smaller in size and are more subject in this way to going-concern risks. Moreover, there are likely aforementioned institutional biases that result in higher required rates of return. There are fewer shares trading in the market, and, as will be noted later in this section, there is a reason to expect more return from stocks with this lack of liquidity. Finally, analyst coverage may play a part. So, we know that small-caps should provide a higher return than large-cap stocks for a variety of reasons. Whether it’s an excess, risk-adjusted premium, is likely debatable. However, with these caveats in place, let’s return to a consideration of underfollowed stocks, as an exploitable structural impediment to market efficiency, in order to determine if “digging deeper” will result in better investment opportunities.
As noted previously, there is something enticing about “underfollowed” corners of the market. It appeals to our intuition to believe that we are privy to an opportunity that’s not been “discovered.” Most are familiar with some story or another of someone who got in at the ground floor of an opportunity, or someone who stepped up to invest in a market that had not had significant capital inflows—and in all cases they made an extraordinary amount of money. However, you don’t seem to hear stories about people who lost money in such cases, so there is most likely a significant bias to such anecdotal evidence. Still, that’s neither here nor there; the point is that, intuitively, we want to believe that underfollowed or new markets present significant opportunities. And they may—although, once again, keep in mind that we expect high returns from high-risk ventures.
Also, there is likely a high correlation between stocks that are risky due to factors that are particular to the “new” or “undiscovered” nature of the market and stocks that are “underfollowed.” For example, XYZ Company may not be followed by many analysts because it’s extraordinarily risky, and would not appeal to a wide enough spectrum of investors to merit analysis by a firm. So is the high return that XYZ Company generates the result of inefficient pricing due to a lack of analyst following or is it simply recognition that XYZ Company was close to failing or had a business plan that was more akin to gambling? In spite of my qualifying remarks, let’s consider some of the research that has delved into the investment merits of underfollowed or neglected firms.
Arbel, Carvell, and Strebel, in an examination of 510 firms over a 10-year period (through 1979), found that, regardless of market capitalization, underfollowed, or as the authors describe them, “institutionally neglected” securities, provide a “marked neglected firm affect.”8 However, it’s worth noting that the authors also found that “total risk does increase with the degree of neglect” but insufficiently so to account for the excess returns.
Using data over a 14-year period through 1995, Beard and Sias also sought to determine if there is a “neglect premium.” In their examination of over 7,000 stocks, the authors “found no support for a neglected-firm effect after controlling for the correlation between neglect and capitalization.”9
A different view, however, can be gleaned from research by Doukas, Kim, and Pantzalis. In research examining data from 1980 through 2001, the authors found that the more analysts that cover a particular stock, the lower the future return.10 The presumption presented by the authors is that there are significant agency costs that drive analyst recommendations. Thus, the more recommendations there are for a given stock, the more agency costs that appear to be inherent in said stock. Alternatively, one can surmise that the less coverage for a particular common stock, the more there is a propensity for agency costs to be diminished.
This is, however, distinctly different from saying that the fewer analysts that follow a firm, the more likely it is to trade inefficiently. Indeed, Doukas, Kim, and Pantzalis theorize that just the opposite is true—more analyst coverage equals less efficiency. In their view, the more analysts that cover a stock, the higher the stock price and the lower the going-forward return—this is the inefficiency imposed by agency costs. Their view is not that the less analyst coverage results in opportunities, although their view suggests that less analyst coverage results in higher future returns.
So what are we to make of this? I presume that there is something to “neglected securities,” although it may be that a supposed premium is misspecified risk or fleeting. Moreover, it may be that, since the 1970s, global research capabilities and coverage has expanded appreciably, rendering this anomaly antiquated. Still, it’s worth acknowledging that there are probably research biases, and research does seem to support agency effects as they pertain to highly covered firms. This does not, however, indicate investable market inefficiency, but rather a pitfall to be aware of.
While I’ve delved into the neglected firm effect in some detail, I’ve not touched on some other structural impediments such as lack of regulation or lack of liquidity. My emphasis in this chapter has been related to a “digging deeper” mentality that pervades many investment processes. The return premiums that one can get by investing in illiquid markets and less regulated markets are less germane to the large-cap universe. Moreover, I would argue that one should get a fairly steep return premium when using investment strategies that fish in these ponds.
There are a few take-aways that I think are important to summarize before moving to the next section:
- The notion that if we “dig deeper,” we will find more investment opportunities or information on which to act is directly related to the neglected-firm effect.
- It is debatable whether there is a neglected-firm effect. Some studies indicate that one exists, while other studies point to misspecified risk inherent in owning the stock of smaller enterprises.
- It’s reasonable to expect higher returns for some “structural” impediments—they aren’t really inefficiencies, but reasonable discounts from value that reflect the nature of the market. Liquidity discounts in particular are logical extensions of the risk inherent in owning something one cannot easily sell.
While there may or may not be value in attempting to identify underresearched or underfollowed firms, it’s reasonable to ask if this is even pertinent to a universe comprised of mid- to large-cap or just large-cap stocks. In the next section, I’ll discuss this as well as offer some concluding thoughts.
Pertinence to Large-Cap Universe
It’s worth noting that if there are opportunities for abnormal profits to be had in underfollowed firms, investors are likely not to find such firms in the Standard & Poor’s (S&P) 500 universe or in a universe of the 1,000 largest companies in the United States. Given the number of investment research organizations conducting research on common stocks of all sizes and a regulatory environment that requires broad disclosure of information, it is unlikely that this particular structural impediment affects mid- to large-cap stocks.
If we look at the research coverage and institutional ownership of the 10 largest stocks in the United States, as shown in Table 7.2, we get a sense of sell-side analyst coverage and the extent of institutional research.
TABLE 7.2 10 Largest Companies in the United States—Analyst Coverage11 and Institutional Ownership
Source: Thomson Reuters, www.reuters.com.
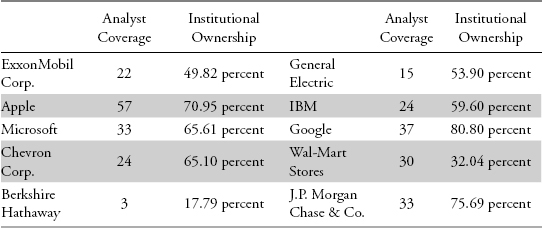
The average number of analysts providing earnings estimate information to Reuters for the top 10 stocks in the domestic (U.S.) stock market is 27.8 (30.6 if we exclude Berkshire Hathaway). Moreover, institutions, thought to be sophisticated investors reporting holdings in Securities and Exchange Commission (SEC) 13-F filings, comprised 57.13 percent of the investors in the 10 largest stocks in the domestic market (61.50 percent if we exclude Berkshire Hathaway). For comparison purposes, we can look at the 10 largest issues, on a market capitalization basis, within the Russell 2000 Index (a benchmark of small-capitalization stocks), as shown in Table 7.3.
TABLE 7.3 10 Largest Companies in the Russell 2000 Index—Analyst Coverage40 and Institutional Ownership
Source: Thomson Reuters, www.reuters.com.
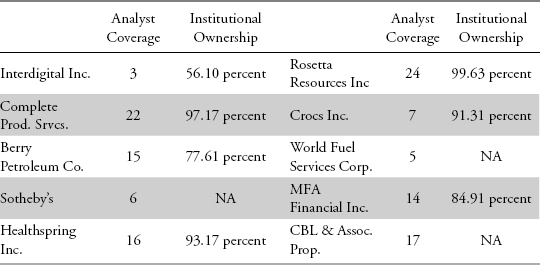
The average number of analysts providing earnings estimate information to Reuters for the top 10 stocks in the Russell 2000 Index is roughly half of the number cited previously for the largest stocks (at 12.9). The average institutional ownership for the 7 stocks for which information is available is 85.70 percent, a surprisingly large number, in comparison to institutional ownership of the largest companies.
Institutional ownership is revealing, as it quantitatively represents the degree of non-sell-side analyst research being conducted on a firm. It’s worth considering that in addition to professional research coverage on the part of brokerage firms and large Wall Street research organizations (that provide estimates to Reuters and other consensus data providers), countless money managers, mutual fund research groups, and hedge funds also examine and research companies of all sizes. While sell-side analysts that report estimates to consensus data providers are important intermediaries that impact the broader investment community’s assessment of a given company’s merits, these sell-side analysts are not the only analysts investigating and analyzing common stocks. Money managers, mutual fund managers, hedge fund managers and the like, have much more “skin in the game” in terms of analysis, as their work results in actionable recommendations. The notion that stones are being left unturned is likely antiquated at this point in history. Even small-cap stocks are looked at by dozens—if not hundreds—of analysts, looking through SEC 10-Qs and 10-Ks in an effort to uncover information that may provide an edge. Thus, as small-capitalization stocks have become a larger component in institutional portfolios, it’s likely that more research is being conducted on this subset of the market. Indeed, as a proportion of outstanding shares for any given firm, the institutional ownership percentages shown here seem to indicate that there is a disproportionate interest in smaller firms—maybe institutional investors are actually looking at small-capitalization firms more intently than they’re looking at larger enterprises. Indeed, to this end, it may not be surprising that as time has gone by, studies looking for a neglected-firm effect seem to show no evidence that one exists. An alternative explanation to the institutional ownership percentages shown earlier could concern differences in types of companies that larger enterprises represent. It could be that employees account for a larger proportion of large-cap company investors, as these firms have likely been around a longer time than smaller companies. Or it could be that if noninstitutional investors are to hold individual common stocks of any kind, they hold the common stock of big companies. I think in the end, however, one can safely conclude that the neglected-firm effect is not likely present in large-cap stocks.
Also, I don’t believe the recently passed financial crisis is an outlier in this assessment. While much has been made of the risk that large banks took on during the financial crisis, the largest issue that continues to affect valuation is the assessment of underlying values for residential housing (either directly in underwriting or indirectly in the valuation of securities tied to real estate). There were two main underlying assumptions that were very prone to behavioral biases that drove both underlying valuations and the ultimate solvency of some banks: overoptimism with regard to real estate values and an underestimation of the volatility of derivative securities tied to residential real estate. Estimates for both of these factors were inappropriately based on a historical record of price changes (in residential real estate or derivative bonds), either exclusively or overly weighted as a probability. The historical record indicated that prices were more stable than they ultimately turned out to be. Success in investing in banking stocks during this time period was not predicated on finding a smoking gun in bank 10-Ks. Nor was it due to a lack of investigation on the part of analysts. In short, representativeness biases likely played a much larger role in errors in bank valuation than did any other factor related to the analysis of this industry.
Unfortunately, investors often organize their processes to identify structural impediments, whether they are likely present or not. This is true of a number of large-cap managers as well. Doubly unfortunate is the fact that many managers strive to achieve their goal of identifying “gems” among the largest issues by focusing on the highest-growth companies where uncertain attributes such as near-term growth require both outsized abnormal growth rates and overly long abnormal growth duration periods. It’s not surprising that the two stocks that have the most analyst coverage are Apple and Google. Both of these stocks have had extraordinarily high growth rates in sales and cash flow in recent years. Given their size in the market, implicit within their valuations are continued track records of growth or high margins. While I’ll delve into the problems associated with these short-term growth characteristics in Chapter 9, they are prime scenarios in which an analyst is able to purport to “dig deeper.” As an aside, there is a behavioral element to this tendency on the part of analysts to claim expertise in the most uncertain of situations. Clearly, there is a significant amount of hubris in those who believe that they can identify information that many, many others cannot. In truth, they simply believe they have the best crystal ball that can see the furthest into the future.
This is not to say that market opportunities don’t exist in small-capitalization stocks, illiquid markets, underfollowed securities, or more lightly regulated markets. Also, the behavioral inefficiencies discussed in Chapter 5 and expanded on in the next two chapters, are likely magnified by some of these structural impediments. However, it’s disingenuous to say that anomalies or opportunities for profit exist due to a stock’s simply being small in size or underfollowed. There is a lot going on when it comes to how the market sets prices, and there are a lot of investors looking at stocks of all sizes. Much of what we consider to be opportunities are simply cases where other factors are at work—illiquidity or more risk, for example.
If we presume that research pays off, then we need to determine why markets are inefficient and what we should strive to capitalize on.
Over the course of the past three chapters, I’ve considered market inefficiencies from two different perspectives:
1. The Behavioral View: Behavioral views of market opportunities are not relevant to the EMH, but are a rejection of the Fama-Freidman theories that comprise the conventional view of market efficiency.
2. The Conventional View: The conventional view of market efficiency concerns structural impediments to an efficient market and is a rebuttal of various forms of the EMH.
While preceding chapters have made my thoughts on the behavioral view clear, the point of this chapter is that structural impediments are not as fertile grounds as one might expect. The conventional view of market inefficiencies is a flawed view. From a rationale standpoint, when looking for reasons why a company may be selling at a discount from intrinsic value, it’s likely not the case that such deviations are due to a lack of following in the sell-side investment community. It’s also not likely that it’s simply due to liquidity or the market in which the company is traded.
Still, it’s a part of the American spirit to believe that research can be more exhaustive and that little “gems” are out there to be uncovered. Do these exist? The research on this topic would seem to indicate that they probably do not exist in the realm of mid- to large-cap stocks. If we presume that we can think better, dig deeper, and do a better job at modeling a valuation, it would follow that underfollowed stocks would present the best opportunities to capitalize on these abilities. Once again, research seems to indicate that underfollowed stocks don’t provide a fertile ground for uncovering mid- to large-cap bargains.
Moreover, when one examines a mid- to large-cap manager’s process, hopefully one concludes that strategies that claim to identify opportunities by “digging deeper” are misguided. This is not to say that managers and analysts shouldn’t thoroughly research a company. On the contrary, fundamental analysis, with a concerted effort to unearth all of a company’s skeletons and illnesses, is extraordinarily important. However, if one is not taking into account the myriad ways in which one’s decision making (as well as others) can be skewed or prone to errors, then one’s research is missing the key element to mispricing.
Additionally, there is a corollary that is more relevant to this book. Often, it is presumed that mid- to large-cap stocks are not fertile grounds for stock picking, as they generally don’t lack for research coverage, are very liquid, and in the United States have a number of regulations that ensure quick and complete dissemination of information. Much of the research pertaining to underfollowed common stocks, while not pointing to a source of investment opportunities, also doesn’t disqualify any group (such as large-cap common stocks).
So, if we aren’t looking for underresearched or illiquid stocks, then what should we be looking for? The two chapters that preceded this chapter point us in a more logical direction. To this end, in Chapters 8 and 9 we’ll look at how we can shape our investment process to uncover value in mid- to large-cap stocks. Understanding our innate behavioral biases plays a large role, as a philosophical foundation on which to consider the assumptions that underlie valuation.
Appendix: Underexplained Market Phenomena
There is no guarantee of profit in any trading or investing heuristic. However, I would assert that having an understanding of why something may be mispriced in the market does much to improve one’s chances of profiting from it. In terms of practicality, the least actionable group of market anomalies are ones that I refer to as underexplained phenomena. These market anomalies are generally grouped with behavioral theories as they relate to the inefficiency of markets. While they do undermine the weak form of the EMH, they are less understood and don’t have direct behavioral theories tied to their occurrence. Moreover, what we generally find is that many of these market anomalies are inconsistent and are not profitable, after considering transaction costs.
Still, in an effort to offer a broad understanding of market opportunities and market inefficiency, I think it would be a disservice to simply ignore the fact that market anomalies exist. While I’ll not spend too much time on this topic, hopefully one will come away with a basic understanding of what anomalies to efficient market pricing exist, and their relevance or irrelevance to the identification of actionable market opportunities.
Many of these anomalies take the form of calendar or seasonal effects. While it is often the case that there are researchers that posit a theory to explain these inefficiencies, they are often not very well explained. Moreover, they also appear to be largely not very actionable. The anomalies are not consistent from year to year and the magnitudes of price differentials (from expectations) tend to be too small to take action on and profit from. Still, they appear frequently enough to pose a challenge to a strict acceptance of market efficiency—and also, I would add, the weak form of the EMH.
Calendar effects, also known as seasonal effects, were first identified by academic researchers in the 1970s and 1980s. While some of these effects seem to be based upon fundamentals or the structure of our society, others seem rather spurious and possibly the result of data mining.
As early as 1980, Kenneth French found that “although the average return for the other four days of the week was positive, the average return for Monday was significantly negative . . . ” for a time series that covered 1953 through 1977. While French noted that the “persistently negative returns for Monday appear to be evidence of market inefficiency”; he concedes that a trading strategy based upon these findings would “not have been profitable because of transactions costs.”12
Similarly, examining 90 years worth of Dow Jones Industrial Average data, Lakonishok and Smidt (1988) confirmed French’s findings regarding turn-of-the-week effects, but also found that preholiday rates of return for their data set were generally two to five times larger than preweekend rates of return.13
It’s worth noting here that the preceding effects, while present in studies undertaken with two different data sets (the S&P 500 in the case of French and the Dow Jones Industrial Average [DJIA] in the case of Lakonishok and Smidt), provide evidence but no underlying theory. It may be that there is a rational explanation that explains these two anomalies, or it may be that there is an irrational explanation that explains these anomalies.
I do know that my own spirit brightens around holidays, and one is often disheartened to see the weekend come to an end. The weekend always seems to brighten people’s moods, as people look forward to weekend activities and leisure. Alternatively, as the weekend comes to a close, one’s mood would likely darken. Moreover, various holidays can be festive and will often put individuals into a mood that is much more optimistic and euphoric than one finds at other times in the year. Could it be that our mood, shaped by our subconscious appreciation of holidays and leisure, is leading us to investing or trading activity that reflects a festive spirit rather than fundamentals? I think it is likely the case, as I’ve seen it in my own attitude and the attitudes of others. However, Burton Malkiel, who often critiques market anomalies, correctly identifies the primary difficulty in fashioning a strategy that capitalizes on these types of anomalies, when he notes that the “general problem with these predictable patterns or anomalies . . . is that they are not dependable from period to period.”14 So, it may be that a pattern exists, but the ability to consistently take advantage of the opportunities is likely not sufficient to warrant an investment strategy.
Finally, I think it’s worth considering one other stock-price-related anomaly that seems to persist in a fairly regular fashion: the January effect. The January effect, first identified by Rozeff and Kinney15 posits that stock returns in January are materially higher than returns in other months. Looking at a data series on U.S. stocks that spanned the period 1904 to 1974, Rozeff and Kinney calculated that returns in January averaged 3.5 percent, while returns for other months averaged 0.5 percent. While some determined that this pattern was a rationale reaction to tax loss selling (Reinganum16), others conducting research in countries with no capital gains taxes (such as Japan and Canada prior to 1972), identified a January effect as well. This effect was reexamined in 2006 by Mark Haug and Mark Hirschey, who concluded that the “January effect is a real and continuing anomaly in stock-market returns, and one that defies easy explanation.”17
While I’ve discussed a handful of market anomalies, this has hardly been an exhaustive enumeration of underexplained phenomena. One could examine weather-related effects (Tufan and Hamarat18), sports-based effects (Edmans, Garcia, and Norli19), daylight savings effects (Kamstra, Kramer, and Levi20) and others. However, outside of some of the more behavioral-oriented explanations that I posited previously, these types of anomalies are interesting only insofar as they persist in an environment that is so-often considered efficient. In the end, the main problems that I have with anomalies that I’ve grouped under the term underexplained is that they provide very little in way of exploitable return and/or they are, as Malkiel noted, a bit undependable.
Finally, as a practitioner, the ability to explain why a security or industry or sector or market is mispriced is paramount. Within the sea of market efficiency, why is this group or stock adrift? There must be a reason why we question market efficiency, and my guiding principle with regard to approaching stock research is to assume at the outset that the market has efficiently priced a stock. If a stock is mispriced, we must at the very least have a reason for believing that the market is in error. In the absence of even a crude understanding of why a company is undervalued (or overvalued), we lose the ability to differentiate between misunderstood situations and situations that may present opportunities.
As research analysts attempting to identify exploitable market opportunities, it behooves us to understand the nature of market inefficiencies. While many of the anomalies I’ve described have no solid explanation, differentiating between inefficiencies that result spuriously and those that result from behavioral errors helps one to understand the broader view of market efficiency.
1. Eugene F. Fama, “Efficient Capital Markets: A Review of Theory and Empirical Work,” Journal of Finance 25(2), Papers and Proceedings of the Twenty-Eighth Annual Meeting of the American Finance Association New York. December 28–30, 1969 (May 1970): 383–417.
2. Janus.com, “Rigorous Research,” https://ww3.janus.com/Janus/Retail/staticpage?jsp=jsp/GettingStarted/RigourousResearch.jsp.
3. Americanfunds.com, “What Makes Us Different,” https://americanfunds.com/about/different/index.htm.
4. Fidelity.com, “Why Fidelity Mutual Funds,” http://personal.fidelity.com/products/funds/mutual_funds_overview.shtml.cvsr.
5. Rolf W. Banz, “The Relationship between Return and Market Value of Common Stocks,” Journal of Financial Economics 9 (1981): 16.
6. Eugene F. Fama and Kenneth R. French, “The Cross-Section of Expected Stock Returns,” Journal of Finance 47(2) (1992): 427–465.
7. Jonathan B. Berk, “Does Size Really Matter?,” Financial Analysts Journal 53(5) (1997): 17.
8. Avner Arbel, Steven Carvell, and Paul Strebel, “Giraffes, Institutions, and Neglected Firms,” Financial Analysts Journal 39(3) (May/June 1983): 58.
9. Graig G. Beard and Richard W. Sias, “Is There a Neglected-Firm Effect?” Financial Analysts Journal 53(5) (September/October 1997): 22.
10. John A. Doukas, Chansog Kim, and Christos Pantzalis, “The Two Faces of Analyst Coverage,” Financial Management 34 (2005): 99–125.
11. Analyst coverage is the maximum number of analysts providing estimates for one of a number of consensus estimates covered by Thomson Reuters. These consensus estimates could be for quarter-ending sales, year-ending sales, quarter-ending earnings, or year-ending earnings. The presumption is that even if an analyst is not providing all of the estimates covered by Thomson Reuters, the largest number for any given data point, gives us a rough estimate of the total number of analysts covering the stock.
12. Kenneth R. French, “Stock Returns and the Weekend Effect,” Journal of Financial Economics 8 (1980): 68.
13. Josef Lakonishok and Seymour Smidt, “Are Seasonal Anomalies Real? A Ninety-Year Perspective,” Review of Financial Studies 1(4) (1988): 421.
14. Burton G. Malkiel, “The Efficient Market Hypothesis and Its Critics,” Journal of Economic Perspectives 17(1) (2003): 59–82.
15. Michael S. Rozeff and William R. Kinney, Jr., “Capital Market Seasonality: The Case of Stock Returns,” Journal of Financial Economics 3 (1976): 379–402.
16. Marc R. Reinganum, “The Anomalous Stock Market Behavior of Small Firms in January: Empirical Tests for Tax-Loss Selling Effects,” Journal of Financial Economics (June 1983): 89–104.
17. Mark Haug and Mark Hirschey, “The January Effect,” Financial Analysts Journal 62(5) (2006): 86.
18. Ekrem Tufan and Bahattin Hamarat, “Do Cloudy Days Affect Stock Exchange Returns: Evidence from Istanbul Stock Exchange,” Journal of Naval Science and Engineering 2(1) (2004): 117–126.
19. Alex Edmans, Diego Garcia, and Oyvind Norli, “Sports Sentiment and Stock Returns,” Journal of Finance 62(4) (2007): 1967–1998.
20. Mark Kamstra, Lisa Kramer, and Maurice Levi, “Losing Sleep at the Market: The Daylight Saving Anomaly,” American Economic Review 90(4) (September 2000): 1005–1011.