
Chapter Seven
The Grand Illusion
Surprise! The Returns Reported by Mutual Funds Are Rarely Earned by Mutual Fund Investors.
IT IS GRATIFYING THAT industry insiders such as Fidelity’s Peter Lynch, former Investment Company Institute (ICI) chairman Jon Fossel, Mad Money’s James Cramer, and AQR’s Clifford Asness agree with me, as you may recall from Chapter 4. The returns earned by the typical equity mutual fund are inevitably inadequate relative to the returns available simply by owning the stock market through an index fund based on the S&P 500.
But the idea that fund investors themselves actually earn 100 percent of those inadequate mutual fund returns proves to be a grand illusion. Not only an illusion, but a generous one. The reality is considerably worse. For in addition to paying the heavy costs that fund managers extract for their services, the shareholders pay an additional cost that has been even larger. In this chapter, we’ll explain why.
Fund managers typically report the traditional time-weighted returns calculated by their funds—the change in the asset value of each fund share, adjusted to reflect the reinvestment of all income dividends and any capital gains distributions. Over the past 25 years, the average mutual fund earned a return of 7.8 percent per year—1.3 percentage points less than the 9.1 percent return of the S&P 500. But that fund return does not tell us what return was earned by the average fund investor. And that return turns out to be far lower.
Hint: Money flows into most funds after good performance, and goes out when bad performance follows.
To ascertain the return earned by the average fund investor, we must consider the dollar-weighted return, which accounts for the impact of capital flows from investors, into and out of the fund.1 (Hint: Money flows into most funds after good performance is achieved, and goes out when bad performance follows.)
When we compare traditionally calculated fund returns with the returns actually earned by their investors over the past quarter century, it turns out that the average fund investor earned, not the 7.8 percent return reported by the average fund, but 6.3 percent—an annual return fully 1.5 percentage points per year less than that of the fund.
The index fund investor, too, was enticed by the rising market, but still earned a return of 8.8 percent, only 0.2 percentage points short of the fund return itself.
Yes, during the past 25 years, while the S&P 500 Index was providing an annual return of 9.1 percent and the average equity fund was earning an annual return of 7.8 percent, the average fund investor was earning only 6.3 percent a year.
The dual penalties of costs and investor behavior.
Compounded over the full period, the 1.5 percent annual penalty incurred by the average fund because of costs was huge. But the dual penalties of faulty timing and adverse selection made it even larger.
Exhibit 7.1 shows that $10,000 invested in a low-cost S&P 500 index fund in 1991 earned a nominal (before-inflation) profit of $77,000. The average equity fund earned a profit of just $55,500—72 percent of what was there for the taking. The compound return earned by the average fund investor tumbled to $36,100, less than 50 percent of the $73,100 return earned by investors in the simple index fund. These penalties add up!
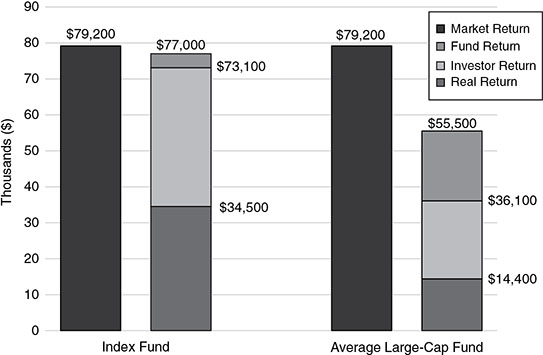
EXHIBIT 7.1 S&P Index Fund versus Average Large-Cap Fund: Profit on Initial Investment of $10,000, 1991–2016
When we take inflation into account, the value of all those dollars tumbles. With inflation that averaged 2.7 percent annually, the index fund real return drops to 6.2 percent per year, but the real return of the average fund investor plummets to just 3.6 percent—a cumulative $34,500 of real value for the index fund versus just $14,400 for the fund investor. Truth be told, it’s hard to imagine such a staggering gap. But the facts are the facts.
While the data clearly indicate that fund investor returns fell well short of fund returns, there is no way to be precise about the exact shortfall.2 But the point of this examination of the returns earned by the stock market, the average fund, and the average fund owner is designed not for precision, but for direction.
Whatever the precise data, the evidence is compelling that (1) the long-term returns on equity funds lag the stock market by a substantial amount, largely accounted for by their costs; and (2) the returns earned by fund investors lag the market by more than double that substantial lag.
Inflamed by heady optimism and greed, and enticed by the wiles of mutual fund marketers, investors poured their savings into equity funds at the bull market peak.
What explains this second shocking lag? Simply put, counterproductive market timing and adverse fund selection. First, shareholders investing in equity funds paid a heavy timing penalty. They invested too little of their savings in equity funds when stocks represented good values during the 1980s and early 1990s. Then, inflamed by the heady optimism and greed of the era and enticed by the wiles of mutual fund marketers as the bull market neared its peak, they poured too much of their savings into equity funds.
Second, they paid a selection penalty, pouring their money not only into the market at the wrong time, but into the wrong funds—funds that had provided outstanding results in the past, but, as we shall soon see, tumbled thereafter. Why? Simply because high fund returns tend to revert toward or below the mean of average returns. (We’ll discuss reversion to the mean—RTM—in Chapter 11.) With both counterproductive timing and poor fund selection, investors simply fail to practice what common sense would have told them.
When counterproductive investor emotions are magnified by counterproductive fund industry promotions, little good is apt to result.
This lag effect has been amazingly pervasive. For example, the returns provided to investors from 2008 to 2016 by 186 of the 200 largest equity funds were lower than the returns that they reported to investors!
This lag was especially evident during the “new economy” craze of the late 1990s. Then, the fund industry organized more and more funds, usually funds that carried considerably higher risk than the stock market itself, and magnified the problem by heavily advertising the eye-catching past returns earned by the hottest funds.
As the market soared, investors poured ever larger sums of money into equity funds. They invested a net total of only $18 billion in 1990 when stocks were cheap, but $420 billion in 1999 and 2000, when stocks were substantially overvalued (Exhibit 7.2).
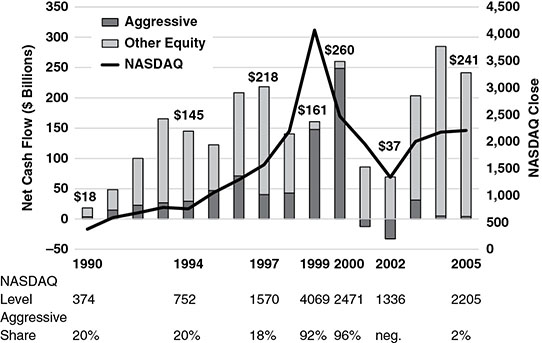
EXHIBIT 7.2 The Timing and Selection Penalties: Net Flow into U.S. Equity Funds
What’s more, investors also overwhelmingly chose “new economy” funds, technology funds, and the hottest-performing growth funds, to the virtual exclusion of more conservative value-oriented funds. Whereas only 20 percent of their money had been invested in risky aggressive growth funds in 1990, investors poured fully 95 percent into such funds as those fund returns peaked during 1999 and early 2000. After the bubble burst, when it was too late, investor purchases dried up to as little as $36 billion in 2002, just before the market hit bottom. They also pulled their money out of growth funds and turned, too late, to value funds.
The underwhelming performance of fund investors returned during the financial crisis of 2008–2009 and the subsequent recovery. Fund investors have been chasing past performance since time immemorial, allowing their emotions—perhaps even their greed—to overwhelm their reason. Many investors reacted strongly—and ultimately counterproductively—to the sharp downturn in the markets during the financial crisis by getting out of stocks near the market’s nadir. Many of those investors missed part or even all of the subsequent recovery, a cumulative increase by the end of 2016 of some 250 percent from the low.
Investor emotions plus fund industry promotions equals trouble.
The fund industry itself has compounded the problem by playing on investors’ emotions, bringing out new funds to meet the fads and fashions of the day (often supercharged and speculative), and then aggressively advertising and marketing them. It is fair to say that when counterproductive investor emotions are played upon by counterproductive fund industry promotions, little good is apt to result.
The fund industry will not soon give up on its new products or its promotions, and it will take time (and first-hand experience) by investors with counterproductive short-term behavior to gain wisdom. But the intelligent investor will be well advised to heed not only the message in Chapter 4 about minimizing expenses, but the message in this chapter about removing emotions from the equation—that is, about investors improving their short-term, market-oriented behavior.
The beauty of the index fund, then, lies not only in its low expenses, but in its elimination of all those tempting fund choices that promise so much and deliver so little. Focusing on the long term, doing one’s best to ignore the short-term noise of the stock market, and eschewing the hot funds of the day, the index fund can be held through thick and thin for an investment lifetime. Emotions need never enter the equation. The winning formula for success in investing is owning the entire stock market through an index fund, and then doing nothing. Just stay the course.