
Chapter Nine
When the Good Times No Longer Roll
It’s Wise to Plan on Lower Future Returns in the Stock and Bond Markets.
REMEMBER THE UNFAILING PRINCIPLE described in Chapter 2: In the long run it is the reality of business—the dividend yields and earnings growth of corporations—that drives the returns generated by the stock market. Paradoxically, however, if we simply consider only the 43 years since I founded Vanguard on September 24, 1974, the returns provided by the stock market exceeded the returns earned by businesses by among the highest margins in any period of such length in the entire history of the U.S. market.
Specifically, the dividend yields and earnings growth of the public corporations that compose the Standard & Poor’s 500 Index created an investment return of but 8.8 percent during that period (dividend yield 3.3 percent, earnings growth 5.5 percent), yet the total annual return was 11.7 percent. (See Exhibit 9.1.)
Fully 2.9 percentage points of the market’s return—fully 25 percent of the total—were accounted for by speculative return. That return reflected an upward revaluation of stocks by investors, as the price/earnings multiple more than tripled, from 7.5 times earnings to 23.7 times. (The average decade-long contribution of speculative return to the market’s total annual return since 1900 has been but 0.5 percentage points, only about one-fifth of the bounty that we investors have enjoyed since 1974.)

EXHIBIT 9.1 Cumulative Investment Return and Speculative Return, 1900–2016
The staggering cumulative effects of compounding returns.
The cumulative effects of these compounding returns are staggering (Exhibit 9.1). Over that 43-year period, an initial investment of $10,000 would have grown to just under $1,090,000. Of that million-dollar-plus accumulation, about $270,000 can be attributed to speculative return, while the remaining $820,000 was due to dividends and earnings growth.
Yes, that remarkably low P/E multiple of 7.5 times in September 1974 came at the bottom of a 50 percent tumble in the stock market. It reflected deep pessimism, excessive fear, and widespread worry among investors. As 2017 begins, it remains to be seen whether the current valuation of 23.7 times earnings represents some combination of unbridled optimism, excessive confidence, exuberance, and hope, or a new reality.
Both common sense and humble arithmetic tell us that we’re facing an era of subdued returns in the stock market.
On balance over more than four decades, equity investors have enjoyed extraordinary returns. But since speculative return was responsible for fully 25 percent of the market’s annual return during this period, it is unrealistic to expect P/E multiple expansion to repeat that performance, nor to give much, if any, momentum to the investment returns earned by stocks in the decade ahead. Common sense tells us that compared to the long-term annual nominal return of 9.5 percent since 1900, we’re again facing an era of subdued returns in the stock market (Exhibit 9.2).
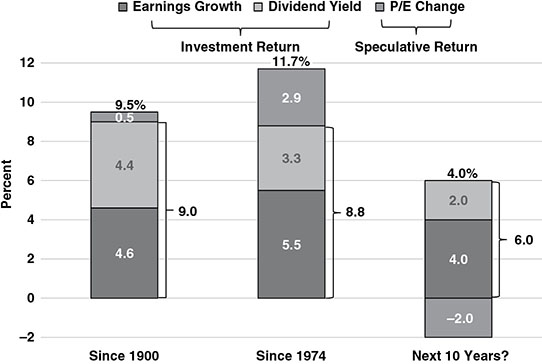
EXHIBIT 9.2 Total Return on Stocks, Past and Future
I say again because in the first (2007) edition of this book, I used the same title for this chapter, “When the Good Times No Longer Roll.” There, I set reasonable expectations for the return on stocks over the 2006–2016 decade at 7 percent per year. The actual return on the S&P 500 was almost identical: 6.9 percent. (Hold the applause. I underestimated speculative return by about the same amount as I overestimated investment return.)
The arithmetic behind the caution: the sources of stock returns.
Why the continued caution? Simply because the sources of stock returns tell us to be cautious. Recall Lord Keynes’s warning cited in Chapter 2, that “It is dangerous . . . to apply to the future inductive arguments based on past experience, unless one can distinguish the broad reasons for why past experience was what it was.” In that chapter, I described three sources of return on stocks: the initial dividend yield and the earnings growth (together, “investment return”), and changes in the P/E multiple (“speculative return”).
Future annual investment return—6 percent?
Let’s consider the sources of return as they appear today. First, today’s dividend yield on stocks is not 4.4 percent (the historical rate), but 2 percent. Thus we can expect a deadweight loss of 2.4 percentage points per year in the contribution of dividend income to investment return.
As for corporate earnings, let’s assume that they will continue to grow (as, over time, they usually have) at about the pace of our economy’s expected nominal growth rate of 4 percent to 5 percent per year in gross domestic product (GDP) over the coming decade, below our nation’s long-term nominal growth rate of 6 percent plus.
If that expectation proves to be reasonably accurate, then the most likely expectation for the investment return on stocks would be in the range of 6 percent to 7 percent. I’ll be cautious and project an annual investment return averaging 6 percent.
Future annual speculative return—minus 2 percent?
Now consider speculative return. As 2017 began, the price/earnings multiple on stocks was 23.7 times. That figure is based on the past year’s reported earnings of the S&P 500. If the P/E ratio remains at that level a decade hence, speculative return would neither add to nor subtract from that possible 6 percent investment return.
Wall Street strategists generally prefer to calculate the P/E using projected operating earnings for the coming year, rather than past reported earnings. Such operating earnings exclude write-offs for discontinued business activities and other bad stuff, and projections of future earnings that may or may not be realized. Using projected operating earnings, Wall Street’s P/E ratio is only 17 times. I would disregard that projection.
My guess—an informed guess, but still a guess—is that, by decade’s end, the P/E ratio might ease down to, say, 20 times or even less. Such a revaluation would reduce the market’s return by about 2 percentage points per year, resulting in an annual rate of return of 4 percent for the U.S. stock market.
If you don’t agree with my 4 percent expectation, “do it yourself.”
You don’t have to agree with me. If you think today’s P/E multiple of 23.7 will be unchanged a decade hence, speculative return would be zero, and the investment return would represent the market’s entire return. If you expect the valuation to rise to 30 times (I don’t), add 1.5 percentage points, bringing the annual return on stocks to 7.5 percent. If you think the P/E will drop to 12 times, subtract 7 percentage points, reducing the total nominal return on stocks to minus 1 percent.
My point is that you don’t need to accept my cautious scenario. Feel free to disagree. Project the coming decade for yourself by applying the current dividend yield (there’s no escaping that!), your own rational expectations for earnings growth, and your own view of the P/E ratio in 2027. That total will represent your own reasonable expectation for stock returns over the coming decade.
The source of bond returns—the current interest yield.
Developing reasonable expectations for future returns on bonds is even simpler than for stocks. Why? Because while stock returns have the three sources identified earlier, bond returns have a single dominant source: the interest rate prevailing when the bonds are purchased.
Yes, the current yield on a bond (or a portfolio of bonds) represents the expected return if the bond is held for the long term. Historically, the initial yield has proved to be a reliable indicator of future returns. In fact, fully 95 percent of the decade-long returns on bonds since 1900 have been explained by the initial yield (Exhibit 9.3). Of course!

EXHIBIT 9.3 Initial Bond Yields and Subsequent Returns
Why is this so? Because the issuer of a 10-year bond is pledged to repay its initial principal at 100 cents on the dollar at the end of a decade, and for investment-grade bonds, that promise has usually been fulfilled. So virtually all of its return is derived from interest payments. Yes, in the interim the market value of the bond will vary with changing levels of interest rates. But when the bond is held to maturity, those fluctuations don’t matter.
Exhibit 9.3 depicts the remarkably close relationship between the initial yield on the 10-year U.S. Treasury note and its subsequent 10-year return. Note the long cycle of its yields (and subsequent returns) from a low of 0.6 percent in 1940 to a high of 14.0 percent (amazing!) in 1981, then falling all the way back to 1.8 percent in 2012, before rebounding slightly to 2.2 percent in mid-2017.
The Treasury note carries minimal (or less!) risk of repayment, that is, the risk that the principal value of the bond will not be repaid when the bond matures. So its current yield of 2.2 percent significantly understates the future returns on the broad bond market, because corporate bonds assume higher repayment risk. So I’ll develop my expectation for future returns on bonds based on a portfolio consisting of 50 percent U.S. Treasury notes now yielding 2.2 percent and 50 percent long-term investment-grade corporate bonds now yielding 3.9 percent. This combination produces a 3.1 percent yield on a broadly diversified bond portfolio. So, reasonable expectations suggest an annual return of 3.1 percent on bonds over the next decade.
During the coming decade, the returns on bonds, like the returns on stocks, are likely to fall well short of historical norms (Exhibit 9.4). Over the long sweep of history since 1900, the annual return on bonds has averaged 5.3 percent. During the modern era since 1974, the return on bonds has been far higher, averaging 8.0 percent annually. That return has been driven largely by the long, steady bull market that began in 1982 as interest rates tumbled and prices rose.
With lower returns are in prospect for stocks and bonds, balanced stock/bond portfolios will follow suit.

EXHIBIT 9.4 Total Return on Bonds, Past and Future
Combining those reasonable expectations for future returns on stocks and bonds into a balanced portfolio consisting of 60 percent stocks and 40 percent bonds would give the expectation of a gross nominal annual return of 3.6 percent over the coming decade, before the deduction of investment costs. Of course, that expectation may prove to be too low or too high. But it may help to provide a realistic basis for your financial planning.
In any case, that 3.6 percent expected annual return would fall well below the long-term average for such a balanced portfolio of 7.8 percent and the remarkable 10.2 percent return since 1974 (Exhibit 9.5).

EXHIBIT 9.5 Total Return on 60/40 Stock/Bond Balanced Portfolio, Past and Future
When we convert these nominal annual returns into real (after-inflation) returns, we see a smaller, yet still substantial gap: historical, 4.8 percent; since 1974, 6.3 percent; coming decade, maybe 1.6 percent. (See the table at the base of Exhibit 9.5.)
If rational expectations suggest a future gross annual return of 3.6 percent for a balanced fund, what does this imply for the net return to owners of the balanced fund?
In mid-2017, let’s assume that 3.6 percent return is a rational expectation (not a prediction!) for annual returns on a balanced portfolio during the coming decade. But remember, please, that investors as a group can’t (and don’t) capture market returns in their entirety. Why? Simply because investing in the stock and bond markets through actively managed funds carries an estimated annual cost of at least 1.5 percent.
To calculate the likely return for the average actively managed balanced mutual fund in such an environment, simply remember the humble arithmetic of fund investing: nominal market return, minus investment costs, minus an assumed inflation rate of 2 percent (slightly above the rate that the financial markets are now expecting over the coming decade) equals just 0.1 percent per year. Here’s the arithmetic:
| Nominal gross return | 3.6% |
| Investment costs | –1.5 |
| Nominal net return | 2.1% |
| Inflation | –2.0 |
| Real annual return | 0.1% |
It may seem absurd to project a return of almost zero for the typical balanced fund. But, if you will recall the lesson learned in Chapter 7, the average balanced fund investor will earn even less. The numbers are there.
By way of comparison, in an environment of lower returns, a low-cost balanced index fund with annual costs of only 0.1 percent could provide a real annual return of, say, 1.5 percent—significantly higher than an actively managed fund. Not great, but at least positive, and almost infinitely better.
Unless the fund industry begins to change, the typical actively managed fund appears to be a singularly unfortunate investment choice.
The fact is that lower returns harshly magnify the relentless arithmetic of excessive mutual fund costs. Why? Equity mutual fund costs of 2 percent combined with inflation of 2 percent would consume “only” about 25 percent of a 15 percent nominal return on stocks and “only” 40 percent of a 10 percent return. But costs and inflation would consume (I hope you’re sitting down!) 100 percent of the 4 percent nominal return on stocks that rational expectations suggest.
Unless the fund industry begins to change—by sharply reducing management fees, operating expenses, sales charges, and portfolio turnover (and its attendant costs)—high-cost actively managed funds appear to be a singularly unfortunate choice for investors.
A zero real return achieved by the average active equity fund should be unacceptable. What can equity fund investors do to avoid being trapped by these relentless rules of humble arithmetic? How can they avoid the financial devastation that follows when high investment costs are applied to future returns that are likely to be well below long-term norms?
Five ways to avoid financial devastation. Only two work.
Here are five tempting options for improving your investment returns:
- Select a very low-cost index fund that simply holds the stock market portfolio.
- Select funds with rock-bottom costs, minimal portfolio turnover, and no sales loads.
- Select winning funds on the basis of their past long-term records.
- Select winning funds on the basis of their recent short-term performance.
- Get some professional advice in selecting funds that are likely to outpace the market.
Which option will you choose? Hint: The odds are high that the first two options will virtually assure your investment success in capturing whatever returns that our financial markets prove to provide. The odds of success for the final three options are pitiful. We’ll discuss the limitations of each in the following three chapters.