
Chapter 5. Elements of BI Solutions: The End User Experience
I listed components of most BI solutions earlier, but here I want to delve a bit deeper into each of them in the context of personal experience and how an end user is affected or influenced by each. This chapter is aimed primarily at the new or novice end user. If you have had extensive hands-on BI experience, this is probably a bit rudimentary for you.
If you support end users or are responsible for training them, it may help to have them read this chapter. Setting the proper expectations and goals to attain realistic skills are paramount to success. Allowing naïve assumptions to run wild with the end user community is a formula for disaster. So, what does an end user need to know?
End User Assumptions
To begin with, drop any and all assumptions about usage of any BI tool if you have not had any experience with it before. Even if you have had some experience with another tool, you will drive yourself crazy comparing Product A to Product B. The chance that two tools do the same thing the same way is very, very slim.
The very first thing I recommend is to get an outline of the data you will be working with. I assume you will be accessing at least one database that will have column names you will use in creating your BI output (reports, charts, and so on). You probably have no control over this data unless you have been involved in the early stages to define it.
You are obviously intending to use the information handed to you to produce something of business value. In such a case, you have some idea of the analyses and output you anticipate producing. Now once you have the data definitions in hand, the next step is to write down descriptions of the output and analyses you hope to complete.
For example, let’s say you intend to create quarterly sales revenue reports that will require totals at the end of some logical grouping (department or sector), as well as detailed information for each quarter. Your management has requested that the report also contain a column with running totals for each week of the quarter. Just when you are about to get started, the problem changes a bit to where the report must now include annual comparisons where the years are to be ranked in terms of total sales from highest to lowest. And later, some other new criteria get thrown in.
Any credible BI tool can produce a report like this, but the question is: “What level of skill is required to produce it?” Depending upon how your organization is structured and how training is delivered, this could be a straightforward task or an onerous one.
Whenever I have been asked to create a report in any BI tool, I always take the time to draw a crude representation on paper and, if there is anyone with some expertise nearby, I try to sit with them and see if the output I am proposing is feasible. I never assume anything other than whatever I have been asked to do will probably take longer than I imagined.
Another assumption you need to discard is promising any specific output format without knowing how easy the result is to produce. Many of us are accustomed to using a tool like Excel, where the placement of the data on the sheet and the capability to calculate any grouping of cells can be done in a BI tool. This is erroneous as Excel provides a totally free-form approach to data and its placement. You can, for example, define an entity that is comprised of a collection of cells that are scattered throughout an Excel sheet. Typical BI tools have to be dealt with in a rows and columns structure and tend to be more rigid in their ability to define ranges of values. Specific placement capabilities of BI output must never be assumed; this is a dangerous area for the uninitiated.
The important thing to accomplish is to create the output with clean, accurate data and present it in some manner that is clear and logical for interpretation. Try not to fall into the trap where someone absolutely must have it a particular way without knowing if the output can be created in that manner. I have seen reports that were 95% completed in a very short time, and then someone took hours and hours to complete the remaining 5% because, “It has to be that way!” Assume nothing, and question everything.
Setting Up Data for BI
The most effective BI endeavors are those where careful mapping of the business problems to be tackled are matched by supporting data in the right “shape.” The emergence of data warehousing structures, such as star-schema databases, was a result of the many years of end user queries being thrown at databases where aggregations and groupings were always a part of the queries. It proved to be far more efficient to build new structures optimized for queries across different dimensions and groupings.
Sometimes you will find that the data provided seems to work for most individuals, but it is awkward for your purposes. Perhaps you have to utilize extensive calculations and functions to finish your task, and this must be done for every new report. It would be far better to go back to your data creation and support personnel and see if there is a way to solve this complexity with a different view of the data. In many cases, new information doesn’t have to be created (such as a new database), but a fresh new shape can be provided using the same data.
The types of queries and the behavior of your usage will be very influential on the optimal shape of the data you need to access. For example, it is common for some end users to want to access multiple views of data by slicing, drilling, and manipulating the data from a variety of views. Such behavior favors an OLAP source where the typical paradigm is to slice, dice, and drill. However, OLAP viewers often have a reduced set of reporting capabilities. This cuts into the heart of many end user usage dilemmas: Are you trying to solve a problem, or make something look pretty? There are times when you can do both, and times when you cannot.
Note
I always recommend a “white board” session with the end users and IT. The drawing out of the data and usage scenarios face to face can cut through a myriad of misunderstandings and misconceptions.
From your perspective, it is imperative to understand the depth of skill and the functions you will require to accomplish your goals. If it looks too hard and you do not understand how to do it, stop! Don’t get into the mind set of, “I don’t want to appear a dummy, so I’ll work on it later.”
Figure 5-1 depicts a rudimentary planning (white board) session with some of the outcome items from the meeting. This may seem a bit simplistic, but I have done these many times, and every session has yielded some unpleasant surprises.
Figure 5-1. Aligning data with usage

Note
It is imperative to understand the seriousness of misaligned data in the context of BI applications. Once you have agreed to a design, shape, and format, it will be locked in for quite some time. If the situation is serious enough, it will be compensated for later, and you are back on the road of constant sorrow. Questions about the alignment of data with BI processes must be addressed and not avoided. This is particularly true at the enterprise level.
The Functional Area of BI Tools
There is a fundamental set of functions every BI tool is expected to be able to perform such as query, reporting, charting, and more. In the BI market, vendors strive to outdo their competitors by adding many gadgets and features that they hope are appealing as well as providing a competitive edge over others. In this section I will cover the more essential aspects of BI tools and shy away from the more esoteric options. The options and functions that are really needed to provide a solid BI foundation are confined to a core set. It is imperative that you do not let the end users get stars in their eyes over some “‘cool” functions that provide little or no business value to the enterprise.
Query Tools and Reporting
About 99% of the time, you will be working with a relational database, which implies that you will be issuing SQL statements to query the data. The tool selected will have an interface often referred to as a GUI (a “gooey” or graphical user interface). The most common query and reporting interface is one where the data is presented in a part of the window, and there is an open palette where you drag and drop the columns onto it and watch magic happen.
The first things to understand are the various options available (icons, drop-down lists, and so on) and their behavior. If you are still in the evaluation phase, you are in a marvelous place to shake down the intended BI tool. Question #2 after taking any action should be: “Where is the undo function?” Some tools offer full forgiveness, and some only offer partial forgiveness. This is especially true when you have played around with the interface itself by repositioning panes and other features. How do you get back to the original view? If you cannot, you should be very wary of this solution.
One of the primary attractions of most BI tools is to mask the SQL statements created beneath the GUI so that complex syntax does not have to be dealt with. It is also important that the tool be able to expose the underpinning SQL statements if a tech wants to look at them to see what is happening, in case there is a performance issue or the answers generated seem a bit off.
Some report writers generate the results immediately upon dropping the data values on the palette and some will defer showing the results until you press a RUN button. I prefer an immediate feedback style, but this is more about personal preference.
Be aware that most tools either have a governor in place or the capability to implement one that limits the number of rows returned to a report while you are in creation mode. Tools that impose a governing function then have the capability to execute the report against all rows. The execution style of your report writer needs to be clearly understood. This is especially important when you are running a POC, so you clearly understand any differences between running a report with limited data and a report with the full answer set behind it.
With the emergence of thin client tools (browser-based), the entire query and report creation function is handled by a back-end process. Some BI tools provide a subset of the function in thin client mode and then require a “rich client” workstation to perform the more sophisticated work. Such tools rely upon workstation size and speed for functions. If you are going to utilize such technology, be aware of which functions are offered in the different modes.
Some tools provide a separate query and report style of interface or at least offer this as an option. By separating the two, it enables you to use a query for multiple reports, charts, and other purposes. The downside of this is you have to remember to link the query to the report if the tool doesn’t remember what query it ran with a particular report.
I stated earlier that BI functional definitions do not go deeply enough in most RFP/RFI situations I have seen. Query and reporting execution styles rarely make it to the checklist. Quite often, I have heard a new user, and even some experienced ones, say: “Gee, I didn’t know it did that!” It’s a bit late in the cycle to bring up such opinions.
If you are a spreadsheet user, think about when you first started playing around with the worksheets and cells and all the odd things that have become second nature. Or, think about the last car you bought that had dramatically different options, gadgets, and ways of doing things.
Note
You need to establish a comfort zone with a query and reporting tool at the interface level. The worst possible thing you can do is to just dive in and play around without a purpose. Do not begin creating a report that is targeted for production use before you know how to drive the engine.
OLAP and Advanced Analytics
Next, we look at OLAP and more advanced analytics. I am going to assume you are not an OLAP cube developer but an end user. In the advanced analytics area, I will assume the same. Those who build OLAP cubes or develop output in the more advanced areas of BI understand the underlying technology, or you wouldn’t be able to do it.
As an OLAP user, you will be working with an interface (possibly even Excel) to slice, dice, and drill up, down, and around your data. OLAP cubes are filled with numbers, not text fields, and are for specialized usage. Certain OLAP cubes are also good for “What If?” scenarios because you can change values, write back the data, and then perform a series of views into the business.
Depending upon the technology, OLAP cubes have a standard paradigm in their creation. Data is accessed (source data), it is passed through a builder process, and a proprietary cube is created that you now work with. They take time to build and will contain historical information.
Some solutions providers offer a “drill-through” capability, where the OLAP cube can reference back to a database and call for more data “on demand.” Much of this is driven by the fact that OLAP cubes tend to be built for use “just in case” the data is needed. By that I mean the cubes are built for all the intended use. In scenarios where the maximum time to build a cube (typically batch) is reached, people start looking for drill-through options to be able to deliver a larger “virtual cube” environment.
Would it not be better to have a clearer view of what the end users are really looking at and build OLAP sources accordingly? Setting up drill-through functions has become a lot easier technically, but the reasons for doing so are often driven by poor planning. The concept of OLAP has one basic premise, as well as one major BI benefit: The basic idea is speed. You can grab on to a cube and slice, dice, and drill to your heart’s content. OLAP is made for investigatory work so the user doesn’t have to issue query after query against a database that is time and resource consuming. Because the data is loaded and calculated, there is an element of freeze-frame analysis to OLAP. There are solutions that provide dynamic cubes, thus offering a more near real-time scenario. But OLAP is primarily about speed.
A second benefit—and, to me, the more significant one—is that OLAP processes take all the “math” and apply it appropriately for all values across all dimensions (assuming that the math is not erroneous). All the IF-THEN-ELSE logic in contained within the cube(s) and isolates the end user from making mathematical errors.
I believe that OLAP processing is extremely valuable for certain applications and should be considered with the enterprise’s BI planning. However, I also believe that many OLAP offerings get away from their core strengths by trying to be all things to all people. The situations where I find OLAP to be less valuable are those where the end user population tends to be OLAP dominant and wants to drive all queries and all analyses through the OLAP front end.
Note
Clearly understand the building process in relation to your data. It is imperative that you firmly grasp what is required to build the OLAP cubes, the timeliness, and the limitations, such as having a cap on the size of an OLAP cube based upon internal file limitations or the batch window available to build them. It is also key to understand that effective use of OLAP technologies can significantly reduce the overhead on a traditional relational database by offering an alternative to the masses of queries that would have to be executed to mimic the OLAP data.
For advanced analytics, we typically think of predictive models and data mining. Such analyses are usually the domain of a small set of end users in the enterprise. Data mining in particular is a useful tool for performing deep analysis to discover trends or patterns that enable you to deliver high-value information.
Where you fall into a trap with the advanced analytics offerings is when the vendor has extended the functional possibilities to traditional BI actions, such as reporting. In these scenarios, the vendor has gotten off their game plan. Keep focused upon the business goals and how the particular tools are to be used.
If you are looking at a provider for advanced analytics, my recommendations are as follows:
• Keep the usage to the advanced analytics processes and try to avoid using functions that exceed the vendor’s core strengths.
• Look for a provider who can directly access your database(s) and avoid extracts.
• Make sure the results (output) are understandable for the average business user—stay away from rocket science interpretations.
• Buy only what you need (seats and so on), and try not to be tempted to stretch the vendor’s capabilities.
• Understand the business value and applicability by the end users...validate the capability of such a solution to deliver what is expected.
• Always demand a proof of concept (POC) by the vendor.
OLAP and advanced analytics are extremely useful tools but they are not targeted toward the general population. They need to be thoroughly tested and kept within the scope of their basic design points and not be proliferated, where they offer little or no value.
ROLAP Solutions Versus OLAP
I mentioned relational OLAP (ROLAP) earlier. This approach is where the database engine serves up OLAP-like data using the engine itself to mimic a cube. The language typically used to query multi-dimensional sources is called multi-dimensional expressions (MDX).
More and more vendors are piling on to the support and use of MDX within their portfolio. Much like the SQL language when it emerged, MDX offers a standard means of querying data in a multi-dimensional language.
By having a database that can handle MDX queries, you are opening the door to being able to build dynamic cubes and smaller cubes—the query only builds what is requested instead of all possible combinations, just in case they are needed.
One issue of ROLAP versus OLAP is that it may not perform with the blinding speed of a true OLAP engine. However, depending upon the vendor, the resulting cubes may be stored in memory and made available to others. This can have a very attractive use for a wider audience where they are looking at freedom from heavy OLAP cube building and may need to view data that is a bit more current.
ROLAP, like OLAP, has significant advantages in processing compared to traditional queries if it provides a caching mechanism. For example, if numerous people share the same data and tend to execute similar queries, a ROLAP solution could cache the results (after the first person executes it) and make it available for subsequent users. Once built, a virtual cube is pretty fast, and now additional queries do not need to go back to the database.
Note
The options for embracing OLAP versus ROLAP should be clearly understood by the end user community. The data-mapping session I recommended earlier should have a healthy discussion about such options. Do you need absolute speed? Do you need sophisticated “math” applied accurately at all levels? Does the ROLAP solution provide the same calculation capabilities as the OLAP solutions we have looked at?
Understanding the Critical Role of Time Dimensionality
I seem to be hitting 100% on this topic when I ask data modelers, OLAP developers, and BI analysts/technicians which dimension is the most critical in the data modeling piece. For those who have worked on and designed a data warehouse, a data mart, or an OLAP solution, you will, no doubt, understand why I am raising this issue.
Every BI query has an aspect of time to it. People want to know how much of ____ was produced or sold or lost in the last ____ compared to the previous ____. It is how we think in business terms and is critical to the delivery of BI output of value.
The problem I most often see is that the users see a value for DATE in the data being modeled or provided and they make that critical error once again...they assume they can treat the DATE or TIME dimensions any way they want. We look at dates and times in aggregations or blocks of time; thus, aggregations by year, quarter, and so on are to be expected. Now do you think it is trivial to calculate groupings of this year’s data in terms of percentage increase over the previous year?
It’s time to go back to the white board session or when you are preparing for a training session. Have your BI analyses in mind, jot them down, and ask specific questions about how you will accomplish this. I have mentioned several times that it is better to build calculations into the data model than within each BI entity (report and so on), so if things change, you have far less work to do.
I tend to be a fanatic for driving a POC within any enterprise solution. It offers a chance to really test the proposed tool, as well as a chance to match your processing requirements to the data you will be expected to work with. Do not let anyone dance around the time aspects of your BI efforts. Make them show you exactly how the periodicity of information will be handled. If it appears to be too complex, it probably is.
Let’s say you have some odd number of weeks that constitute a period in your line of work. If this is not built into the data model, are you being provided how will you group the information for analysis? All the grouping and selection of the odd time periods will have to be handled by...you! This is also a situation where such time anomalies must be handled in every query, every report, and so on. This is very inefficient and often prone to error.
I would urge you to identify every time period and its associated usage when you sit down to discuss your requirements for analysis, and make sure someone takes you through the steps required to perform what you need.
Note
I have seen so many BI systems where the end users were unfortunately surprised by their inability to handle periodicity per their needs. If your requirements are for standard blocks of time such as month, quarter, and so on, this is less of an issue. If you have varying time periods that fall outside the traditional views, please make sure you have someone address these as early in the process as possible. If you already have several BI tools in-house, do not let others convince you that “we have ways to handle that.” “Ways” typically implies a Simple Matter of Programming (SMOP). SMOP and BI should not be considered synonyms.
Data Mining
I covered this a bit in a previous section, but it is worthwhile delving a bit deeper into now. One definition of data mining might be: “Data mining is the process of extracting hidden patterns from data.” Another interpretation might be: “Data mining refers to the process of analyzing data in order to determine patterns and their relationships.”
You will frequently hear the terms “hidden” or “discovery” in discussions around data mining. Both are true. Some might say, “Data mining is sorting through data to identify patterns and establish relationships,” which is also true. Generally speaking, you will see most people think in terms of data mining as being able to plod through large volumes of data to uncover something you didn’t know or a pattern that was unclear using normal query and logic.
Today we see a heavy use of data mining to provide exposure of things such as fraud. Data-mining algorithms are often embedded into BI processes so that the typical business user can take advantage of the mining analysis in making a decision. For example, is a customer a good prospect for a loan? Do they have any history of fraud or some less-than-ideal attribute?
I provided a checklist earlier for data-mining evaluations; please use it. As you explore the use of data-mining capabilities at the enterprise level, make sure the results are actionable—make sure the discovery and exposed new information is easily conveyed, whether by internal processes or workflow applications or embedding in a BI application. Make sure you dispel the myth that data mining is only for the super-geeks in the organization. From the perspective of understanding how to build the appropriate model for analysis, this is true. From the perspective of potential users, this is not.
A quick web search for “data-mining success stories” will yield a number of hits. There are numerous vendors and solution providers in the market today. All of them can cite specific successes at customer sites. The important thing to note is that those with significant citations of ROI have a specific application usage in mind. Data mining is not about throwing some sophisticated algorithm at a large data source and seeing what happens; it is about setting up a scenario where you are looking for a pattern or cluster that is not readily apparent.
Data-mining examples are easy to find, and some of the examples are quite unique, such as one from IBM with the Texas Education Agency. IBM’s work at the Texas Education Agency (TEA) served as a catalyst to help TEA develop powerful data-mining capacities to help measure student success, a major component of Texas’ nationally-recognized public education accountability and assessment system.
Texas Education Agency’s “Just for the Kids” program evolved from IBM technology.
A nonprofit organization based in Austin is utilizing the TEA information in a most creative way. “Just for the Kids” has a website, www.just4kids.org, where anyone can examine performance measures of any public Texas school. The statistics offer five years of longitudinal data, a breakdown of statistics by grade and ethnicity, and a comparison of school performance to schools with similar socioeconomic characteristics.
This use of performance information underscores the role data mining can play in “slicing and dicing” statistics. More important, “Just for the Kids” demonstrates how powerful information can be made accessible within security boundaries to any parent, teacher, or student, and used as a tool to improve classroom learning.
This solution has been in place for over a decade and still delivers value. In your planning, an entire segment of the discussion ought to be based upon what data mining is most effective for the enterprise and how you can utilize it within your business processes.
Text Analytics
This is an area that I predict will become very critical to you in the near future, if it is not already. The majority of the data in the world is held within unstructured data sources, and much of it is exposed today through the power and scope of the Internet. In addition, there are masses of unstructured information sources held in your organization. You have documents, memos, emails, and any number of sources not held in a structured database format.
The key here is to look at this information as a potential source for BI analyses.
Figure 5-2 depicts a simplistic example of the use of text analytics. I have been involved with projects where there have been “discoveries” of critical information to be included in BI objects (reports, charts, and so on) from unstructured sources, such as metrics on a competitor or some internal data that had been published but not included in BI data sources.
Figure 5-2. Text analytics

The key to unlocking this data is that it changes every instant. Monitoring unstructured sources and weighing the value contained therein can be automated today. Text analytics is a bit different than using search technology. For example, you could issue a search on a competitor based upon some criteria. You typically get back a list of “hits.” Scanning each one for value pretty much defeats the purpose of doing a search because now you realize that there are a slew of things that you don’t know.
But, if there were some software to intercede on your behalf and deliver the information not only in context but the associated values, you have gained new insight as well as critical business information.
I have found few clients with a firm grasp on what they have in mind for text analytics. Most have a plan and many have a text store and retrieval system in place. This is a pure technology play, where someone in the organization needs to be charged with finding the best solution in relation to what the enterprise has installed and where it is going.
In recent events (such as trade shows and user conferences), I have heard many references to text analytics being an untapped resource, but I have seen little action as a result. One good source of the latest information is the following website: http://social.textanalyticsnews.com/.
There are several major events and symposia on text analytics. The annual Text Analytics Summit conference is an excellent venue where you can talk to industry experts, as well as create a vision for your enterprise. This is not a role for the same people who support your structured data environment, but they should be involved in the evaluation and decision-making process.
Spreadsheets—Effective Use and the Implications on Security/Compliance
Spreadsheets are pretty much the universal interface for the majority of end users. Even the most powerful BI vendors in the market will all provide an interface from their query and reporting technologies to a spreadsheet. The most ubiquitous one is obviously Microsoft Excel.
I covered this extensively in my previous book, cited several times prior to this, so I’ll not repeat that information. Spreadsheets as a BI tool are a given fact in every enterprise. They provide a tremendous amount of flexibility and autonomy for the end user. They are popular because users can sit with their data and play until their fingers fall off. They can create complex formulae and macros and all sorts of calculation objects that address their specific processing requirements.
We all know what we can do with spreadsheets. The most pressing issue today is the proper management of the information contained in a spreadsheet regarding security and compliance. Nothing can stop you from walking out with a copy of a spreadsheet or sending it as an attachment outside the firm. There are some very tightly controlled environments in the world, but by and large this data is open to abuse.
You may already have a corporate policy regarding spreadsheets that provides a framework for appropriate use. If you do not, it’s best to get one. Those I have seen that have a bit of clout to them include the following:
• Clearly stated appropriate usage
• Guidance on how to populate data from internal sources
• Business guidelines on the use of decision making
• Guidelines on the validation and cross-verification of results
• Clear policy on abuse and fraud
• Clear policy on proper use and/or inappropriate use
There is probably more data held in spreadsheets than in all other structured data sources in the world. They are probably the most productive, yet most often abused, BI tools ever created and must be managed effectively at the enterprise level.
In Information Systems Journal (March 25, 2008), there is an article on spreadsheets that is informative. The article primarily emphasizes that the uptake of IT solutions is heavily predicated upon the amount of training (or lack thereof) has a significant impact on the usage of BI tools such as spreadsheets. Spreadsheets are perceived as easier to use than many other BI technologies hence the significant usage of them contrasted with other potential solutions. Management indicated a high degree of interest in BI but, rightfully so, only where it is relevant to their own work.
The title of the article is “Managers, Spreadsheets, and Computing Growth: Contagion or Control?” It continues to describe the rampant but casual use of spreadsheets and how “dangerous” a user can become with very little knowledge or skill. When this is applied to all users in an enterprise, where there are loose standards or none at all, it is a formula for disaster.
Executive Information Systems (EIS)
Today, we see few, if any, true EIS offerings that are targeted at the top tier in the enterprise. Years ago, we saw an endless stream of offerings that provided dashboards, metrics, gauges, and so on to the “C” level. Now dashboards and KPIs and more are included in every BI tool on the market. The term is even included in the Encyclopedia Britannica, so it is certainly a mainstay in the industry.
One term being used now is that of an “actionable” EIS capability. This means that the management and executive levels in an enterprise are no longer isolated on the internal Mt. Olympus, but rather have a means to communicate their discoveries and decisions down to others to act upon.
The concept of collaboration is firmly entrenched in most quality BI tools today. What does this mean? It means that decision making is a cooperative process. Let’s say a sales executive has been using some BI functions in a corporate portal, where she can slice/dice/drill and play with numbers being fed by part of a data warehouse. She has a breakthrough in thinking and wants to get buy in. Having collaborative functions in the internal portal have made it very easy for her to convey her results, add in her projections and new thought, and establish a two-way conversation or n-way conversation with her peers and others.
An EIS today is merely a means of using technology—not a “thing” or offering. I would not even begin to entertain a standalone EIS given the wealth of solution providers with this capability embedded. An EIS is really more about how you implement your BI infrastructure.
In the case of an enterprise customer today—you—I would ask: “What is the proposed information exchange between levels within the organization?” Let’s say you have a data warehouse with some of the data aggregated at a level that pertains to the upper echelons in the organization. Such an aggregation is meaningful to them but useless to many below them. However, there are a variety of aggregate levels in the data warehouse; thus, when some inquiry or mandate gets pushed down, the next level can query information at their level and perform their own analysis and response. How will you do this?
If you consider a corporate EIS to be a methodology and not a product, the greatest challenge is in building an infrastructure where lines of discussion and shared analysis are well defined and understood. Have you taken this approach in your BI strategy, or do you have isolated executives breathing rarified air and held apart by a wall of information that only they can view and communicate?
Today’s global economy and typically distributed workforce demand a methodology that allows open communication and rapid decision making and sharing.
Craig Schiff (CEO of BPM Partners) wrote an article that was posted by BeyeNetwork. The original was published on November 10, 2009. He stated the following:
So where is EIS today? Essentially it has been reborn as the performance dashboard, a key component of business performance management (BPM). Learning from the mistakes of the past, leading systems are dynamic, interactive, and real-time when they need to be. In the best implementations, there are a series of interconnected cascading dashboards so everyone in the company can see the information that is relevant to them. As mentioned, there is still the risk of populating these dashboards with the wrong information; but if companies follow established best practices, they will start at the top with executive input on current strategy and establish a cross-functional team to flesh out the details.
In most companies, it is also understood that while the dashboard sits at the top of the information pyramid, it cannot sit there alone. Without master data management (MDM), planning and budgeting, consolidation, governance, risk, compliance, and several other systems and initiatives, the dashboard’s potential value is greatly diminished. The good news for business performance management is that, unlike EIS, most vendors and many companies (usually with the help of experts deploying best practices) are getting it right. Thanks to them, BPM is bucking the normal trend of three-letter acronym initiatives and actually living up to its hype.
There are many more salient points in Mr. Schiff’s article, including a bit of historical perspective on EIS in the past. His point reinforces my statement that an approach to an EIS today is about collaboration and an architecture that permits it in a business sense.
Note
One point that needs to be strongly stated and reinforced about an EIS is that there are new, well-defined best practices models on how to build an effective infrastructure. The scope and planning at the enterprise level is very, very different than that of a departmental or single functional level.
So how do you develop and maintain the data to address the multiple levels within an enterprise? One problem with many data warehouse solutions is that they store and aggregate data at a level that only services certain individuals in the enterprise. What about making BI available in a pervasive sense? How do individuals such as customer service reps benefit from BI technologies? One answer is the creation of an operational BI layer within the enterprise’s infrastructure.
Operational BI
Operational BI (also known as operational intelligence) is a methodology and infrastructure where you capture and store data at highly detailed levels for use by individuals, such as customer service representatives when they are talking to a customer and need access to the latest customer data right away.
One of my heroines in the arena is Claudia Imhoff. Some information on her is as follows: Claudia Imhoff, Ph.D., is the President and Founder of Intelligent Solutions, a leading consultancy on data warehousing and business intelligence technologies and strategies. She is a popular speaker and internationally recognized expert, and serves as an advisor to many corporations, universities, and leading technology companies on these topics. She has co-authored five books and more than 100 articles on these topics and has a popular blog at www.b-eye-network.com/blogs/imhoff/. She can be reached at [email protected].
I have worked with her (seminars, events, and webinars) and have gleaned a wealth of information and knowledge from her work with customers. Our passion about the operational BI concept is shared. We believe that it is one of the waves of the future, and those who have implemented it today have a significant leg up on their competition.
Figure 5-3 depicts the BI pyramid from the perspective of numbers of users and the volume of queries they typically execute, the higher up you go, the less “busy” work against data occurs. If you turn the pyramid upside down, you would get a view of the amount of data each layer consumes. By this I mean that the folks at the top typically look at data that has been aggregated from a huge base of information and condensed down to a dense number. If you are a lower-level individual, you will probably look at far less data but at a more detailed level. A sales executive would look at the total of all sales by some aggregation. A sales representative would look at sales only pertaining to them.
Figure 5-3. Operational BI

The characteristics of an operational BI structure would be as follows:
• Large volumes of data contain highly detailed information.
• The system works in real-time or near real-time in its capture and availability.
• End users are typically BI illiterate and use the functions to query data through a portal.
• BI processes are called as a service, including data-mining algorithms in some cases.
• The data is stored at a far more granular level than what is typically found in a data warehouse.
In an operational BI system, there is a strong requirement to capture data as rapidly as possible and make the new information available in near real-time. What most critically affects the success of an implementation is the ability to quickly make the data available. Depending upon the source data where the information is initially captured, the operational process may be a challenge to enable. Let’s take an example that is typical in today’s market. An enterprise captures transaction data on a mainframe and stores it in a database that is ideal for transaction processing but not for BI.
A copy of the data is subsequently transferred to a distributed environment where it is validated, altered, and used to update a data warehouse. In so doing, some levels of detail are stripped away, and the lag time for loading to the warehouse can range from minutes to days. This information is useless in an operational BI scenario. The dilemma they face is that many of the transactions have anomalies and inaccuracies that are cleaned up in an ETL process after the point of capture and while en route to the data warehouse.
I have discussed similar scenarios with a number of customers. Their typical tactic is to reengineer some parts of their infrastructure in order to make the data available faster and at the proper level of detail for new operational use. In such cases, a significant payback (ROI) for operational use must be identified and agreed to.
The clients will look at several options in such cases once they deem operational BI to be essential and of value, as follows:
• Validate and cleanse the data at point of capture, which still isolates its use from BI processes.
• Immediately copy the data to an operational data store (ODS) and validate and cleanse it there.
• Use the ODS for both operational BI processes and to trickle-feed the data warehouse.
• Re-platform the data warehouse and BI processes on the mainframe to provide a single, interoperable infrastructure.
• Provide some compromise where the operational data is more current but not as up to date as may be desirable...
Regardless of how you decide to provide this capability, do you have an operational BI requirement in your organization? It is always a challenge to deliver an operational change once you have a well-established infrastructure. The key drivers for such systems are typically a need to provide improved customer service, competitive pressures, or both. Regardless, when you step into the realm of operational BI, you will be forced to make specific product choices. The typical operational BI situation provides these functions in an embedded manner, where the end users are oblivious to the underlying technology. What is embedded BI?
Embedded BI and Event-Driven Processes
There are articles dating back to 2004 regarding the concept of embedded BI. Colin White of BeyeNetwork stated the following in an article dated May 23, 2007:
By its nature, event-driven operational BI is able to react much faster to changing business circumstances than demand-driven BI. When close to real-time operations are required, the best way to implement event-driven BI is to embed it in operational business transaction processing. In an SOA environment, this can be achieved by placing BI service calls in the business transaction workflow. BI services called in this manner can do data validation and cleanup, update a data store or cache, send a message to a message queue, perform inline BI analyses, or update an operational BI dashboard.
We can see then that embedded BI is not really a different type of BI processing, but rather an approach for implementing event-driven operational BI. This style of implementation tightly integrates BI with operation processing, while at the same time proving a flexible development environment. It also enables organizations to use BI to make rapid decisions and, in some cases, to fully automate the decision-making process.
From this article and many others emerges the clear message that embedding is about tying a BI process to a specific business requirement. This not only holds true for operational BI but also for the many events that occur with possible impact upon your organization and your position.
First of all, embedded BI processes defined to an SOA are reusable resources. They are defined once and used over and over. The advantage is that if the definition changes, it is altered once and used accurately on a global basis. Another advantage is that multiple processes can be tied together and, in most cases, without any programming required. If done properly, the typical end user can create a personalized, dynamic BI interface.
One example of an embedded BI application might look like this. The user is responsible for monitoring a competitor. They have a BI service that queries and monitors information held in external systems and sites that relate to the competitor. They also have a service that provides a near real-time feed of their organization’s current sales metrics. Pricing and promotions are determined by market position and actions taken by the competition. A data-mining process is used to assess how effectively any new offering or action is in their current market position. You can extend the story at your whim, but here we have three distinct services that are placed upon the user’s personal portal.
Could we extend this even further to think in terms of event-driven BI? Yes, we can. Event-driven BI is an area where I find that many clients do not take significant advantage of the capabilities. I don’t know about you, but I get very tired of having people tell me some new tidbit has been stored somewhere and I need to look at it. Why not just notify me that there is something of importance when I have a need to know?
Most quality BI offerings contain a mechanism to detect an event and take an action. If there is some milestone occurrence (such as a number that exceeds or falls below an acceptable level), unless I am one who just constantly queries, reports, charts, and spends significant time doing BI chores, what do I normally do? The best practice would be to establish event detection and action as a key requirement of your BI infrastructure and carefully assess how potential offerings satisfy the automation of such events and potential actions that can be taken. Typical end users will have some time table they employ, such as running a report once a week, or whatever they need to do. In many cases, the information they receive merely validates what they already know. However, sometimes they can be very unpleasantly surprised by finding out that a key metric is out of scope, and then they wish they had known earlier.
Some end users don’t want to be bothered at all unless there is an action they need to take. They can also make significant use of embedded BI processes. Those of us who wallow in this space sometimes forget that the majority of the people we service have “real” jobs. These are people who only need BI processes as a tool and not an avocation. Regardless of your position in the enterprise, it is imperative that you develop a delivery mechanism that is optimized for the target users. Take advantage of hands-free BI processes by enabling events, and make sure your vendor(s) can do this to your satisfaction.
ETL/ELT and Real-Time Change Data Capture (CDC) Options
The underpinning data you use for BI will emanate from some source system that may not be conducive to BI applications. I have already discussed some of the ramifications of ETL versus CDC in terms of timeliness of data. For the enterprise, this decision has a greater impact than at particular departmental levels. It is an area where the ability to utilize the full range and scope of your BI arsenal in the most effective manner will be realized or limited.
The majority of enterprise accounts state that they have issues with data quality as well as being able to collect it and create a common view from a multitude of sources. One approach that can be taken is to use data federation technology that enables you to keep the data in place and join it to treat it as one unified database. The problems with federating are performance and accuracy of the data. If there are no common keys to link multiple sources together, federation is not viable. If there are anomalies or incorrect values in any of the sources, it’s a moot point to begin with.
Where last-minute, real-time data is not an issue, an ETL (or ELT) approach is a good one. This enables you to capture data and perform the operations to transform it to being BI friendly on an orderly basis. Obviously, the timeliness of the information is what you need to look at. In some cases, however, I have seen changes in data transfer, and validation applications take a huge step backward.
Let me cite a personal example of how not to do things. I have a significant number of air miles logged with a certain carrier. They merged with another not too long ago and merged their IT infrastructures. I used to be able to check my mileage credit online nearly the instant I stepped off a plane because they posted the data in near real-time fashion. It was a marvelous customer service application. Since the merger, I now find my mileage credits to be lagging significantly. I have had to contact the new organization (including writing letters and enclosing lots of documentation) several times of late, as I have been given reason to doubt their accuracy. I have gone from being a really happy customer to one of extreme mistrust. I am limited to a few airline choices where I live, so I feel trapped. Their CDC or ETL processes are broken, and they do not seem to be inclined to change. Due to my advanced status on this airline, I will keep using them for selfish purposes but will never sing their praises again.
CDC is a part of the normal ETL process, as well as a mechanism to provide near real-time processing for BI, assuming the data is clean and accurate. In situations where steps have been taken to ensure cleanliness and accuracy at point of capture, you have the greatest flexibility because you start with good information.
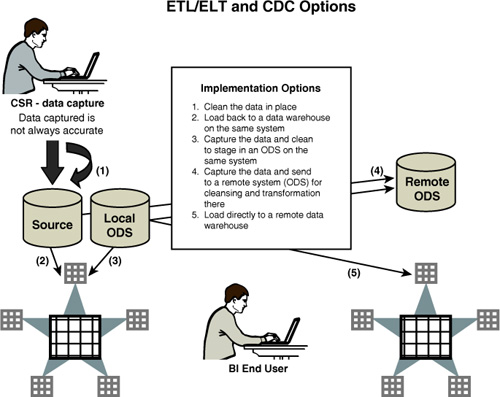
Figure 5-4 shows the implantation options for ETL/ELT/CD as they relate to a BI infrastructure. Each has its advantages as well as stress points. For example, the most elegant way of addressing the data quality issues is to validate and clean at the point of capture. In many cases, this is impractical due to lack of automation technology for the database being used. It can also be affected by the type of application, such as extremely high volumes being captured by service representatives who cannot verify certain information and do not have the time to perform the validation necessary.
Figure 5-4. ETL/ELT and CDC options
Your decisions and discussions will also depend upon your interest and need for operational BI where the timeliness of the data is critical and affects how well a particular process is enabled. Massive changes in infrastructure with no net new business benefit are impractical, but if you see a need now or down the road for a significant change in the data warehouse and BI cycle, it’s time to at least try and gain agreement on a plan.
If you have existing processes in place that preclude you from maximizing your BI potential due to data issues, it is time to formulate a better plan. I have said endlessly in my discussions with clients: “It’s all about the data.” The shape of the data, the timeliness, the accuracy, and the detail being matched to the BI process are all areas where people often fall short. ETL and CDC processes are an IT decision not to be taken lightly. Unless you make known your specific requirements, you may inherit an infrastructure that is too far down the road to call back, and you will have to make up for this in ways that are inefficient and not cost-effective.
Summary
I have bounced around a bit from BI-specific functions to infrastructure topics that impact the end user. The majority of difficulties in BI implementations I have seen are based upon lack of communication and coordination. The end users don’t know what to ask IT, and they don’t want to appear ignorant, so they don’t challenge issues they should.
You will have to learn some level of usage for the BI tool(s) you have opted to implement. If you make assumptions about what they can do or how something will work and are surprised later, that is your fault.
Not only does the accuracy of data have a bearing upon your success, but it affects the “shape” of the data as well. If system impact and resource utilization are issues with your query technology, maybe OLAP is a better solution. However, if you are using OLAP, and you are trying to extend it beyond the boundaries of what it is designed for, you may be asking for trouble.
At the enterprise level, BI solutions will receive enormous scrutiny. One group may totally fall in love with a specific offering, whereas another may not agree. In many cases, the choice is to bring in both tools—no one will arbitrate, and you wind up with two tools that do very similar things. In such cases, this often is where there is poor leadership.
Each topic in this chapter should be a part of the enterprise BI definition and some elements within the vision statement. The worst thing to do is to assume or not question things that need a response in your mind. Make sure you have been shown exactly how things work within a particular BI tool if you are one who will build things. If you are a casual user (recipient) of BI, understand that there are methods and functions that may be easy to extend to make your life easier, such as embedded BI processes.
All BI users are not created equally. What should individuals expect based upon their role within the organization?