17
CHAPTER
POST-LAUNCH PERFORMANCE MANAGEMENT
Executive Summary
![]() Product managers and their teams are responsible for optimizing the performance of their existing products, consistent with the strategies of the organization.
Product managers and their teams are responsible for optimizing the performance of their existing products, consistent with the strategies of the organization.
![]() In order to optimize the performance of current products, product managers must be able to harness data and associated metrics—and to tell a meaningful story about the product’s business.
In order to optimize the performance of current products, product managers must be able to harness data and associated metrics—and to tell a meaningful story about the product’s business.
![]() When products are active in the market, the cross-functional product team serves as the “board of directors” for the product, analyzing the product’s performance and making the most appropriate strategic and tactical decisions for the product’s business.
When products are active in the market, the cross-functional product team serves as the “board of directors” for the product, analyzing the product’s performance and making the most appropriate strategic and tactical decisions for the product’s business.
System thinking: A discipline for seeing wholes and a framework for seeing interrelationships rather than things . . . for seeing patterns of change rather than static snapshots.
—PETER SENGE
The purpose of this chapter is to guide you through the part of the Product Management Life Cycle Model that refers to post-launch performance management. It’s a time when the product is living its plans and the product team is responsible for optimizing the financial and market performance of the product in the market, consistent with the strategies of the company.
Unfortunately, many business resources refer to this activity as “product life cycle management,” which can be confusing. By taking a beginning-to-end perspective of the product’s life, we can view one product or many products in a portfolio more holistically, allowing for a more strategic view of all products and how they each contribute to the value of the entire portfolio. This point of view allows for more efficient allocation of product investments to the product lines where investments are needed. This is why product managers and their teams should be optimizing their product’s performance, not maximizing performance. Ultimately, product managers should strive to build a durable, long-lived “product business” and a solid reputation.
To set the proper context for this chapter, I want to reinforce the fact that this part of the Product Management Life Cycle Model does not stand alone. The work you do to manage a product in-market has deep connections to other parts of the model, and other chapters in the book, including Chapters 6, 7, 8, and 10. I’ve visually connected these areas in Figure 17.1.
FIGURE 17.1
Connecting Post-Launch Performance to Other Areas of the Product’s Business

RUNNING THE BUSINESS
Whether you’ve launched a completely new product or introduced an enhancement or update, a high degree of real business diligence is required to track the performance and contributions of the product as it moves through its selected markets. Mindset, behaviors, and activities in this area differ from those needed up to this point.
Post-launch performance management requires a lot more thinking on your feet. This is where the true work of the product manager and the team starts, because there isn’t a post-launch performance management step-by-step template. The approach you take for current products needs to be tailored to the situations you encounter, the dynamic nature of markets, and your company’s business model.
This is when product managers earn their stripes as business owners, just like successful entrepreneurs and CEOs. In this work area, you’re always on the go, and your mind is constantly processing a dynamic mix of data, from explicit market signals to implicit market cues. You can’t stop for a minute because you are being bombarded from all fronts. Sometimes, you may feel overwhelmed. However, with the right data and mindset, you will be able to guide your product’s business with a subtle finesse that may even surprise you at times.
Think of it this way: if you were running a small business, you would always need to respond to the exigencies of the moment because of customer requests, supplier issues, and operational challenges. Product managers run their own small business and will always be pulled by emails, meetings, random executive requests, and a variety of questions from Sales, Development, Operations, and Customer Service.
As a matter of fact, if you’ve had experience running businesses or parts of businesses, you may be familiar with some of what will be discussed here. On the other hand, this might be new material for you. Either way, hopefully you will benefit from learning some new tricks and ideas to help you think about your products as businesses.
There’s one thing I’m sure you will discover if you haven’t already: most plans have flaws. In the blink of an eye, the data you used to create your product strategy can quickly become obsolete, and the roadmap you created is no longer valid. As we continue our work in this chapter, I’d like you to make a note: you can’t drive looking only at the map. Like driving, you’ll find that constant surveillance of the internal and external environments will end up guiding you along your way—across the product life cycle.
THE IMPORTANCE OF MEASURING PERFORMANCE
Thousands of years ago, the ancient Babylonians created the first numbering system. They used tally marks and symbols to create calculations to keep track of time and communicate about quantities and such. During these early times, businesspeople knew they needed a way to determine how their businesses were performing. Today, living without numbering or measuring systems, whether in our personal or business lives, is almost unimaginable. These systems are vital to planning and tracking performance.
Throughout this book, I’ve talked about why it’s important for product managers to have the ability to evaluate markets, strategies, revenues, and expenditures. Diagnostic skills allow you to make connections between independent observations and measurements—or to “connect the dots.” Without these skills, you won’t have the wherewithal to manage the product’s business, and you’ll be forced into a continuous state of reactive firefighting.
Without exception, senior leaders say they want product managers to speak the language of business—of efficiency and productivity—and to produce positive returns to the firm. Because product investments account for such large sums of money, this is not unreasonable. But having quantitative and diagnostic skills is only one part of the formula. Product managers need to know what to measure and how to measure it. In addition, product managers need to know how the metrics enable connections so that conclusions can be drawn. As stated previously, a situation will arise that, when evaluated, is caused by many factors. Rarely is there a one-to-one, cause-and-effect relationship. When you are alert to the many influences on a product’s business, you are better prepared to take action that will lead to a positive outcome. With this, I’d like to reinforce an important point: Product managers will earn greater levels of credibility across the organization when they understand and act on proven facts and relevant data.
Metrics provide the key. Metrics are standards that allow you to quantify, evaluate, diagnose, and explain findings and to consider future options. Metrics are based on data, and many product managers are challenged by a lack of sufficient data. Fortunately, leaders in many companies are addressing this problem as new and innovative ways emerge to mine data in disparate systems and to secure increasingly available public data. Regardless of the hurdles you face, you will always be “crunching numbers” in order to figure out how well your product is doing.
CREATING A DATA-DRIVEN FACT BASE
Imagine that you are in your office and you get a call from the head of Customer Service about an onslaught of complaints from customers about a product defect. You’re surprised by this because things seemed to be going well. You’re taken offline from everything else you had to do, and after a few days you find out that the head of procurement, in a cost-cutting move, sourced a component for your product from a new supplier whose reputation had not been tested. Your product, with a sterling reputation, is now sinking fast, and the industry analyst, who just happened to be doing a product comparison, found out about this and wrote a scathing online review—just what you needed! Had you monitored your cost variances in the cost of goods sold (COGS) part of your product’s profit and loss (P&L) statement, you might have been forewarned that costs were going up and your gross margin was declining. Or, had you been alert to metrics supplied by Customer Service about an increasing number of complaints, you might have been able to act sooner. But you missed the signals, and someone else, through his actions, caused your product to falter.
Product managers must understand that data is the fuel that runs the product’s business. Data is necessary to help you evaluate how your product performs. And data, as is evident in the previous example, should be associated with certain triggers that send alarms when a specific condition is encountered.
Data collection may involve many people from across the business. Therefore, it’s cross-functional. And any activity that involves the cross-functional product team provides an opportunity for people to share common insights and viewpoints. This also allows team members to get ahead of the curve because they will start to knit perspectives in their mind and begin to think of new and interesting ideas. The role of the product manager in data collection is to ensure that the right data is available and to actively facilitate the integration of myriad data elements. If the data is not available, then the product manager must “make the case” for the data and work to influence others, such as IT, Marketing, Finance, Sales, and Operations, to ensure that the data is collected and made available.
For product managers and their teams, data doesn’t always appear as a figure on a financial statement or a graph on a market share chart, although much data comes from market intelligence, sales, or operations. Data can be derived from documents you read, processes you use, customers you observe, or competitors on the market battlefield. Data can reside in many systems inside your company and in publicly available repositories outside of your firm. As a product manager, you have to proactively look at dynamic data indicators (e.g., daily or hourly trouble reports, number of simultaneous users), data that is collected on a routine basis (e.g., customer satisfaction surveys or operational performance reports). Data is everywhere; you just need to know how to look for it!
DATA AND METRICS
Data comes from many places. Data sources are mentioned, either explicitly or implicitly, throughout this book, so I won’t rehash it all here. What’s important is to understand that metrics (measurements) are usually divided into the following categories:
![]() Market metrics
Market metrics
![]() Financial metrics
Financial metrics
![]() Sales, service, and operations metrics
Sales, service, and operations metrics
![]() Observational metrics
Observational metrics
With these in mind, single data points don’t tell a complete story. Metrics, on the other hand, refer to an array of data points, generated from various sources that allow for more complete evaluations of a product’s business performance.
Before I review these metrics, I want to point out that some performance measures will only provide you with a context around the results obtained. The results you evaluate should focus on areas deemed critical to the success of the product’s business. Whichever measures you have, they must be evaluated frequently enough to detect patterns and to catalyze action from any member of your cross-functional team.
For example, if you worked closely with Sales to provide training and better product positioning, will the salespeople make more sales calls and close more deals? Or, if you increased your product testing to improve quality and usability, will you have reduced the number of product returns?
Product managers and their teams must have these measurements to both evaluate performance and inspire corrective action to continuously improve the product’s business and its contribution to the firm’s overall results. Let’s now review these data categories and associated measurements.
Market Metrics
As mentioned in Chapters 7 and 8, the “market” of buyers (i.e., customers) and sellers (i.e., competitors) is multidimensional. The term market movement is used to indicate that one or more dynamics of the market is in play at a point in time. Product managers and their teams must be able to take snapshots of market activity and rapidly consider what’s going on. The following list is an overview of some of the areas that you might want to understand:
1. Market share is a metric that shows how you are faring against your competitors. You might look at revenue by market area or unit volume. To calculate market share, you need to know the revenue your product produces for your company versus the revenue of all available competitive products. Alternatively, calculating unit-based market share requires data about the number of units you sell compared to all of the units purchased in a given market area. As you can see in Figure 17.2, market share charts can help visualize competitor market movements as well as describe who’s taking share from whom and why. In this case, a new product from year 1, Competitor 1 has slowly gained share. Competitor 3, on the other hand, has not kept up. Imagine if you could portray your product’s life cycle curve of revenue and profit and describe how your strategy resulted in greater market share!
FIGURE 17.2
Market Share Chart

2. Market penetration relates to how quickly your product is accepted (purchased) by targeted customers and against competing firms. To calculate market penetration, you need to know how many customers have purchased your product in a given market area or segment against the total population of targeted customers in that segment, including your competitors’ customers. (Arithmetically, divide the number of customers by the total number of targeted customers.) This information is also important when you forecast future penetration into current or new markets.
3. Compound annual growth rate (CAGR) can help evaluate the year-over-year growth rates (e.g., market penetration) of your product or product line. If you have data about unit volumes, revenues, and/or average selling prices in a given market area, you can calculate your own CAGR. However, what’s important is to compare your product’s CAGR with the market’s average CAGR (e.g., for the industry, sector, or geography). Interestingly, this measurement can be checked against your product life cycle curve to see if your product is leading, lagging, or equal to the market’s growth rate. CAGR can be expressed in absolute and percentage terms. Given this, it is easy to confuse CAGR with an annual average growth rate—a method that is not recommended. To calculate CAGR, start with the beginning value (BV, e.g., revenue at the end of year 1) and the ending value (EV, e.g., revenue at the end of year 5). Remember, there are only four intervening years if you have five end-of-year observations, so from the first year-end EV to the fifth year-end EV is only four years; your exponent would be 1/4 or .25. You’ll find the following formula in most financial texts:
CAGR = (Ending Value/Beginning Value)1/n – 1
4. Customer usage tells you how often your product is used by targeted customers. There are a host of ways that you can track usage, depending on the type of product and typical frequencies. If you have a software-as-a-service product, you can track the number of active users (e.g., daily, weekly, etc.). You can also look at the tasks that users are undertaking. If you survey users of a computer game, you can find out how many hours per day they use the product. If you have a web-based presence, such as a bank application, you can track number of visits and transaction volume.
5. Customer profitability allows companies to determine which customers add the most value to the business. A related metric, customer lifetime value, allows product managers and others to see whether a key customer is active and profitable across the duration of the relationship. Companies may add up all the revenue from a single customer for all products purchased or calculate the sum of individual product revenues. You may find that your product is sold at a discount as a way to cross-sell other products. You may also learn that your product is very profitable and helps your company’s other products to be more successful. Either way, it’s good to know where your sales revenue is coming from!
Financial Metrics
In Chapter 6, I discussed the importance of finance and referred to money as the language of business. In the end, your product must produce a profit for the business or be the catalyst for other solutions to bring in solid, positive contributions. The following list defines some common financial metrics:
1. Unit volumes provide you with a way to evaluate the number of units you sell or the number of transactions you produce. This helps you determine the contribution value of incremental units. It also allows you to figure out how sensitive your unit volumes are in relation to prices charged or advertising spend. Further, you can use unit volumes to calculate your market share or market penetration numbers and to target advertising and promotion programs that might influence greater unit sales. Lastly, unit volumes can be tracked over time to assess performance and treated to factor out anomalies. Averaging (or smoothing) can account for seasonal fluctuations. I’m a fan of moving averages shown as an overlay to monthly or quarterly figures.
2. Average price per unit allows you to see patterns based on discounting or competitive activity. In the communications sector, a popular metric is called average revenue per user (ARPU). If salespeople have a quota for your product and don’t achieve their numbers, they may resort to heavy discounting to beat the competition. As you track average prices over time and link these price movements to other factors, you can figure out which levers to pull to realign and rebalance the product line or when to consider options such as an enhancement or a product discontinuation.
3. Gross margin is an important metric that adds to your understanding of your product’s business contribution. As mentioned in Chapter 6, cost of goods sold (COGS) is made up of the materials, labor, and overhead used to produce a tangible product. These costs, when subtracted from total revenue, provide you with gross margin, a rough approximation of profitability, shown both as units of currency (money) and in percentage terms. It’s important to understand your product costs because you can equate costs to unit volumes and, ultimately, to revenue and profitability.
4. Channel margins are generally considered profits that can be calculated by multiplying the unit volumes sold through a given channel (online, direct sales, etc.) by the unit revenues in that channel. Product managers greatly benefit when they know the price charged as the product moves through each level. This allows you to figure out where each channel provides the best contribution to the business and the actual value as perceived by the customer.
5. Monthly recurring revenue is used for applications where monthly fees are being collected. Movements in revenue can show important trends.
6. Customer acquisition cost is a measure of the sales and marketing investment involved to obtain a new customer over a specific time frame. This is of particular interest to firms that market and sell software-as-a-service applications.
Sales, Service, and Operations Metrics
One of the areas often overlooked by product managers includes the performance metrics of other departments. Because the people in these departments may be members of your cross-functional team, it’s important to know how their measurements affect your product’s business. One metric is the “order-to-cash” cycle. In a recent organizational assessment, I learned that it took one company over a month to process an order and deliver the product because of systemic bottlenecks, handoffs, and a lot of mistakes. I also learned that this frustrated the product manager because she said that the product was functionally superior and preferred over competitor products. It frustrated customers because they wanted to have the product in their hands more quickly. You can imagine how a process improvement such as an automated system might contribute to the product’s success.
From an operational perspective, product managers should ensure that they can meet the demand patterns for customers in any market area at any time. Many operational metrics focus on how effectively distribution and logistics processes work.
Here are some useful metrics that you can use:
1. Sales force effectiveness allows a Sales leader to assess the performance of a salesperson. These metrics may include the number of calls made, effective contacts (actually connecting with a customer), percentage of sales that are from new customers, and average revenue produced by the salesperson. When I was a product manager, I was very concerned with sales force performance over time to ensure that I could count on increased market share and product profitability. Any product manager is greatly concerned when salespeople do not fulfill their objectives. This limits market potential, penetration rates, and growth rates for products.
2. Out-of-stock metrics are important to determine whether the inventory held for tangible goods is sufficient to fulfill demand. From a logistical perspective, you have to make sure that the business can get your product to the place where a customer needs it, when they need it. If not, they’ll go elsewhere and you’ll lose any goodwill you’ve earned to that point. A frequently used ratio is known as the “stock-out” ratio and is calculated with the following formula:
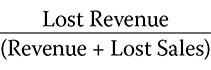 × 100 = Stock-Out Ratio
This information can help ensure that you don’t run out of inventory, allowing for replenishment at given trigger levels.
3. Inventory turns refer to the number of times inventory (for tangible products) is sold and replenished during a given time period. This metric is calculated on the basis of sales of the product and the inventory held. Divide the revenue of the product by the average inventory level. As inventory turns increase, you know that your product is selling at an increasing velocity. An associated metric, days of inventory, may provide visibility into how quickly inventory moves. If you divide the number of days of the year by the number of inventory turns, you’ll come up with the average number of days a product is kept on hand. More turns means that there is greater velocity in volume—a good indicator. If you compare your turns over various time periods and against industry norms, you’ll know where you stand and can make appropriate adjustments. Too much inventory ties up working capital. Too little inventory may cause a stock-out, which means some customers will be unhappy when they are unable to purchase your product.
4. Customer quality of service metrics focus on how customers feel about their experience interacting with your company. For example, you’ve probably interacted with many companies on the phone or online and have been asked to fill out a survey after your interaction.
5. Customer satisfaction indicates whether your product is fulfilling the customer’s need, providing value to that customer. It is also a measurement that can provide an indication as to whether the product will be repurchased. This widely used measure contributes to your ability to predict future purchases by customers. Generally, you want to focus on a large number of customers, establish acceptable targets, and then have those targets exceeded.
Product managers and their teams should also secure sufficient feedback from their customers about their level of satisfaction with their experience in using the product. I recommend that you check with people from Marketing or Customer Service to find out how customer satisfaction surveys are constructed and conducted at your firm. Many firms use customer quality of service metrics, such as a post-service survey, to gauge the customer’s experience. Try to determine the measures used in your company in relation to your product. There are a lot of easy-to-use tools that can be utilized to survey your customers.
6. Incident-based metrics are those that allow you to gauge how effectively your organization engages with customers when they contact your company to resolve a problem. Your firm may interact with customers over the phone or via email, chat, or social channels. For example, if your company operates any type of interaction center, you’ll want to measure average time to respond to an online request. As you know from personal experience, you become less satisfied when you cannot get in touch with a customer service person or when it takes too long to solve a problem. The incident handling time metric may help you find out how long it takes to solve a customer problem. When these are tracked, you can help the Service or Operations department to fine-tune its own functional efficiencies. You’ll then be able to compare some of these numbers with levels of customer satisfaction or customer sentiment, and even sales volumes, to determine how well you’re doing.
EVALUATION: WHAT’S HAPPENING NOW WITH THE PRODUCT?
Data and the associated metrics allow product managers to proficiently manage their products.
However, individual data elements or even singular metrics do not usually provide sufficient insight. Several data elements must be evaluated collectively so that a deeper understanding can emerge. The evaluation of disparate data elements can be a challenge, unless you figure out how to create the connections—or, to use an expression mentioned earlier, “connect the dots.” One of the great benefits of having a cross-functional product team is that you have a group of people who can help one another make sense of the numbers. With this, I’ll now provide you with tools to evaluate your product’s performance and contribution to the business. These include:
1. Assessing the impact of your cross-functional product team
2. Identifying the life cycle state of the product
3. Evaluating financial and business data using product scorecards
4. Using a product dashboard and a product health report
Assessing the Impact of Your Cross-Functional Product Team
We’ve all worked on teams. Like any organized sports team, competitive advantage can be earned when people on the team are properly skilled, experienced, and led. It is understood that most agile teams, such as those who develop software, operate effectively when they’re colocated because of the relationships that are nurtured and trust that’s earned. Effective cross-functional product teams are better able to solve problems more collaboratively and to make more informed decisions.
As I indicated in Chapter 4, modern cross-functional product teams can also contribute greatly to the organization’s performance, especially when focused on the tasks associated with the product’s business, not just development. Of almost equal significance is the challenge of virtual or remote cross-functional teams. In my research, there are cross-functional product teams that work remotely, deal effectively with ambiguity, and are able to stay laser focused on product performance optimization. Regardless of the fact that teams can be local or remote, great tools like online whiteboards, video, and other team-building tools that bring people face-to-face, , allows teams to remain productive, regardless of where team members work.
As I’ve learned, there’s way too much emphasis on processes and production—of development and release. Why? Because in many firms, it’s the focal point of work. For an organization, it’s like a treadmill. To advance the effectiveness of a product team, you need to get off the treadmill and get on the road to broaden your horizons. The heart of the work your team needs to focus on will be covered after I review what’s important in this part of the chapter: team performance and the creation of a product team report card.
A product team report card is simply a vehicle you and your team can use to collectively gauge the effectiveness of your team. What we want to be able to do is figure out who’s doing what with whom and when, and how effectively those activities are contributing to the desired goals and strategies, presumably agreed upon by the team. In Chapter 4, and specifically in Figure 4.1, I explained the foundational elements of a cross-functional product team in a circular model, as if everyone was sitting around a table with the product manager at the center. However, to begin to create your product team report card, you might want to view the team from a functional perspective. I’ve portrayed this in Figure 17.3.
FIGURE 17.3
Cross-Functional Organization with Product Team Leader

To begin creating the product team report card, we need to have a clear understanding of the roles of the person who represents a given business function and what that function is responsible for when it comes to managing the product’s business. Here are some quick examples for you:
![]() Sales must maintain key customer relationships and deliver on the promise of their forecasts.
Sales must maintain key customer relationships and deliver on the promise of their forecasts.
![]() Marketing should be responsible for lead generation and events.
Marketing should be responsible for lead generation and events.
![]() Service provides support for inbound inquiries and field service deployment.
Service provides support for inbound inquiries and field service deployment.
![]() Development builds and tests the product.
Development builds and tests the product.
![]() Operations provides for manufacturing and logistics support, or for IT and internal systems.
Operations provides for manufacturing and logistics support, or for IT and internal systems.
![]() Finance lends a hand with budgets and financial reporting.
Finance lends a hand with budgets and financial reporting.
To take this further, there are different levels of support across the life cycle. You’ll want to create a model that indicates the required output from any function and where dependencies rest. For example, who determines the output from Marketing to Sales? How does Sales get leads into the CRM system, and how is that system provided? What systems and data does Finance use to produce a monthly product P&L?
As you know, some things work well, and some things don’t. Therefore, I recommend using a Cross-Functional Product Team Report Card, shown as a template in Figure 17.4.
FIGURE 17.4
Product Team Report Card
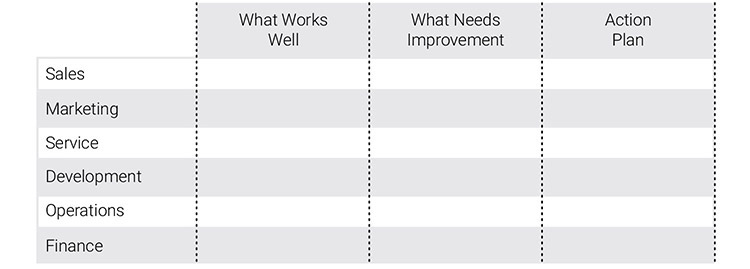
To make this work properly, you need to be able to:
![]() Review the inputs, activities, and outcomes from each function in reflective review sessions with the entire team. You need to be able to secure everyone’s perspective.
Review the inputs, activities, and outcomes from each function in reflective review sessions with the entire team. You need to be able to secure everyone’s perspective.
![]() Consider items that are associated with the Product Management Life Cycle Model, including garnering market insights, strategizing, planning and prioritizing, and going to market. Also, reflect on overall effectiveness in terms of team members meeting commitments, solving problems, collaborating, and so on.
Consider items that are associated with the Product Management Life Cycle Model, including garnering market insights, strategizing, planning and prioritizing, and going to market. Also, reflect on overall effectiveness in terms of team members meeting commitments, solving problems, collaborating, and so on.
![]() Consolidate the information into possible action plans that can be used to provide remedial help and improvement.
Consolidate the information into possible action plans that can be used to provide remedial help and improvement.
![]() When you’re creating summaries for management, make sure that you can summarize goings-on with your team so that leaders remain confident in your team’s ability to deliver results—and to self-govern.
When you’re creating summaries for management, make sure that you can summarize goings-on with your team so that leaders remain confident in your team’s ability to deliver results—and to self-govern.
Identifying the Life Cycle State of the Product
From time to time I ask product managers and other product stakeholders to tell me if they have products in the market that are in the Growth phase of the product’s life cycle. Many say that they do, but when I ask how they know it, most of them answer that their products are in “growth” because revenue is growing. When asked how revenue is growing, and over what period of time, many provide responses such as, “Sales are up 7 percent for the past two years.” This may or may not be the product’s actual planned revenue trajectory. Who decides what the Growth phase looks like, and is revenue the only determinant of growth? These are important questions for us to answer.
A product life cycle curve can be represented by the product’s revenue, gross margin, or cash flow across its entire life cycle. As shown in Figure 17.5, the cash-flow curve suggests that during the Planning, Development, and Launch phases, the product is using up cash but not generating any.
FIGURE 17.5
Cash Flow–Oriented Product Life Cycle Curve
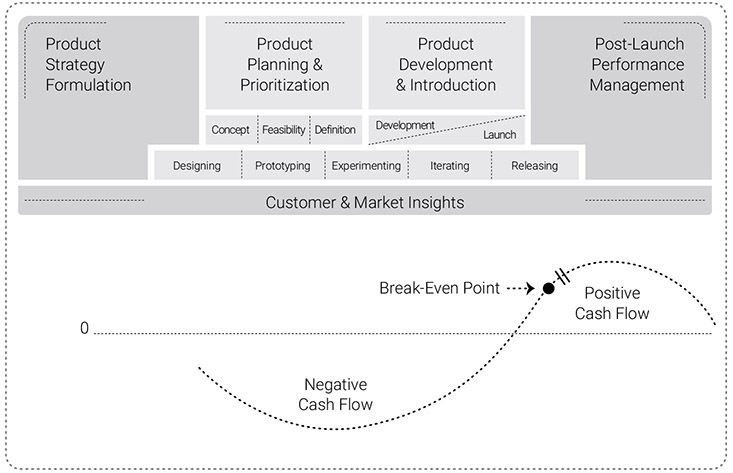
When a product is in the Growth phase, the cash flow is increasing at an increasing rate. It further depicts the fact that positive cash flow must “pay back” the initial investment, hence the “break-even point” notation on the curve.
Mature products, on the other hand, have revenue that is either increasing at a decreasing rate or relatively flat. There are some products that can be mature for extended periods of time with stable revenue and predictable profit contributions. Some mature products can even contribute higher gross margin than they did earlier in the life cycle, mainly because of operational improvements to the business. Finally, Decline phase products have sales decreasing at an increasing rate with eroding profits and vanishing market share.
Each of these curves, either for planning purposes or showing actual performance, is the result of data points that are graphed and plotted. Every product has a unique set of characteristics and thus may have a curve that does not follow a standard shape. Each curve tells a story about the business of the product, and all of the data points collectively enable you to tell a more complete story.
Using these curves can be a little complex, though. Take the representation of two different curves depicted in Figure 17.6. Notice that the revenue curve stays higher for a longer period of time and slopes down gradually, while the gross margin curve descends at a more rapid rate. A product manager who believes that sales are going up in year three is not wrong—if that’s the only observation point.
FIGURE 17.6
Product Life Cycle Curves Using Revenue and Gross Margin

As can be seen, though, by year three, the gross margin is already under pressure. Perhaps salespeople are discounting prices and pushing higher volumes, while product costs continue to soar. There could be a host of scenarios that might explain such data. The main point, though, is that the life cycle curve for a product in the market is not really one curve, but many that have to be assembled to compose a story line. Even more important, that story line needs to be put into perspective—a perspective provided by the original Business Case for the product. Figure 17.7 gives you an idea of how this can be achieved.
FIGURE 17.7
Revenue and Gross Margin Curves: Actuals vs. the Business Case

If you examine Figure 17.7 closely, you’ll see that there are now four curves. Two curves represent the revenue and gross margin from the original Business Case, and the other two represent the product’s actual performance. The original Business Case identifies the projected revenue and gross margin for the product over a six-year period of time. Now the story changes because we know that the original Business Case was more optimistic and the business is not doing as well as originally expected. Suddenly, what seemed like a rapidly growing product may actually be showing signs of slightly slower growth.
Using the Business Case allows product managers, in close partnership with their Finance and Marketing counterparts, to set the stage for managing the product in the future. A good method to pave the way for better post-launch performance management is to predetermine and document what the future life cycle state should look like. For example, one could assert in the Business Case that “the product in ‘growth’ should exhibit sales increases of 8 percent year over year with a gross margin of 70 percent.” Then, when the product manager and the team review the product’s performance at some point in the future, they have a standard against which to measure its lifetime performance, not just performance based on an in-year budget that offers no historical perspective. If the Business Case and other supporting financial forecasts are archived in the Product Master Plan repository, the product manager (current or future) can immediately gain the most important viewpoint on where the product is in its (in-market) life cycle state.
Finally, when you pinpoint the product’s correct life cycle state, you can more easily choose the most appropriate investment strategies for the product. If you believe your product is really in the Growth phase, you will likely be investing in product improvements and promotional programs. However, if you misunderstand the product’s life cycle state and invest heavily in a mature product (that you believe is in Growth), you probably won’t reap the kinds of returns you’re expecting, and you would also be using up valuable resources that could be applied to other endeavors. Once the product manager has a view of the product’s place in the market, graphically portrayed, the team’s efforts can be more effectively focused on the most appropriate future strategic options.
Evaluating Financial and Business Data Using Product Scorecards
Suppose you, the product manager, met up with the CEO of your company in an elevator, and she asked you, “What’s going on with your product?” What would you say, and how would you inspire the confidence of the CEO in your role? Imagine you responding like this: “We had a great first quarter, and revenue is up 18 percent over last year!”
Money is the language of business. Financial and other business and market-based measurements give you the best read on product performance. This is the reason that financial management is one of the most important practices for effective product management. Without financial data and associated analyses, there is no way to assess how well the product is performing against established plans. Having a good product performance scorecard provides information about the product’s financial situation, including revenue, costs, and gross margin.
As a quick note, in most complex companies, the actual expenses from organizations such as Marketing, Operations, and R&D are not always driven directly to the individual product’s P&L. Instead, these expenses are allocated to each product by corporate Finance according to predetermined formulas. Because these are generally uncontrollable by the team, I am going to leave these out of the formula and focus solely on unit volumes, pricing, total revenue, cost of goods, and gross margin. Gross margin is a broad yet acceptable measure of product profitability, as I discussed in Chapter 6.
A simple financial scorecard should be used not only for standard monthly and year-to-date analysis but also to show the data from the original Business Case that justified the product’s original investment (if available). This provides the most relevant way to compare the data to indicate whether the financial assumptions of the Business Case are being fulfilled. Figure 17.8 provides a snapshot of a simple spreadsheet you can use to track product financial performance.
FIGURE 17.8
Basic Financial Scorecard for a Product

Simple financial reports as shown in Figure 17.8 only provide a snapshot; they don’t tell the entire story. The team’s perspective will be enhanced if it examines financial information over a period of time. Why? Because patterns and associations between financial data and other performance indicators need to be evaluated to create true portraits of the product’s business performance. As an example, take a look at the five-year snapshots shown in Figure 17.9. With this, you can begin to see trends in actual performance and contributions to the business.
FIGURE 17.9
Product Financial Trends
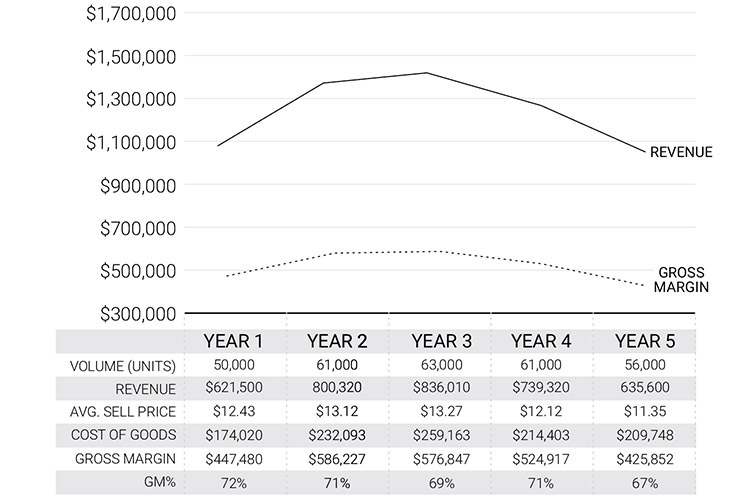
When you have financial information over time, you have the wherewithal to ask questions about relationships between prices, volumes, and costs, and how product profitability is impacted. For example, if your cost per unit increased and your sell price was reduced, you naturally have less revenue and gross margin. Your team must not be surprised by these because proper tracking would have alerted the team to possible competitive threats, supply shortages, or dwindling economic conditions. Therefore, the assembly and visualization of the data is just the starting point; it’s the analysis that’s most important. This analysis must include other influences on the product’s business. These influences include:
![]() The market segments in which the product is sold. Chapter 8 provided a framework to identify and characterize market segments. However, markets don’t stand still and are subject to any number of changes. These impact the attractiveness of a market area and should be assessed at regular intervals. Using the table in Figure 17.10, you should be able to ask and answer the following questions:
The market segments in which the product is sold. Chapter 8 provided a framework to identify and characterize market segments. However, markets don’t stand still and are subject to any number of changes. These impact the attractiveness of a market area and should be assessed at regular intervals. Using the table in Figure 17.10, you should be able to ask and answer the following questions:
FIGURE 17.10
Market Segment Trends
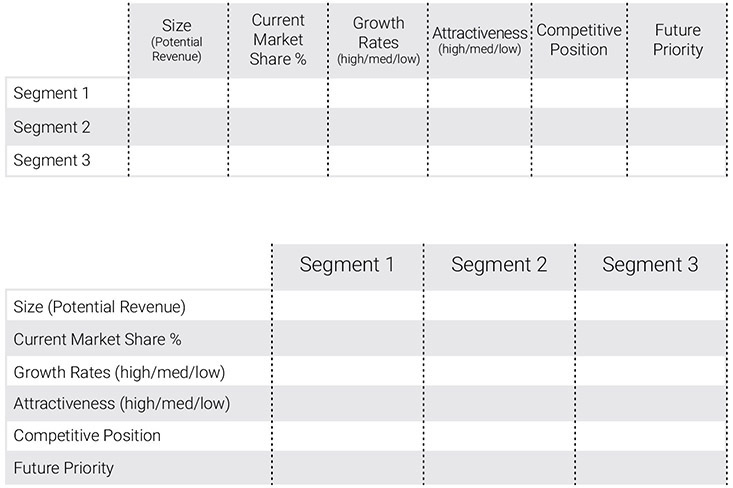
1. How have segment characteristics changed?
2. Are current segments less or more attractive and why?
3. What are the areas of high growth, and where has growth slowed?
4. Where can you play in the future to achieve optimal competitive advantage?
![]() The customers who purchase or use the product. Customer tastes and preferences change. In B2B companies, influencers and decision makers switch jobs. In the consumer world, kids grow up and become independent consumers. Your role is to understand these patterns. I’ve provided a table for you, shown as Figure 17.11, to shape how you might ask and answer the following questions:
The customers who purchase or use the product. Customer tastes and preferences change. In B2B companies, influencers and decision makers switch jobs. In the consumer world, kids grow up and become independent consumers. Your role is to understand these patterns. I’ve provided a table for you, shown as Figure 17.11, to shape how you might ask and answer the following questions:
FIGURE 17.11
Customer Preferences Over Time
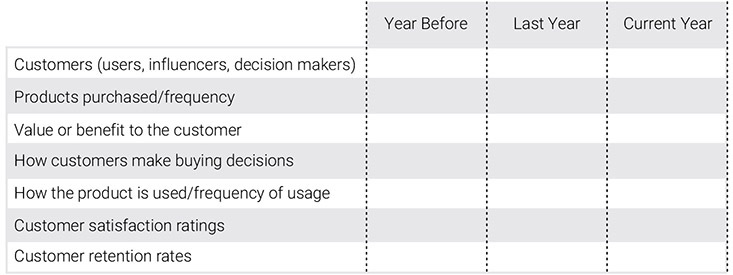
1. What products have been purchased or used?
2. What value do customers perceive? (checking the value proposition)
3. How did customers choose your product?
4. What price did they pay and why?
5. What’s the ideal experience sought, and does the product fulfill this expectation?
![]() Industry and competitive trends. Chapter 7 explained what’s required to carry out industry and competitive analysis. However, as with market segments, industries or sectors evolve as your products are sold. In companies that serve global markets, local issues that involve politics, regulations, the economy, and social trends may influence sales volumes. Competitive intensity may ebb and flow. The overall market environment is, at a minimum, quite turbulent. As shown in the Product Management Life Cycle Model, customer and market insights run as an undercurrent to all activities associated with the product’s business. These insights serve to inform product strategy and determine how product investment decisions are channeled. I’ve provided a table for you, shown as Figure 17.12, to show you how you might ask and answer the following questions with respect to the competitive climate:
Industry and competitive trends. Chapter 7 explained what’s required to carry out industry and competitive analysis. However, as with market segments, industries or sectors evolve as your products are sold. In companies that serve global markets, local issues that involve politics, regulations, the economy, and social trends may influence sales volumes. Competitive intensity may ebb and flow. The overall market environment is, at a minimum, quite turbulent. As shown in the Product Management Life Cycle Model, customer and market insights run as an undercurrent to all activities associated with the product’s business. These insights serve to inform product strategy and determine how product investment decisions are channeled. I’ve provided a table for you, shown as Figure 17.12, to show you how you might ask and answer the following questions with respect to the competitive climate:
FIGURE 17.12
Competitive Trends

1. Who are the primary competitors now?
2. Which competitors have what market share?
3. What have competitors done in the recent past, and how might that influence your next moves?
4. What are the key strengths and weaknesses of those competitors now, and how might you capitalize on those?
5. What are the key implications for your product, your team, and the company?
There are two other areas I want to mention with respect to product performance analysis:
![]() Marketing mix performance
Marketing mix performance
![]() Operational performance
Operational performance
The marketing mix represents the combination of investments in the product, its pricing (value creation) schemes, promotional programs (value communication), and paths to the end customer via the most efficient channels of sales and distribution (value delivery). Recall my discussion on the marketing mix in Chapter 10. Also, there are numerous resources you can use to brush up on your understanding of this model.
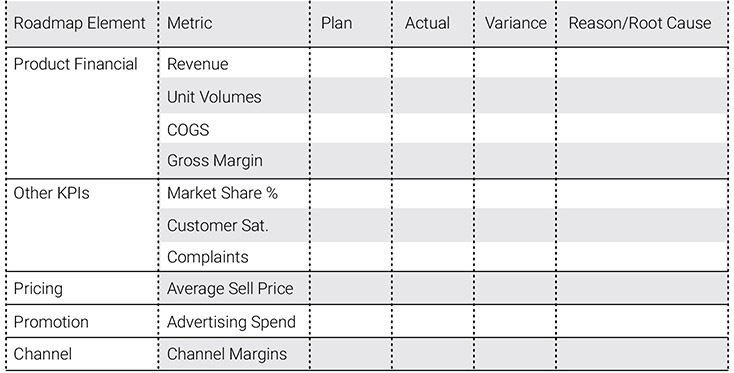
As the product moves through the market, various combinations of marketing mix options are devised, put into place, and tracked. The questions, “What did we do?” and “How well did we do it?” should be constantly asked by the product team so that new strategic actions can be considered and taken. In Figure 17.13, I’ve provided a table for you as an example so that you can work with your team to assess each marketing mix item, how they relate to each other, and how those investments impacted the business. Also, in Figure 17.14, I’ve offered a way for you to evaluate the product’s overall operational performance.
FIGURE 17.13
Evaluating Marketing Mix and Marketing Performance

Unlike a financial table that uses similar headings, when dealing with tables similar to Figures 17.13 and 17.14, the content of each cell can confirm both quantitative and qualitative data. This helps the team discern the plan, evaluate its results, and analyze variances against the plan. This kind of quick variance analysis provides an excellent perspective for figuring out what happened so that adjustments can be made or future opportunities may be capitalized on. By the way, when a variance between two percentages is noted, the variance is taken as the percentage difference between the plan and the actual, not the absolute percentage. For example, if the plan is 50 percent and the actual is 60 percent, the variance is 10 percentage points. The calculation of the variance in that case would be (60% – 50% = 10%)/(50%) = 20%.
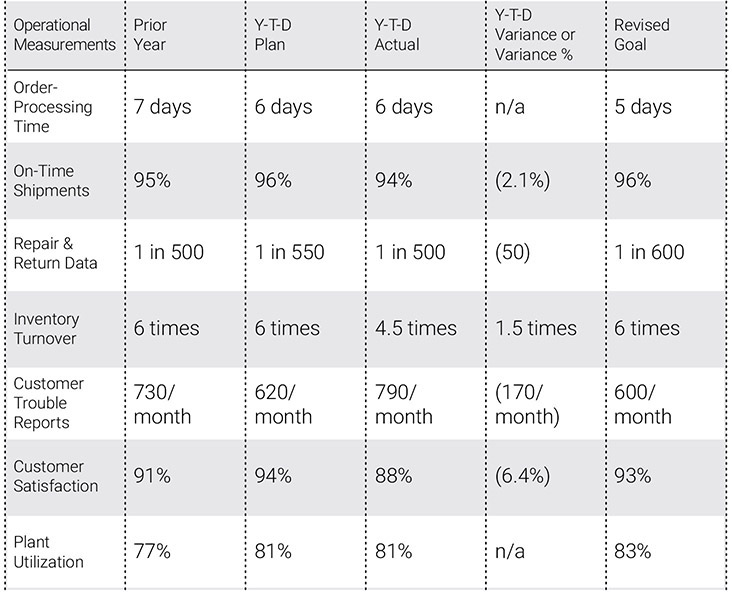
FIGURE 17.14
Evaluating Operational Performance
The evaluation of data shown in Figure 17.13 can be highly insightful because it is set up to tell a story about what’s happening. In this example, sales channel performance shifted to the web. If direct sales activity is slowing, perhaps the team might recommend that sales workforce adjustments (reductions) be considered. On the other hand, this shift could mean that more orders are processed online, so a more detailed analysis is probably the right thing to do before you make a final decision.
As I discussed earlier, when the team is evaluating the current state of the product, it should also focus on the degree to which the operational infrastructure is efficiently supporting the product. Operations usually encompass areas such as procurement, service, information technology, logistics, and others. All companies are organized differently, so you should have a good understanding of your own company’s operational infrastructure.
One of the most important aspects of the business covered by Operations is the efficient sourcing of materials and production of products. Products also need to be moved efficiently from the point of production to distributors or to end customers. Collectively, these operational elements are referred to as a supply chain. There should be a supply-chain participant on the product team to make sure that the team’s strategy is executed through the most efficient sourcing, handling, logistics, and physical distribution.
As an example, a company that sells customized computers requires an efficient, responsive supply chain to make sure that customer orders can be fulfilled and shipped rapidly. On-time shipments would be one supply chain metric that the team would want to manage. If that computer company ships defective products, then repair and return data would reveal these problems, as would a variety of customer complaints. What’s shown in Figure 17.14 could help this hypothetical team to examine a variety of key performance indicators (KPIs), all related to operational dimensions of the product.
Reviewing these financial and nonfinancial indicators should be standard practice for product managers and their teams. By having a broad perspective about how product performance is affected by different aspects of the business, the product manager and the team are in a much better position to revise their plans, consistent with the life cycle state of the product. With the right data and thoughtful evaluation, the team can readily make both short-term and long-term decisions and think about strategic and tactical options to adjust the business to the conditions of the market.
Using a Product Dashboard and a Product Health Report
Imagine driving a car or flying a jet without the proper instrumentation. Not a good idea. In managing the business of your product, the best instrumentation is what provides the context, perspective, and story line to explain what’s happened and what comes next. It allows you to look far enough ahead to reshape your vision, and near enough to make midcourse corrections.
I want to share some ideas with you so that you can assemble your own dashboards and a product health report so that you can easily communicate “what’s happening now” with the product’s business. Refer to Figures 17.15 and 17.16 for some suggestions. Consider items you can include in your dashboard, including:
FIGURE 17.15
Sample Product Business Dashboard

FIGURE 17.16
Sample Product Health Report
1. KPIs—metrics that provide you with the optimal indicators of performance
2. Financial scorecards that include information I shared previously
3. Marketing or operational information
4. Visual indicators that portray the product life cycle curve
PRICING AND PRODUCT PERFORMANCE
Pricing is a vital linchpin in the attainment of results in your company. Consider this: Warren Buffet, the CEO of Berkshire Hathaway, once said, “The single most important decision in evaluating a business is pricing power. . . . If you’ve got the power to raise prices without losing business to a competitor, you’ve got a very good business. And if you have to have a prayer session before raising the price by 10 percent, then you’ve got a terrible business.”
Pricing is one of the most influential control levers of the marketing mix. In my mind, price is the zone where a customer’s problem and your solution intersect. If you don’t have the benefit needed at the time the need is present—and if you don’t have the competitive advantage needed to influence that customer’s decision at that time—it’s “no sale.”
When products are actively competing in the market, conditions may warrant updates or adjustments to your pricing. However, consistent with the theme of this chapter, it is your responsibility to constantly assess product pricing and its impact on product profitability.
In many companies, you may not even have direct control of product pricing because there’s either a separate pricing group or prices are set by senior leadership teams. In this case, you need as much market intelligence as possible, a deep understanding of the overall business of the product—and you have to be in a position to be part of the conversation about pricing.
In my research, I’ve learned that some techniques that companies employ contribute greatly to positive outcomes. Mind you, not every pricing strategy fits with every company’s strategy. Further, there are numerous market dynamics that can impact your approach to pricing.
As I indicated in Chapter 10, pricing strategy must fit within the context of the other marketing mix elements, especially in setting or updating the goals and strategies for your product. Some of the goals that could help your product’s business are those that include the following:
1. Enhancement of gross margin. Many firms find success in programs to drive cost out of the business or improve processes to stimulate efficiencies.
2. Adjustments in pricing structures. As software and technology continue to grow, standard one-time prices plus support have been supplanted by software as a service with subscription pricing. In other firms, a “freemium” model introduces limited functionality to subscribers for free, but adds fees for premium functionality.
3. Improvement of top-line revenue by selling more high-value products or capabilities to current customers.
4. Creation of adjacent product or brand categories. This approach is designed to stimulate demand from adjacent market segments. For example, a premium house paint company targeted at high-end applications can introduce a “contractor-grade” blend at a lower price point to sell higher volumes to builders who need to paint new houses quickly and efficiently.
When it comes to product performance management, as mentioned frequently, data is your guide. We’ve learned much from consumer companies that constantly process huge amounts of data. In my work with B2B companies, I find that product managers don’t have full access to the data, or don’t analyze elements of pricing data, including discounting practices. The biggest lament of product managers in complex companies where sales teams bid on big deals is “we lost because of price.” I’d say there are more reasons than that. Efficient analytics can link PRESTO factors (see Chapter 7) and segment needs and trends, mentioned in this chapter as well as Chapter 8.
From another standpoint, consider actions that are within your span of control. This could mean fortifying your relationships with your Sales and Marketing organizations to ensure that messaging, positioning, and value propositions are easily digested by the sales team. You can also work with Sales leaders to find out how sales targets are determined, or if salespeople are properly compensated. Everyone will benefit if Sales is trained to focus on value delivery, not discounting to get the deal.
UPDATING YOUR PRODUCT ROADMAP
As your product’s business progresses, results obtained will likely vary from what was originally envisioned. That’s the essence of what’s been discussed in this chapter. However, as I discussed in Chapter 10, you’ll likely be called upon to produce or update a product roadmap as you restrategize and recalibrate. Also, as I indicated in that chapter, the roadmap is a method to portray, visualize, and integrate the elements that encompass the evolution of your product. Therefore, remember the templates shown in Figures 10.19 and 10.20 to update your roadmap.
Remember, roadmaps help you integrate business, financial, and market information with the evolution of product capabilities, technologies, and platforms. When used consistently, they can set the stage for more effective prioritization and can set the cadence for the work to drive the future of the product’s business, as represented by the Product Management Life Cycle Model.
SUMMARY
If you’re like most product managers, you want your product to be exemplary: to deliver results to the bottom line and to afford you the level of visibility and credibility you deserve. However, when you really think about it, there’s a lot of work to do to make this happen.
The guidance I provided in Chapters 7 through 10 serves as a solid foundation for you to understand the essential building blocks to create outstanding products. Creativity isn’t just about conceiving of something new; it can cover any aspect of a product’s business so that you can establish the forward momentum required to succeed over the long term. This means you need to be able to collect and evaluate a portfolio of data, organize and assess metrics, and determine the next steps.
As you begin to harness and evaluate product performance measures, just as I discussed in Chapter 10, you’ll quickly learn that you need both historical and current measures to produce meaningful perspectives; single data observations just won’t do. Further, as you evaluate various measurements, you’ll soon discover that additional data is required to help you in your evaluations.
In addition, if you adopt an approach that utilizes dashboards and other tools to guide your way, you’ll have the information at your fingertips to motivate your team and deliver results. Don’t forget, as the product manager, you are responsible for integrating various data elements and leveraging your cross-functional product team to continually evaluate the product’s measurements so that you and the team gain the most complete perspective on the product’s performance. This is vital so that you can continue to point your product’s business in the right direction.