
APPENDIX
![]()
Figures and Tables
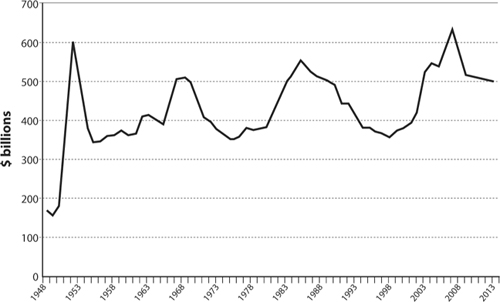
FIGURE A.1: Department of Defense Annual Budget Authority, 1948–2013 (Constant FY 2009 $)
Source: DoD, “National Defense Budget Estimates for FY 2009,” pp. 109–14.
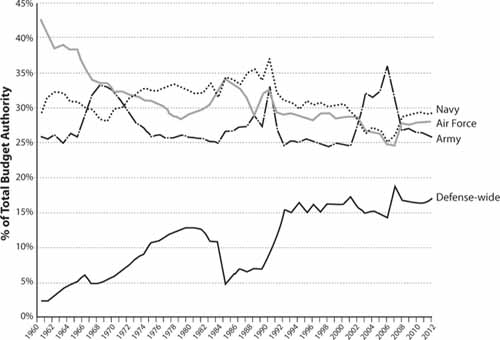
FIGURE A.2: Department of Defense, Budget Authority by Service, FY 1960–2013
Source: http://www.defenselink.mil/comptroller/defbudget/fy2009/FY09Greenbook/greenbook_2009_updated.pdf, (pp. 67–72).
Note: For 1991, the official percentage of the budget authority for “Defense-wide” spending was −3 percent. This was due to foreign contributions to Operation Desert Storm. This is not depicted in the graph above since the curve was flattened between the years 1990 and 1992.
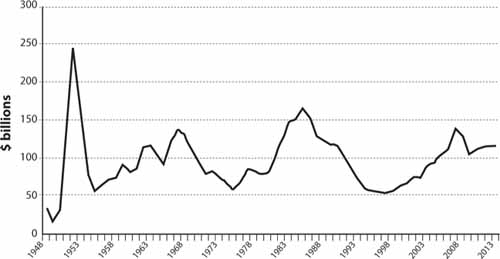
FIGURE A.3: Department of Defense Annual Budget Authority for Procurement, FY 1948–2013 (Constant FY 2009 $)
Source: U.S. Department of Defense, “National Defense Budget Estimates for FY 2009,” pp. 103–8.
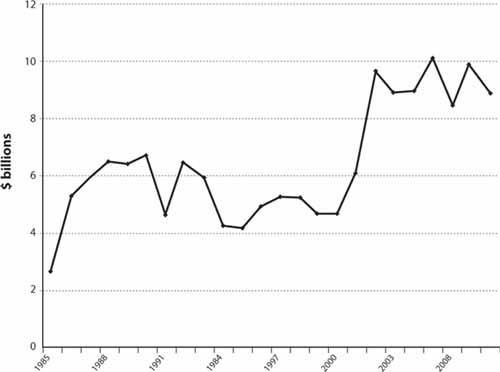
FIGURE A.4: Historical Funding for the Missile Defense Agency and Its Predecessors (Constant FY 2009 $)
Source: www.mda.mil/mdaLink/pdf/histfunds.pdf.
Note: Historical funding levels are for Strategic Defense Initiative Organization (SDIO), the Ballistic Missile Defense Organization (BMDO), and the Missile Defense Agency (MDA). SDIO was the predecessor to the MDA. Some missle defense funding is outside these agencies.
TABLE A.1
U.S. Military Annual Active Duty Personnel End Strength, 1960–2009
YEAR |
TOTAL |
Army |
Navy |
Marines |
Air Force |
1960 |
2,492,037 |
877,749 |
624,895 |
175,919 |
813,474 |
1961 |
2,552,912 |
893,323 |
641,995 |
185,165 |
832,429 |
1962 |
2,687,690 |
962,712 |
662,837 |
192,049 |
870,092 |
1963 |
2,695,240 |
961,211 |
668,626 |
189,937 |
875,466 |
1964 |
2,690,141 |
972,546 |
670,160 |
189,634 |
857,801 |
2,723,800 |
1,002,427 |
690,162 |
198,328 |
832,883 |
|
1966 |
3,229,209 |
1,310,144 |
740,646 |
280,641 |
897,778 |
1967 |
3,411,931 |
1,468,754 |
749,299 |
299,501 |
894,377 |
1968 |
3,489,588 |
1,516,973 |
759,163 |
308,138 |
905,314 |
1969 |
3,449,271 |
1,514,223 |
764,867 |
311,627 |
858,554 |
1970 |
2,983,868 |
1,293,276 |
677,152 |
246,153 |
767,287 |
1971 |
2,626,785 |
1,050,425 |
615,767 |
204,738 |
755,855 |
1972 |
2,356,301 |
849,824 |
593,135 |
199,624 |
713,718 |
1973 |
2,231,908 |
791,460 |
566,653 |
192,064 |
681,731 |
1974 |
2,157,023 |
784,128 |
546,464 |
192,174 |
634,257 |
1975 |
2,104,795 |
775,301 |
532,270 |
195,683 |
601,541 |
1976 |
2,083,581 |
782,668 |
527,781 |
189,851 |
583,281 |
1977 |
2,074,543 |
782,246 |
529,895 |
191,707 |
570,695 |
1978 |
2,062,404 |
771,624 |
530,253 |
190,815 |
569,712 |
1979 |
2,027,494 |
758,852 |
523,937 |
185,250 |
559,455 |
1980 |
2,050,826 |
777,036 |
527,352 |
188,469 |
557,969 |
1981 |
2,082,897 |
781,473 |
540,502 |
190,620 |
570,302 |
1982 |
2,108,612 |
780,391 |
552,996 |
192,380 |
582,845 |
1983 |
2,123,349 |
779,643 |
557,573 |
194,089 |
592,044 |
1984 |
2,138,157 |
780,180 |
564,638 |
196,214 |
597,125 |
1985 |
2,151,032 |
780,787 |
570,705 |
198,025 |
601,515 |
2,169,112 |
780,980 |
581,119 |
198,814 |
608,199 |
|
1987 |
2,174,217 |
780,815 |
586,842 |
199,525 |
607,035 |
1988 |
2,138,213 |
771,847 |
592,570 |
197,350 |
576,446 |
1989 |
2,130,229 |
769,741 |
592,652 |
196,956 |
570,880 |
1990 |
2,046,144 |
732,403 |
581,856 |
196,652 |
535,233 |
1991 |
1,986,259 |
710,821 |
570,966 |
194,040 |
510,432 |
1992 |
1,807,177 |
610,450 |
541,883 |
184,529 |
470,315 |
1993 |
1,705,103 |
572,423 |
509,950 |
178,379 |
444,351 |
1994 |
1,610,490 |
541,343 |
468,662 |
174,158 |
426,327 |
1995 |
1,518,224 |
508,559 |
434,617 |
174,639 |
400,409 |
1996 |
1,471,722 |
491,103 |
416,735 |
174,883 |
389,001 |
1997 |
1,438,562 |
491,707 |
395,564 |
173,908 |
377,385 |
1998 |
1,406,830 |
483,880 |
382,338 |
173,142 |
367,470 |
1999 |
1,385,703 |
479,426 |
373,046 |
172,641 |
360,590 |
2000 |
1,384,338 |
482,170 |
373,193 |
173,321 |
355,654 |
2001 |
1,385,116 |
480,801 |
377,810 |
172,934 |
353,571 |
2002 |
1,411,634 |
486,542 |
383,108 |
173,733 |
368,251 |
2003 |
1,434,377 |
499,301 |
382,235 |
177,779 |
375,062 |
2004 |
1,426,836 |
499,543 |
373,197 |
177,480 |
376,616 |
2005 |
1,389,394 |
492,728 |
362,941 |
180,029 |
353,696 |
2006 |
1,384,968 |
505,402 |
350,197 |
180,416 |
348,953 |
1,379,551 |
522,017 |
337,547 |
186,492 |
333,495 |
|
2008* |
1,385,122 |
531,526 |
331,785 |
193,040 |
328,771 |
Source: Department of Defense, Military Personnel Statistics web site
Note: Unless otherwise noted, figures are as of September 30 for each year, which corresponds to the end of the fiscal year, and do not include activated reservists.
*As of June 30, 2008
TABLE A.2
U.S. Troops Based in Foreign Countries (As of June 30, 2008)
Country or Region |
Total |
Europe |
1,301 |
Germany |
55,145 |
Italy |
9,515 |
Netherlands |
552 |
Portugal |
792 |
Serbia (includes Kosovo) |
1,289 |
Spain |
1,238 |
Turkey |
1,570 |
United Kingdom |
9,613 |
Afloat |
848 |
Other |
958 |
TOTAL |
82,821 |
|
|
Former Soviet Union |
144 |
32,966 |
|
Korea |
25,374 |
Afloat |
8,975 |
Other |
774 |
TOTAL |
68,089 |
|
|
North Africa, Near East, and South Asia |
1,504 |
Afloat |
2,222 |
Other |
1,648 |
TOTAL |
5,374 |
|
|
Sub-Saharan Africa |
1,900 |
Other |
325 |
TOTAL |
2,225 |
|
|
Western Hemisphere |
980 |
Other |
1,114 |
TOTAL |
2,094 |
|
|
Undistributed |
112,910 |
Afloat |
6,168 |
119,078 |
|
|
|
TOTAL- Foreign Countries |
279,825 |
|
|
Ashore |
261,602 |
Afloat |
18,223 |
|
|
DEPLOYMENTS |
183,100 |
Operation Enduring Freedom |
31,700 |
TOTAL |
214,800 |
|
|
Deployed from Locations for OIF/OEF (outside U.S.) |
18,300 |
Italy |
2,200 |
Japan |
2,400 |
Korea |
100 |
United Kingdom |
950 |
TOTAL |
23,950 |
Source: DoD Personnel Statistics; http://siadapp.dmdc.osd.mil/personnel/MILITARY/history/hst0806.pdf.
Note: Only countries with at least 500 troops are listed individually.
TABLE A.3
Selected Acquisition Report (SAR) Program Acquisition Cost Summary (As of December 31, 2007 in Millions of Dollars)
|
|
Current Estimate |
|
|
Weapons System |
Base Year |
Base Year $ |
Current $ |
Quantity |
Army |
2006 |
7,158 |
8,996 |
639 |
ARH |
2005 |
5,260 |
6,337 |
512 |
ATIRCM/CMWS |
2003 |
4,170 |
4,816 |
3,589 |
Black Hawk upgrade |
2005 |
18,935 |
24,043 |
1,235 |
Bradley upgrade |
2001 |
8,570 |
9,695 |
2,568 |
CH-47F |
2005 |
11,516 |
13,350 |
513 |
Excalibur |
2007 |
2,233 |
2,465 |
30,388 |
FBCB2 |
2005 |
3,220 |
3,371 |
73,463 |
FCS |
2003 |
112,425 |
159,320 |
15 |
FMTV |
1996 |
16,517 |
20,676 |
83,185 |
GMLRS |
2003 |
4,718 |
6,008 |
43,795 |
HIMARS |
2003 |
1,797 |
2,049 |
381 |
Javelin |
1997 |
4,694 |
4,924 |
25,463 |
JLENS |
2005 |
6,089 |
7,500 |
16 |
Longbow Apache |
1996 |
9,826 |
11,183 |
671 |
AUH |
2006 |
1,820 |
2,090 |
345 |
Patriot PAC-3 |
2002 |
8,387 |
8,525 |
969 |
Patriot/MEADS CAP – |
2004 |
15,808 |
21,780 |
48 |
2004 |
6,027 |
8,116 |
1,528 |
|
Stryker |
2004 |
14,255 |
15,691 |
3,537 |
WIN-T increment 1 |
2007 |
3,798 |
3,860 |
1,677 |
WIN-T increment 2 |
2007 |
3,446 |
3,871 |
1,893 |
Subtotal, Army |
|
270,667 |
348,667 |
|
|
|
|
|
|
Navy |
2005 |
552 |
529 |
— |
AGM-88E AARGM |
2003 |
1,426 |
1,710 |
1,911 |
AIM- 9X |
1997 |
2,664 |
3,396 |
10,142 |
CEC |
2002 |
4,207 |
4,531 |
306 |
CH-53K |
2006 |
15,025 |
18,708 |
156 |
Cobra Judy replacement |
2003 |
1,453 |
1,630 |
1 |
CVN 21 |
2000 |
24,987 |
35,119 |
3 |
CVN 68 |
1995 |
5,279 |
6,259 |
1 |
DDG 1000 |
2005 |
25,090 |
28,887 |
7 |
DDG 51 |
1987 |
46,418 |
62,756 |
62 |
E-2D AHE |
2002 |
13,394 |
17,431 |
75 |
EA-18G |
2004 |
7,578 |
8,649 |
85 |
EFV |
2007 |
13,164 |
15,860 |
593 |
ERM |
2005 |
1,288 |
1,521 |
15,100 |
F/A-18 E/F |
2000 |
43,258 |
46,345 |
493 |
1996 |
6,750 |
8,728 |
284 |
|
JSOW - Baseline/BLU-108 |
1990 |
1,476 |
1,862 |
3,334 |
JSOW - Unitary |
1990 |
1,777 |
2,725 |
7,000 |
LCS |
2004 |
2,595 |
2,849 |
2 |
LHA replacement |
2006 |
3,079 |
3,368 |
1 |
LPD 17 |
1996 |
11,508 |
14,242 |
9 |
MH-60R |
2006 |
11,279 |
12,139 |
254 |
MH-60S |
1998 |
6,504 |
7,843 |
271 |
MUOS |
2004 |
5,667 |
6,682 |
6 |
NMT |
2002 |
1,677 |
2,103 |
305 |
P-8A (MMA) |
2004 |
26,183 |
32,853 |
113 |
RMS |
2006 |
1,380 |
1,550 |
108 |
SM-6 |
2004 |
4,693 |
5,954 |
1,200 |
SSDS |
2004 |
557 |
669 |
42 |
SSGN |
2002 |
3,867 |
4,109 |
4 |
SSN 774 (Virginia Class) |
1995 |
63,752 |
91,965 |
30 |
T-45TS |
1995 |
6,735 |
6,828 |
223 |
Tactical Tomahawk |
1999 |
3,706 |
4,375 |
3,292 |
T-AKE |
2000 |
4,618 |
5,715 |
12 |
Trident II missile |
1983 |
26,382 |
38,817 |
561 |
V-22 |
2005 |
50,473 |
54,227 |
458 |
2003 |
5,732 |
6,750 |
28 |
|
VTUAV |
2006 |
1,875 |
2,158 |
177 |
Subtotal, Navy |
|
458,047 |
571,841 |
|
|
|
|
|
|
Air Force |
2002 |
6,738 |
7,362 |
4 |
AMRAAM |
1992 |
13,156 |
14,881 |
13,953 |
B-2 EHF increment I |
2007 |
636 |
681 |
21 |
B-2 RMP |
2004 |
1,094 |
1,225 |
21 |
C-130 AMP |
2000 |
4,521 |
5,800 |
222 |
C-130J |
1996 |
9,805 |
12,029 |
134 |
C-17A |
1996 |
58,665 |
62,307 |
190 |
C-5 AMP |
2006 |
1,377 |
1,405 |
112 |
C-5 RERP |
2000 |
8,478 |
11,131 |
111 |
F-22 |
2005 |
66,992 |
64,540 |
184 |
FAB-T |
2002 |
2,963 |
3,622 |
222 |
GBS |
1997 |
727 |
806 |
1,121 |
Global Hawk (RQ-4A/B) |
2000 |
8,102 |
9,741 |
54 |
JASSM |
1995 |
4,466 |
6,066 |
5,006 |
JDAM |
1995 |
4,522 |
5,260 |
201,993 |
JPATS |
2002 |
4,915 |
5,534 |
768 |
Minuteman III GRP |
1993 |
2,095 |
2,428 |
652 |
1994 |
2,190 |
2,602 |
601 |
|
MP RTIP |
2000 |
1,115 |
1,225 |
- |
MPS |
2004 |
1,394 |
1,583 |
1 |
NAS |
2005 |
1,424 |
1,491 |
91 |
NAVSTAR GPS – Space and Control |
2000 |
5,963 |
6,306 |
33 |
NAVSTAR GPS - User Equipment |
2000 |
1,791 |
2,094 |
- |
NPOESS |
2002 |
9,363 |
11,140 |
4 |
SBIRS High |
1995 |
9,559 |
11,556 |
4 |
SDB I |
2001 |
1,252 |
1,477 |
24,070 |
WGS |
2001 |
1,764 |
1,951 |
5 |
Subtotal, Air Force |
|
235,065 |
256,240 |
|
|
|
|
|
|
DoD |
2002 |
89,398 |
102,912 |
- |
CHEM DEMIL- ACWA |
1994 |
5,499 |
7,992 |
3,136 |
CHEM DEMIL- CMA |
1994 |
22,459 |
27,423 |
29,060 |
DIMHRS |
2007 |
850 |
819 |
1 |
F-35 (JSF) |
2002 |
210,015 |
298,843 |
2,456 |
JTRS GMR |
2002 |
14,243 |
20,536 |
86,652 |
JTRS HMS |
2004 |
2,672 |
3,367 |
95,961 |
JTRS NED |
2002 |
1,743 |
1,962 |
- |
2003 |
2,289 |
2,373 |
3,807 |
|
Subtotal, DoD |
|
349,168 |
466,226 |
|
|
|
|
|
|
GRAND TOTAL |
|
1,312,947 |
1,642,974 |
|
Source: http://www.acq.osd.mil/ara/am/sar/2007-DEC-SARSUMTAB.pdf.
Note: Totals may not add up exactly as shown due to rounding. Each weapon is assigned a base year based on key milestones in its development; costs as expressed in “base year dollars” are measured in that base year’s constant dollars. Procurement costs, as well as research, development, test, and evaluation costs, are included.