CHAPTER 9
The Gift of Clarity
INVESTING AND PORTFOLIO MANAGEMENT
Most of the information you read, hear, or watch pertaining to investing is either too simplistic or too complicated to be effectively implemented in your investment strategy. If you attempt to react to the minute details of each bit of market or economic news hitting the CNBC ticker, you’ll likely first, go crazy, and second, struggle to maintain any consistency in your investing. Conversely, the buy-and-hold strategy is entirely too simplistic. From the day the market peaked on September 7, 1929, it would have taken until 1954 just to break even if you bought and held. That is a pretty long time to wait, especially if you were planning to retire in 1932. Although some seem to treat it as such, the market is not a benevolent spiritual force that promises to grow our money as long as we’re willing to invest it over a long stretch of time.
Some very well-intended and gifted financial educators have attempted to minimize portfolio management to a newsletter, book, or chapter and have oversimplified it in doing so. Many who followed their advice saw their portfolios—made up of only a handful of prominent large-cap growth mutual funds—sawn nearly in half, twice, in the decade ending in 2009. You will not find an all-encompassing investing how-to in the following pages. It is, instead, our design to pull back the veil on the industry norms and invite you into further exploration.
Ultimate Advice
I am more concerned about the return of my money than the return on my money.
Mark Twain
Mark Twain was the first (of several) to wittily claim that he was more concerned with capital preservation (the return of my money) than growth (the return on my money), but it is interesting to note that Twain passed away in 1910, prior to the Great Depression. I have another phrase that I’d like you to chew on:
It is easier to lose money than it is to make it!
That’s not a catchy slogan or tagline. It’s a mathematical fact. If you have $100 and you lose 10 percent of it, it will take an 11 percent rate of return to get back where you started. If you lose 20 percent, you’ll need to make 25 percent to become whole. What if you lose 50 percent? What rate of return would you need to make your money back? The answer is an astonishing 100 percent!
Once you’re down 50 percent and facing that big 100 percent hill, it will take around seven years, if you’re able to make an annualized rate of 10 percent per year, to get back where you started. If you’re making closer to seven percent each year, you’ll be waiting a full decade to break even. If you earn four percent on your money, it will take you 18 years to recover from a 50 percent fall.
Can you see Wall Street looking down its collective nose, reminding Mr. Twain that he was no investment expert, broker, or financial advisor? That’s true, but he was an expert on life, a subject on which Wall Street could use some lessons. Infusing a bit more life into your investment process and reorienting your focus to regard the preservation of your dollars invested at least as highly as their growth is a good first step.
The last decade—2000 through 2009—is not-so-lovingly known as “The Lost Decade”1 thanks to the market’s logging a negative return in that stretch. Prior to that, from 1982 until March of 2000, the market ran upward with little impedance. But what about the stretch from 1964 through 1982? Believe it or not, that span represented yet another 18 years in which the pure buy-and-holder would’ve made nothing—zip, zilch, nada. And we in the United States have it good! Japan is still enduring an atrocious slide of over 20 years leaving the Nikkei still 70 percent south of its peak.
The world’s best investors are not buy-and-holders. They’re risk managers. These are folks like Sir John Templeton, Jean-Marie Eveillard, Jim Rogers, and yes, Warren Buffett. They spend more time worrying about how not to lose money than they do trying to make it (although they do a fair bit of that as well). I’m not suggesting leaving all your money in T-bills and CDs. I’m asking you to shift your strategy to focus first on managing risk in your investments, then on your return. But first, we must step back and provide a backdrop for this multifaceted realm of investing.
In this age of colloquial investing, most are familiar with buzz terminology like asset allocation but unable to define the assets being allocated (stocks and bonds) or the instruments most often used to manage them (mutual funds). Purchasing a company’s stock makes you a part owner of a company. When you own a share of stock, you’re entitled to the privileges that come with ownership, including dividends paid by the company, gains in the value of the company when you sell, and a seat at the table with the company decision-makers proportionate to the amount of stock you own (and the corresponding risk of investment loss).
Stocks are helpfully categorized as value or growth stocks. Value companies are often blue chip companies whose names have been on the ticker for generations. They are in a mature phase of the company life cycle. Typically, their stock price will be less volatile than a growth company and investors are also rewarded with a share of the company’s profit in the form of dividends paid to shareholders. Growth companies are in the more formative stages of the company life cycle. They are still making their presence and purpose known in the world and rarely pay dividends, seeking instead to plow that money back into further growth opportunities for the company. Their investment risk is perceived as greater than the blue chip companies, but the opportunity for growth is also expected to be greater.
Stocks are also often grouped by their size or market capitalization. And, indeed, material differences are found in the way large cap, mid cap, and small cap stocks react to various market stimuli. A company’s market capitalization is computed by multiplying the number of outstanding shares (the number of shares owned) by the share price. Although it starts to sound like Monopoly money as we get into it, small cap companies are generally thought of as those with a market cap under $1 billion; mid cap between $1 and $10 billion; and large cap beyond $10 billion. Generically, the smaller the market capitalization, the more volatile a stock tends to trade. Volatility, then, is the degree to which a stock’s trading peaks and valleys are dramatic.
Bond ownership positions you as the creditor of a company, municipality, or sovereign nation. If you are willing to loan the entity $10,000, for instance, it pledges to pay you a set interest rate over a stated period of time based on prevailing interest rates and the creditworthiness of the entity. Creditworthiness rates the entity’s ability to pay you back. The lesser the creditworthiness, the greater the interest the entity is forced to pay to attract lenders. If you hold the bond until maturity, you’ll get your initial principal investment back with your final interest payment. But, as interest rates rise and fall in the interim or the creditworthiness of the entity fluctuates, the value of your bond in the open market will also vacillate.
When the stock market is flying high, in order to attract new bond investors, companies are forced to pay higher rates of interest. When our recent market collapse became most convincing in the latter part of 2008, the “flight to safety” from stocks to U.S. Treasury bonds was so fast and furious that the price of bonds jumped higher, bringing the yields—the interest rates paid on the bonds—on those debt instruments down dramatically. Treasuries are considered to have no risk of default since they’re backed by the full faith and credit of the U.S. government. In times of economic and market turmoil, it is very important to keep your eye on prices and interest rates of debt instruments (like bonds) from the U.S. Treasury and public corporations. When in a more normal economic environment, the difference between the interest rates of Treasury bonds and investment-grade corporate bonds (known as the spread) is minimal, but when people are really scared, the spread widens noticeably. In the direst days of our recent panic, that spread was three times wider than normal.
Have you ever heard anyone say, “All things considered equal . . .” and then follow it up with a statement? He or she may just be an economist. It’s like saying, “If everything happens the way I expect it to, I’ll be home on time for dinner.” It’s really an out. In economics, enormous models are created with assumptions too numerous to count, and the aforementioned phrase gives the economist an out when circumstances beyond his or her control change. This phrase is especially important in the management of investment portfolios, because the bulk of today’s investment methods are built on this pretext, for better or worse.
All things considered equal, stocks are more risky than bonds. Growth companies, more risky than value companies. Small companies, more risky than large companies. International countries and companies, more risky than the United States and companies domiciled here. In investing circles, each of these categories is called an asset class. If all things were equal, the above presumptions would hold true. But, especially in the world of investments, all things are never equal! They’re in a constant state of flux.
Departing momentarily from theory into reality, consider the notion that instead of risk being determined by asset class, risk is determined by the price of that asset and your intimate understanding of its value. The risk of a particular asset is not correlated to its label, but instead, its price tag.
Timeless Truth
You need to know what you’re buying and why you’re buying it.
Suppose you live in a neighborhood on a court with five other houses. Each of these houses is identical to the other and is presumed to have a market value of $350,000. Your next-door neighbor comes to you with a request: He’s been offered a job if he can relocate in under a month, and he’d like you to purchase his home—an exact replica of yours—for its current market value of $350,000. You’d like to help him out, but you think that in this current real estate market, you’d be taking on a lot of downside risk, with little to gain. Sorry, pal.
He comes back the next day and says that after talking with his wife, they understand your hesitation and would drop the price to $300,000. You remind him that marketing and transaction costs alone could easily cost 10 percent of the home’s value, so you still stand to gain very little considering the deadlocked real estate market.
Each day, he offers to sell you the house for yet another lower price. Each day you decline . . . until he gets all the way down to $225,000. You know it’s a crazy real estate market, but you also know this particular investment very well—after all, your house is an exact replica. Even if you spent $35,000 in marketing and transaction costs, the house would have to drop in value an additional $90,000, or 25%, before you’d start losing money. We’ve got a deal!
Even though for a seller this is one of the toughest real estate markets that this country has ever seen, the primary determinant on the level of risk in the asset was not its asset class, but its price. The same is true of stock and bond market investments, and although this seems obvious, it runs contrary to prevailing investment “logic.” Your knowledge—or the knowledge of your advisor or mutual fund manager—also has a great deal of bearing on the confidence with which you should transact. If you don’t know what you’re buying, or your advisor can’t adequately explain it in a way that you can understand, don’t buy it.
Jim Stovall
A mutual fund is a collection of securities—usually stocks and/or bonds and some amount of cash (although mutual funds can own actual commodities like gold bullion and a variety of derivative contracts like options and futures). Since the vast majority of investing is done inside mutual funds or similar accounts managed by a third party, our discussion will center on these vehicles.
Mutual funds are sold as load and no-load mutual funds. Each variety has expenses you must bear—some visible and others harder to find. You should know up front whether or not there is a commission to purchase the product and, if so, when the consumer must pay the commission. Additionally, there are management expenses and trading costs. Management expenses are quantified for investors, but their cost is not visible as a statement line item. They are consumed from the value of your shares throughout the year. Trading costs are the hardest of all costs to quantify, but mutual funds that buy and sell their inventory regularly may have high trading costs that are indirectly borne by the mutual fund investor.
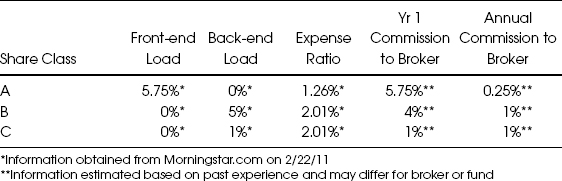
Load funds are mutual funds purchased through a stockbroker compensated by a commission. The three most common share classes are nicely alphabetized—A, B, and C shares. The original form of mutual fund shares was the A share. A shares have a front-end load or commission which is consumed from the investor’s initial deposit. Subsequent deposits will also be charged this up-front commission. The amount of commission is typically between three percent (for some bond mutual funds) and up to six percent (for stock mutual funds). In the latter example, if you put $10,000 into a mutual fund, $600 is initially taken off the top to feed the broker and brokerage firm while $9,400 goes to work inside of the fund. A shares typically have the lowest ongoing management expenses of these three share classes, but they pay your broker the most up front.
B shares have a back-end load structure. You invest your money and it appears to have no up-front commission, but it has a higher management expense ratio and charges a contingent deferred sales charge of up to seven percent if you leave the fund within the first several years. This share class appears to have little reason to exist for the benefit of investors, but it is the variety that may pay your advisor the most over time. While a typical A share pays the broker 5.75 percent up front, a comparable B share may pay four percent up front to the broker with an additional one percent each additional year, so if the broker can keep you in the fund, more commission will be received than with an A share.
Ultimate Advice
A notable red flag for an investment product is any form of back-end load or surrender charge. The investments you choose should be good enough to keep your business without holding you hostage with a penalty if you leave them in the first several years. There are exceptions, but very few.
C shares function the most like a fee-based account, but have no doubt that they are a commission-sold product. They have no front-end load and no back-end load (unless you sell within the first 12 months, in which case you are typically charged a one percent surrender charge), but they often have a higher management expense. C shares typically pay the broker one percent up front and also in each successive year.
See the example in Table 9.1 of how a common mutual fund breaks down across the A, B, C spectrum.
Table 9.1 Putnam Voyager
No-load mutual funds should not be seen as no-cost mutual funds, but instead as no-commission mutual funds. The Fidelity Contrafund and the American Funds’ Growth Fund of America are two of the largest mutual funds in existence and are both considered large cap growth funds. The Growth Fund of America charges a commission of 5.75 percent up front and has annual expenses of .69 percent, while the Contrafund has no commission, and a higher expense ratio of 1.01 percent. In general, the more exotic an asset class, the higher the expense ratio will be. Matthews Asia Pacific is a fund doing research geographically in Asia and expectedly has a higher expense ratio (1.28%).2 The key in analyzing expense ratios—especially in no-load mutual funds—is not to allow your decision to be entirely led by the expense ratio. The objective is to understand what you are getting for the expenses paid. Phenomenal investment management is rare, and it is worth paying for, within reason.
Ultimate Advice
Unfortunately, Red Stevens didn’t have the opportunity to personally experience seeing the redemption of character in his grandnephew, Jason, because he waited too long to address the problem. We have a tendency to be slow to address investing mistakes because we believe they represent a deficit in our own judgment, or worse yet, our character.
Too many times, I’ve seen investors who’ve been recently clobbered insist that they must hold on to the asset that lost so much of their money. While there are times patience may be the right course, I often must sadly inform these investors that “Your stock, bond, or mutual fund doesn’t know where you bought it.” “What do you mean?” they reply. Then I explain that a given security is going to do whatever its future holds regardless of our emotional attachment to the price at which it was purchased. Therefore, the best move forward—which often may involve selling at a loss—is simply the best move forward.
There are as many different approaches to investment management as there are serious investors, but most of them fit into one or more of these three lenses through which we view the investment landscape: economic analysis, valuation analysis, and cyclical or technical analysis.
Are national and global economics important in investing? Unless you’ve been living under a rock for the last several years, don’t need a place to live, and have no interest in a job, you know that national and global economics have significant bearing on how markets operate. The Federal Reserve, Congress, and, only occasionally, the President, have a significant impact on what happens to our market and real estate investments.
In advance of the widely hyped computer meltdown that was supposed to happen when 1999 turned into 2000, then-Federal Reserve chairman, Alan Greenspan, began lowering interest rates to make liquid cash more available and, hopefully, prop up the markets proactively. With the bursting of the tech bubble in early 2000, followed by the 9/11 terrorist attacks, rates went lower and stayed low. For years. This extended stretch made money cheap for banks, who in turn gave cheap money to consumers. As interest rates hovered, more homebuyers realized they could now afford a bigger home or that huge addition, and before long, housing prices were jettisoned upward. All the while, the personal savings rate in the U.S. plummeted. No one needed to worry about saving when their house kept going up each year by double digits, and the bank kept handing out home equity lines of credit up to and occasionally over 100 percent to back fill the spending sprees of Americans.
After a three-year slide in the stock markets ended with 2002, real estate optimism spilled over into the markets, pushing them higher yet again. People figured the dot-com bubble was anomalous and that the ghosts of dot-this and dot-that had reincarnated themselves into brick and mortar in the form of beachfront condos in Florida and McMansions dotting the suburbs. The banks sent out blank checks (literally) tied to the equity in houses, and real estate appraisers gave everyone something to talk about at neighborhood cocktail parties. “Yeah, I bought this house for $275,000 and now it’s worth $550,000—in just three years!”
Which of the following boosted U.S. markets to new highs eclipsing 14,000 on the Dow, only to fall back under 7,000 in March of 2009?
a. Low Federal Reserve interest rates
b. Easy money and loosening lending standards by banks
c. Irresponsibility on the part of investment banks and product-pushing brokerage firms
d. Blindly utopian outlook on the part of consumers
e. Materially hedonistic consumer spending
f. All of the above
The answer, of course, is f: All of the above. The impenetrable Wall Street establishment that survived the Great Depression was brought to its knees, and plenty of good companies were dragged down with it.
As for international economics, you need look no further than the headlines of whatever news source you consume to see the impact global events have on our own economy and market. Iceland, Greece, and Ireland were reliant on the European Union for bailouts to keep their very countries from bankrupting, and Portugal, Spain, and Italy are also struggling under the weight of their sovereign debt. This same issue ails many U.S. states and cities. And as headlines appear announcing revolution in oil-producing Egypt, Libya, and elsewhere, markets quiver with fear.
Market valuation, or fundamental investing, is fairly straightforward (although agonizingly difficult to implement). You buy stock of good companies—companies you’d be willing to buy completely. That is how Warren Buffett has become so successful, and it is also why it is so difficult to emulate his investing style in your 401k or brokerage account. You and I can’t afford to buy the whole company—Mr. Buffett can and does. His company, Berkshire Hathaway (originally a textile company with roots as far back as 1839), is now a conglomerate with holdings in insurance, utility, manufacturing, and retail companies, among others. Famous for some of his long-term holdings, Buffett is often mistaken as a buy-and-hold investor, but the record shows that he holds some companies for the long term, others for the mid term, and some only for short holding periods3. Buffett is a valuation expert and a risk manager—not a blind buy-and-hold guy.
In addition to owning stock of good companies with a bright future, the best fundamental investors look not only at the ability of a company to outperform its rivals, but also at its share price. Depending on the type of company you analyze, you’ll be examining everything from the cash and debt a company has on its books to the earnings per share of stock and the ratio of the stock price to that company’s earnings, called the price to earnings ratio (P/E ratio). The higher the P/E ratio, the more stock owners are paying for each unit of corporate income. Although they vary significantly over history, an average P/E ratio is thought to be around 15 times earnings for the broader market. They averaged just shy of 35 in 1929 and fell down to around six in 1932. In 1982, the average fell to seven. In the year 2000, it was close to 45, and even in 2009 (after the big drop) P/E ratios still hovered around 20.
I want to avoid oversimplification on this point because of the myriad other factors also in play, but I’ll let Bill Bonner and Addison Wiggin tell you in their words what they think about our past and current market valuations. They coauthored the international best-selling book, Empire of Debt, which was used as the basis for the award-winning movie, I.O.U.S.A.
Based on past experience, the bear market that began in January 2000 will probably continue for another 10 years, taking prices down to six to eight times earnings. Then, their faith in stocks will finally be crushed out . . . at the very moment stocks are ready for another bull market.4
The most interesting part about that quote is that it was written in 2006—before 2008’s collapse when most were giddy about the market.
Market cycles, or technical investing, is the piece of the investing puzzle that is hardest to grasp. It gets extremely complex and sometimes starts to sound like voodoo magic, but the cycles running through the market tell us more about how to be the best risk manager. As mentioned in the opening of this chapter, the markets seem to run through long term cycles of ups and downs. The stretch from 1982 until 2000 is referred to as a secular bull market. That means there were plenty of ups and downs in that span, most notably the Crash of 1987, but on the whole, there was financial inertia pushing the market higher. It is also one of the reasons the Crash of 87 was quickly recovered. In secular bull markets, buying and holding typically works.
In secular bear markets, however, buying and holding is often disastrous. If Messrs. Bonner and Wiggin are correct, we still have several years of our current secular bear market yet to live through. Inside a secular bear market, you must rely even more heavily on the other two previously mentioned forms of analysis: economic and market valuation.
Drew Tignanelli, financial planner, investment manager, and architect of the Risk/Opportunity investing methodology, insists that unless investors view the market through all three of these lenses, they invest at their own peril. Using only one or two may work in some market scenarios, but not all.
Ultimate Advice
History doesn’t repeat itself, but it does rhyme.
Mark Twain
How would you feel if you were asked to drive without any rear- or sideview mirrors? There is no question that analyzing the past—technical analysis—will absolutely aid us in knowing how best to move forward. But how about driving only using your rear- and sideview mirrors? Between the 1950s and 1970s, a host of academic analyses hypothesized that the market’s past had told us everything we needed to know about its future. Through a great deal of historical analysis, Modern Portfolio Theory (MPT) and the Efficient Market Hypothesis (EMH) asserted that markets are rational and efficient—that the price of any particular security represents the sum of all known information up to that moment—and that human intervention causes more harm than good. Effectively, they concluded you can’t beat the market and shouldn’t try.
In stark contrast with the price-determines-the-risk mindset (remember the house analogy?), MPT and EMH demand that volatility—the upward and downward gyrations of asset classes—determines risk. This market “science” concluded that an investor need only adequately diversify across a spectrum of asset classes displaying varying levels of volatility and then rebalance when any of the individual asset classes range too far up or down.
Although he’s given a host of fodder for the anti-MPT crowd—like “I’d be a bum on the street with a tin cup if the markets were always efficient”—Warren Buffett, displaying the wisdom of Solomon (or in this case, his mentor, Benjamin Graham) seems to suggest the markets are both efficient and inefficient at the same exact time. In his letter to Berkshire Hathaway shareholders in 1987, Buffett quoted Graham saying, “In the short run, the market is a voting machine but in the long run, it is a weighing machine.” In essence, in the short run, the market is irrational, emotional, and subject to the whims of a popularity contest (inefficient); but in the long run, all the information brought to bear is properly weighed (efficient).
Asset allocation is the term generically given to the practice of grouping different asset classes in a portfolio. At the most elementary level, a split is made between those assets that are stock based and bond based. You may have heard of the Rule of 100. This gross over-simplification postured that one should take the number 100 and subtract from it the number corresponding with one’s age. The resulting balance was the percentage amount of your investment portfolio that should be invested in stocks. So, if you were 70 years old, you should have 70 percent invested in bonds and 30 percent invested in stocks.5
Ultimate Advice
The conventional wisdom is often wrong.
Steven Levitt and Stephen Dubner in Freakonomics
The rule’s more sophisticated cousins fracture the stock exposure between growth and value as well as large cap, mid cap, small cap, and international. Bonds are broken down based on when they mature (give back the initial principal loaned) and their perceived risk of default (the risk that they won’t give back all or some of the principal loaned).
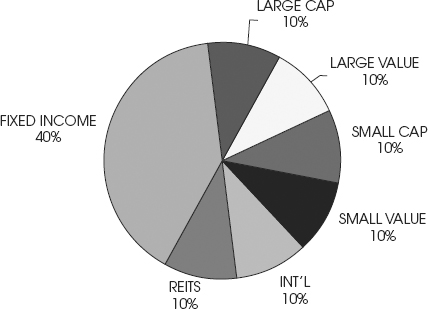
Ardent Modern Portfolio theorizers believe there is no benefit to picking one security over another and therefore establish a passive asset allocation. This means that they fill each of the allocation’s pie slices with an index fund and only fiddle with adjusting the portfolio when one or more slices of the pie get too out-of-whack. Figure 9.1 shows an example of the recommended passive asset allocation promoted on the popular investing blog, The New Coffee House Investor6.
Figure 9.1 The Coffee House Investor Passive Asset Allocation
![]() Economic Bias Alert!
Economic Bias Alert!
Are you wondering why you would need to pay a financial advisor to manage a generally passive asset allocation portfolio for you if the whole point is not to touch it? You don’t, and you shouldn’t. When the big financial institutions foresaw Modern Portfolio Theory changing the investing landscape, they realized that if everyone bought into the notion that no one could beat the market, no one would need brokers! So the financial services institutions decided, “If we can’t beat ’em, we’ll join ’em.” They fused the EMH and MPT together with another study done by the trio of Brinson, Hood, and Beebower positing that 90 percent of an investor’s return was simply based on maintaining the appropriate asset allocation mix according to the investor’s risk tolerance. That other 10 percent or so, however, was reason enough to fill each of the pie slices with the company’s own proprietary mutual fund managers, netting them even more fees.
The result? Most people are paying a broker or advisor commissions or fees of one to two percent per year to simply tell them to hold on when things get ugly in the market.
Any degree of active asset allocation, then, is departing from the purest efficient market doctrine. Most financial advisors today are not investment analysts—picking or choosing individual securities, and to a growing degree even mutual funds—but instead purveyors of various takes on asset allocation ranging from fairly passive to largely active.
Each mutual fund is a basket of filtered securities. As individual securities are filtered by mutual fund managers, they are categorized by asset class. Several companies offer services deconstructing this process to help investors better understand what exactly is inside of mutual funds, but the dominant company that made this analysis visual through their “Style Boxes” was Morningstar. Here’s how they describe the concept in their own words:
The Morningstar Style Box™ was introduced in 1992 to help investors and advisors determine the investment style of a fund. The equity Style Box is a nine-square grid that classifies securities by size along the vertical axis and by value and growth characteristics along the horizontal axis. Different investment styles often have different levels of risk and lead to differences in returns. Therefore, it is crucial that investors understand style and have a tool to measure their style exposure.7
Figure 9.2 a visual example of a stock and bond Morningstar Style Box from their web site.
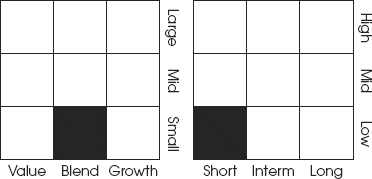
Morningstar’s tools of analysis were and are helpful to consumers and advisors alike, but when they became the lens through which mutual fund portfolios were viewed, it created a shift in the industry for the worse. Since a growing number of investment portfolios (made up of several mutual funds) were being designed with an unwavering amount of exposure to each of a predetermined basket of asset classes, individual mutual funds were encouraged to keep their exposure consistent in distinct asset classes. If a 401k plan, for example, offered one large cap growth mutual fund, and that fund started to increase its holdings in cash and small cap stocks, they no longer fit into their prescribed Style Box. Over time, mutual fund managers were derided for “style shift.” If a mutual fund moved too far away from its mandatory Style Box, the fund might get kicked out of that and many other 401k plans, a staple client of many mutual funds.
The Style Box phenomenon has forced all too many mutual fund investment managers to be tethered to the respective Style Box indices, quite possibly hampering them from doing the best job for investors. Even though most consumers rate the success of their investments the way Mark Twain did—the return of my money—those in the mainstream investment management realm are judged differently, on their performance relative to their comparable index.
![]() Economic Bias Alert!
Economic Bias Alert!
The industry’s obsession with Style Boxes and relative returns has set investment managers at odds with the best interest of the mutual fund shareholders. If managers don’t outpace the index in a particularly big market up year, they are likely to be yanked from any number of the institutional retirement plans and investment platforms making up the bulk of their managed assets; however, if they go too far outside of their prescribed Style Box to achieve that illusive outperformance, they could get yanked for style drifting from the same platform that promises to punish them if they don’t beat the index.
So, much like politicians, the fund managers find themselves in a game of chance in which their very livelihood is at stake. Self-preservation becomes the primary objective and the result is tepid mediocrity for the vast majority of mutual fund investors across the globe. In order to achieve that primary objective, most managers keep their funds looking almost identical to their respective index to keep from losing (relatively speaking); they then try to marginally outpace the index to keep their spot in the money management platform and/or retirement plan.
This economic bias leaves consumers paying the bill for subpar investment management.
Doesn’t it seem like we’ve been trained by an industry telling us what they want us to do instead of helping us achieve what we want? Are you more concerned with beating an index or making money? If you answered the index, you are placing your faith in the market to take care of you. Who is the market anyway? Bear Stearns? Lehman Brothers? Merrill Lynch? Bank of America? Citigroup? AIG?
Relative Return versus Absolute Return
The success of a money manager attempting to gain a positive relative return is gauged by whether or not the manager beats the index to which the fund is compared. So a large cap blend mutual fund is most often compared to the S&P 500 index. The S&P 500 is the index containing the 500 most prominent company stocks trading on the two primary U.S. exchanges, the New York Stock Exchange (NYSE) and NASDAQ. That mutual fund management team has done its job in superlative fashion if the fund’s return is above the S&P 500. Yes, that means if the S&P 500 is down by 22 percent, as it was in the year 2002, a mutual fund that loses 19 percent of investors’ money would have achieved success. Success? That 22 percent/19 percent comparison is an actual example that took place in 2002, when the Legg Mason Value Trust lost 18.9 percent.
The Value Trust made headlines in 2002 when it continued its unparalleled streak of beating the S&P 500. While the champagne bottles were uncorked in downtown Baltimore at Legg headquarters, investors were choking on their dinner looking over statements showing their fund down nearly 20 percent from the previous year, which had also been a negative return. All the blame cannot fall on the shoulders of Bill Miller and the management team of the Legg Mason Value Trust. The Style Box backed them into a strategic corner. When Miller took some chances in 2006, the fund lost to the index for the very first time, losing by a relative 10 percent (the fund was actually up about 6 percent). Then, in 2007, to make up for the previous year’s loss to the index, Miller took more chances and underperformed the index by an additional 12 percent.
Finally, in 2008, it happened. Miller made big bets in favor of fallen financial giants8 and the fund that put the Baltimore underdog on top cratered. It lost 55 percent (18 percent more than the benchmark)! After losing 55 percent, you need to make a 122 percent rate of return to get your money back.
Absolute return is practically a dirty word (or phrase, really) in the industry. The goal of absolute return is easy to remember. It’s to make money! I know it sounds crazy, but that is the objective of a relative few mutual fund managers who choose to spurn the Style Boxes and ignore indices seeking to make money in every year. It is important to note that these are not funds that guarantee they’ll accomplish that mission successfully. There will certainly be years in which even the best of absolute return managers will fail in accomplishing their goal, and for that reason many absolute managers don’t even refer to them as such. (The regulatory bodies, known as FINRA and the SEC, frown on any fund or investment manager who seems to give investors the impression that they won’t lose money . . . for good reason.) But when the primary objective of a fund is to avoid losing money for their clients, fascinating things can happen.
Let’s compare another mutual fund with the Legg Mason Value Trust over the recent decade of market turbulence. The Value Trust’s 10-year annualized return (the average that your money would have returned each year if you made a deposit into the fund 10 years ago) is −1.29 percent as of February 18, 2011. The cumulative loss (the total amount lost in that stretch) over the 10 years was 12.2 percent. A $10,000 investment would have been reduced in 10 years to $8,780. In that same stretch, First Eagle Global, a mutual fund appearing to follow more of an absolute return discipline, had a positive rate of return of 13.04 percent per year. In that fund, your $10,000 would have turned into $34,069, a cumulative rate of 240 percent! This illustration is not made to suggest that all—or even any—of your money should be put into the First Eagle Global mutual fund, but to illustrate how differently certain managers go about their business.
Opponents of absolute return will show charts that seem to prove that pure growth managers or market indices alone will outperform absolute return managers when viewed over a longer stretch of time. This may or may not be true, depending on the statistic, but what this theory does not take into account is that while rates of return are reported on a linear hypothetical basis, assuming that no distributions are taken, life is not linear. In reality, investors need to take distributions from investments, and if they do so in one of the years when the market is down significantly, the distribution magnifies the market loss. This is especially important for retirees who have begun to take distributions from their portfolios. The objective of investing is eventual distribution, and while long-term buying-and-holding appears to work in hypothetical linear projections, the impact of distributions in downward market cycles can devastate a portfolio in real life.
There are many different varieties of absolute return managers, and not all of them are good. They have notoriously high internal expenses and a great many of them were humbled as they failed to achieve their objective of positive gain in 2008; however, most of them are risk managers.
Index Huggers, Return Chasers, and Risk Managers
Risk manager is one of three classifications into which most mutual funds fall: index huggers, return chasers, and risk managers.
Index huggers make up the vast majority of a largely mediocre array of mutual fund options. Most of the funds you likely hold—and, unfortunately, most of the options in 401ks and other retirement plans—are index huggers. Most managers, in the spirit of self-preservation, resort to plugging along with the index, playing it safe to keep their status in the big institutional programs. Do not pay a mutual fund company or financial advisor to settle for index huggers. If you look at a chart of the performance of the fund, you’ll find that it seems to move in perfect correlation with the benchmark index to which it is compared. If, based on your economic, valuation, and technical analysis, the hugged index is one that is desirable at this time, consider replacing the hugging fund with an index mutual fund (Vanguard is a mutual fund family with a number of good, low-cost index funds) or an exchange-traded fund. Although most exchange-traded funds (ETFs) are simple in their objective (they seek to track a specific index), they’re quite complicated in design and require a level of sophistication on the part of the investor as they have virtually no professional management.
Return chasers are typically high-flying mutual funds that seem bent on making it onto the cover of a financial magazine for having a stratospheric up year. The problem is that when they bet wrong, you’re likely to suffer greatly on the downside. In order to spot return chasers, take a look at years like 1999, 2003, and 2009. If your fund was up by a very significant amount in those years, you likely own a return chaser. You should certainly not be opposed to owning a fund that gives you a phenomenal return, but you’ll probably notice that any fund that achieves single-year returns in the 40 percents or above will also have years in which they bet big—and lose big. Return chasers need not be eliminated from your portfolio altogether, but they must be very carefully monitored and avoided by novice investors when in the midst of a secular bear market (as described earlier in this chapter).
Risk managers are the small subset of mutual fund managers who prioritize avoiding losses over chasing returns. You’ll find risk managers by examining years like 2001, 2002, and 2008. Those were years in which the major market indices were down, along with many mutual funds. If you have a fund that was positive or only mildly down throughout the three-year stretch from 2000 through 2002, that’s a sign of a risk manager. In 2008, even most good risk managers were down by a decent margin. If your fund survived the 2000–2002 stretch, and was down by around 20 percent or better in 2008, you may have a capable risk manager at the helm.
Timely Application
Investment Audit
Most of the information you’ll need to complete this exercise should already be together from the Personal Balance Sheet exercise in Chapter 3, but if not, pull together the most recent holdings information that you have for your various investment accounts. If you have online access to these accounts, it will be as easy as printing out the page with your current holdings. If not, pull together each of the most recent statements for all of your investment accounts.
Aggregate your holdings using the form we’ve made available for this exercise online. Segregate them between investments that are inside of retirement accounts (like your 401ks, 403bs, IRAs, etc.) and non-retirement accounts. For any mutual funds, you’ll want to have the name of the fund and the five-letter symbol.
Now, navigate your web browser to www.morningstar.com. With the tools here, you’ll be able to use that final column of your Investment Audit to fill in the Manager Category column. (You can examine your mutual fund managers with the tools on Morningstar using the basic service at no cost. Another good, free resource for the analysis of stocks and mutual funds is Yahoo’s Finance web site http://finance.yahoo.com/.)
Plug the symbol of each of your mutual funds into the “Quotes” field on Morningstar. The main page for each fund will show you a 10-year chart with a graphical depiction of your fund’s performance alongside its benchmark. Just below the chart, you’ll see a tool that will allow you to click and drag the timeline backward to see a longer fund history if it’s available. You can also hit the “Performance” tab and select the “Expanded View” to see even more detail about the fund’s numerical performance.
Using the tips in this chapter, you should now be able to classify each of your funds. In the Action column on the right hand side of the worksheet, check any of the Return Chasers and Index Huggers for additional review. Again, Return Chasers should be well understood, carefully monitored, and dumped if misunderstood. Index Huggers should be replaced.
Visit www.ultimatefinancialplan.com to find a template to use in creating your own Investment Audit and categorizing your mutual funds.
Tim Maurer
After great risk managers wring as much of the risk as possible out of their investments, all that should be left is the opportunity for returns. At times—especially times when the market is going through a bull cycle, lifting all boats with the tide—risk managers are viewed with condescension. Return chasers scoff at their unwillingness to gorge on returns and even index huggers get a chance to breathe and wonder if the big salary will assuage their conscience. But I submit to you that the idea of risk management investing is not to settle for long-term lesser returns.
Ultimate Advice
Poor investors assume that risk either guarantees high rates of return or, conversely, that risk guarantees loss of principal. The former automatically choose high-risk investments, assuming that their willingness to weather volatility will ultimately provide superior gains. The latter choose to invest entirely in low-return or even no-return investments.
If you followed the majority of investors passively downward through the financial crisis, you have also likely seen your accounts rebound if you left your depressed assets in the portfolio. Do not assume that on the basis of this or any subsequent boost, the ills of shortsightedness have been completely cured. We likely have some time still to go before we experience our next secular bull market, and if you don’t know how you got where you are today, it’s all too likely that you don’t know how to get where you’d like to go. It’s okay to get some help. You will see an entire chapter at the end of this book dedicated to interviewing and choosing a financial planner or advisor if that is the route you choose. Maybe you’ve had a bad experience in the past with an advisor in whom you put your trust. We understand. We know how this industry operates, who to steer you away from, and who to recommend.
Passive or active? In order to be a wise risk manager in investing, it practically requires an active posture, but you don’t want action merely for action’s sake. If an active manager is not employing economic, valuation, and technical analysis or doesn’t appear to deviate from market indices, consider looking elsewhere. And if you choose to go the entirely passive route, there are no hard feelings here; in that case, follow a definitive strategy involving rebalancing and considering a mechanism that is not totally reliant on the success of the stock market.
Investors who are on the fence may consider a hybrid strategy known as core/satellite. Originally, the strategy was designed to employ a passive asset allocation strategy in the majority core of the portfolio with targeted actively managed mutual funds rotating around the core. I suggest, however, considering the inverse of that strategy. Make the core of your portfolio active risk managers and the satellites tactical index or exchange traded funds.
Absolute or relative? The choice is yours, but remember what a wise man once said; “You can’t eat relative return!” Index hugger, return chaser, or risk manager? You know the drill.
Please remember one last thing regarding the choices you make in your investing future: Inaction is still a decision, and most often, not a good one. In response to the mass of information contained in a chapter like this, you may be inclined to simply hold up a white flag of surrender and do nothing. Instead, take a deep breath and simply determine what the single next step is that you must take . . . and then take it.
1. For more on “The Lost Decade” of 2000 through 2009, read the Wall Street Journal article by David Weidner from October 15, 2009, titled “The Lost Decade of Stock Investing,” and the January 1, 2010 article in the Washington Post titled “The lost de cade for the economy” which offers an excellent graphic. Both articles are available online.
2. The expense figures for the Fidelity Contrafund (FCNTX), the Growth Fund of America (AGTHX), and Matthews Asia Pacific (MPACX) were drawn from Morningstar.com on February 22, 2011.
3. A couple of examples of Buffett’s short- and mid-term holdings would be Becton Dickenson (held approximately one year) and Petro China (held approximately three years).
4. Empire of Debt and The New Empire of Debt were both written by William Bonner and Addison Wiggin and published by John Wiley & Sons in 2006 and 2009 respectively. This book is a treasure trove of historical context leading up to the case for financial insolvency of our great nation. If you don’t have time to read the book, watch the movie based on the book, I.O.U.S.A., released in 2009.
5. There was a time in the 1990s when this rule got greedy and became the Rule of 120. After the tech boom busted, the rule and its remaining adherents retreated back to the 100 mark.
6. http://www.coffeehouseinvestor.com/the-coffeehouse-rules/coffeehouse-returns/
7. This quote was taken from the Fact Sheet describing the concept on Morningstar’s web site on February 22, 2011. (http://corporate.morningstar.com/bf/documents/MethodologyDocuments/FactSheets/MorningstarStyleBox_FactSheet_.pdf)
8. One account of this fall is found in the Wall Street Journal article, “The Stock Picker’s Defeat,” from December 10, 2008. (http://online.wsj.com/article/SB122886123425292617.html#articleTabs_interactive%3D%26articleTabs%3Darticle)