Kill Chain Modeling
Abstract
This chapter covers the dissection of the kill chain model and the types of tools that can be implemented to assist with breach detection, analyzing data and sending it to larger analytical engines for further analysis. Many of the tools that we discuss in this chapter are just examples of what can be used and how they can help fill the gaps in security and strengthen the defenses against attacks.
Keywords
Kill chain model; Breach detection; Security; Attack defense
Synopsis
This chapter covers the dissection of the kill chain model and the types of tools that can be implemented to assist with breach detection, analyzing data and sending it to larger analytical engines for further analysis. Many of the tools that we discuss in this chapter are just examples of what can be used and how they can help fill the gaps in security and strengthen the defenses against attacks.
Introduction
In this chapter we will cover various components of a kill chain, the uses for various technologies that assist in the detection and prevention of major breaches. Although we will keep in mind that the key to detection and prevention comes down to placement, we will go deeper as we go on. We will also cover many other options with regards to open source tools and their functionality. Please also note that the mentioning of these tools isn’t an endorsement in any way, other examples are tools you can use to achieve some of the goals by not just looking at a dissection of the kill chain, but by filling some of the gaps in your existing infrastructure.
Key Components of Kill Chain Modeling
This can be broken down into several different components; keeping it as simple as possible is often the easiest way. The first component is planning, defining the target, being clear about the goal of the attack and making sure that if there is more than one attacker all team members are on the same page. A planned offensive often works best if there is a distraction followed by the malicious act in parallel. Making the distraction really big and noisy means that everyone pays attention to it first. When the noise dies away, the malicious act has already been executed. Not to say that we do this type of thing, it’s more of an observed method seen in the wild. The second step is reconnaissance, which is closely linked to the planning stage and can cause a step back in planning based on what is gathered. Intelligence collection on the target is one of the most important steps, as this tends to dictate the method of the primary attack in many cases and along subsequent attacks yielding multiple options for performing malicious acts. Once all the planning is complete, meaning that the objectives of the operation are clear, any issues of overlap or task assignments, then steps one and two are complete and it is now time to move on to step three. This step tends to be fairly straightforward, as it’s an execution of the carefully gathered intelligence and, depending on how carefully the intelligence was gathered, the target won’t see the attack coming only that they are being attacked from multiple sides all at the same time. With the first wave being the most redundant and useless of attacks, making lots and lots of noise, and waking the night shift analysts. While the noise continues the real attack happens and the malicious actors compromise the network leaving with the information they first set out to get, setting up a beach head for easy access to get more information and returning to dig deeper.
After this the attackers own the enterprise, as many enterprises networks can take months to find that an attacker owns their network and has administrator/root privileges on all critical infrastructure.
A beach head normally consists of installing a command and control mechanism for ease of access from a remote node. Some of the better command and control software will randomly change ports and signal a control channel as to what port to use to access the system that has the command and control system on.
Detecting this in the kill chain can be accomplished in many ways. It’s like manual labor, where having the right tool for the job makes easy work of the task. Many of these tools are found in tier one security appliances, allowing the security administrators to apply policies to malicious traffic sending them to a black hole network or honey net, which looks and feels like a great place to start digging for a juicy network that they then can’t get out of.
Leveraging Big Data
Leveraging big data is addressed elsewhere in this book. Data in general is becoming richer in terms of content. Andrew Brust really does a great job in defining big data that captures the essence in his blog post on ZDNet.
“This blog is about an industry area that has come to be called ‘Big Data.’ The excitement around Big Data is huge; the mere fact that the term is capitalized implies a lot of respect. A number of technologies and terms get mentioned in the context of Big Data, with Hadoop chief among them, ‘data scientist’ often not far behind and sometimes NoSQL thrown in for good measure.
It’s a bit unorthodox to start a blog post – especially a first post for a new blog – with a bunch of terms unaccompanied by definitions. But that’s a perfect metaphor for Big Data itself because, frankly, it’s not rigorously defined. Meanwhile the term is already entrenched – not just in the industry lexicon but in the mainstream vernacular as well.
What about Big Data is concrete and certain? We can safely say that Big Data is about the technologies and practice of handling data sets so large that conventional database management systems cannot handle them efficiently, and sometimes cannot handle them at all. Often these data sets are fast-streaming too, meaning practitioners don’t have lots of time to analyze them in a slow, deliberate manner, because the data just keeps coming.
Sources for Big Data include financial markets, sensors in manufacturing or logistics environments, cell towers, or traffic cameras throughout a major metropolis. Another source is the Web, including Web server log data, social media material (tweets, status messages, likes, follows, etc.), e-commerce transactions and site crawling output, to list just a few examples.
Really, Big Data can come from anywhere, as long as it’s disruptive to today's operational, transactional database systems. And while those systems will be able to handle larger data sets in the future, Big Data volumes will grow as well, so the disruptions will continue. The technologies used for creating and maintaining data, it turns out, are just not that well-suited to gathering data from a variety of systems, triaging it and consolidating it for precise analysis.
Perhaps you’ve heard of other terms, like Business Intelligence, Decision Support, Data Mining and Analytics, and wondered whether they’re part of Big Data or technically distinct from it. While these fields may have started out as distinct endeavors, they are often folded in to the Big Data discussion. Sometimes when that happens, it may seem that people are merely conflating things. But it turns out that Big Data is still evolving, and as a term it’s malleable. In a way, Big Data is a startup that’s still working out its business model.
I’ve been working with database, data access and business intelligence technologies since the mid-1980s, so Big Data quickly became a logical interest for me. What’s interesting, though, is that Big Data purists sometimes seem unaware of the data technologies that have come before, and miss out on the knowledge and experience those technologies represent. A few Big Data wheels have been re-invented ones” (http://www.zdnet.com/article/big-data-defining-its-definition/).
When it comes to applying Big Data principles to effective kill chain modeling and threat forecasting, it requires the use of large complex and unstructured data sets that need to be normalized quickly in order to get an effective result when applying the structured data against various applications such as threat forecasting and kill chain modeling. The kill chain model, as mentioned above, is fundamental to understanding the gaps and overlaps in the security controls that you have currently deployed or are considering deploying. The ability to model your internal security controls is critical in really understanding your exposure and there are many modeling tools that can provide that modeling and insight that will be discussed below.
Tools Available
There are many tools available for mining data, modeling data and viewing threat intelligence, such as Maltego, Splunk and Tenable. There are many more commercially available tools but these are a great start in terms of putting together large data sets and connecting the dots.
Obviously having more data points to work with increases not just the amount data collected but also the amount of analytics needed to distinguish the Indicators of Interest (IOI) and Indicators of Compromise (IOC) from the noise. Understanding the functions and expectations of these tools helps you keep a perspective of the types of data you extract from your analytics. Tenable for instance will be able to into not only provide great insight the vulnerability data for the configured subnets, but also assist with the overall Bring Your Own Device (BYOD) policy, by performing a constant discovery scan of the network and also reporting that information.
Splunk is a great log aggregation and analysis tool that competes with many security information and event management systems in the industry and can truly open the eyes of many security analysts. It has multiple dashboard applications, providing application management, and network flow information, and it can also be used to track event information on external network intelligence system, like cuckoo and cisco’s botnet tracking security suite.
Maltego
The following is a snippet of the power that the use of Maltego can provide you with from their website. “With the continued growth of your organization, the people and hardware deployed to ensure that it remains in working order is essential, yet the threat picture of your ‘environment’ is not always clear or complete. In fact, most often it's not what we know that is harmful - it's what we don't know that causes the most damage. This being stated, how do you develop a clear profile of what the current deployment of your infrastructure resembles? What are the cutting edge tool platforms designed to offer the granularity essential to understand the complexity of your network, both physical and resource based?
Maltego is a unique platform developed to deliver a clear threat picture to the environment that an organization owns and operates. Maltego's unique advantage is to demonstrate the complexity and severity of single points of failure as well as trust relationships that exist currently within the scope of your infrastructure. The unique perspective that Maltego offers to both network and resource based entities is the aggregation of information posted all over the internet - whether it's the current configuration of a router poised on the edge of your network or the current whereabouts of your Vice President on his international visits, Maltego can locate, aggregate and visualize this information. Maltego offers the user with unprecedented information. Information is leverage. Information is power. Information is Maltego.
Maltego is a program that can be used to determine the relationships and real world links between:
• Groups of people (social networks)
• Companies
• Organizations
• Web sites
• Internet infrastructure such as:
• Domains
• DNS names
• Netblocks
• IP addresses
• Phrases
• Affiliations
• Documents and files
These entities are linked using open source intelligence. Maltego is unique because it uses a powerful, flexible framework that makes customizing possible. As such, Maltego can be adapted to your own, unique requirements.
Maltego can be used for the information gathering phase of all security related work. It will save you time and will allow you to work more accurately and smarter. Maltego aids you in your thinking process by visually demonstrating interconnected links between searched items. Maltego provide you with a much more powerful search, giving you smarter results. If access to ‘hidden’ information determines your success, Maltego can help you discover it”. (https://www.paterva.com/web6/products/maltego.php)
There are many important key takeaways that are mentioned above in relation to Maltego in terms of pulling together information and uncovering the unknown by visually and literally connecting the dots. The visual aspects of Maltego paint a picture that allows you to drill down to the information that is most important to you. In working with large data sets, you need to categorize and prioritize the data at the highest element with supporting data points that you can easily pivot, expose and correlate to other adjacent data points. The ability to perform these functions and move data around within a GUI allow an analyst to move quickly to the data sets that are important to him or her. The following is a screen shot of the Maltego user interface to provide more context as to the power of visual analytics (Fig. 8.1).
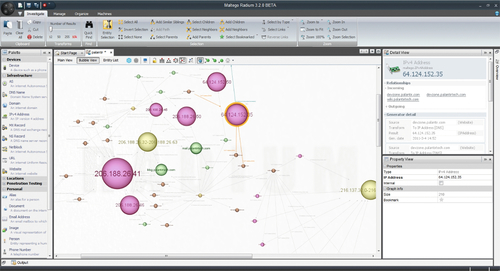
Each element that is rendered in the user interface allows the analyst to click and explore adjacent and relational data associated with each object. Similar techniques in automating big data within forecasting could be leveraged with a tool like Maltego in order to discover and track a threat from inception to detection.
Splunk
Splunk is another tool that can be used for kill chain modeling by conducting compromrise and breach assessment analysis. Splunk is like a swiss army knife in terms of all the ways in which you can mine data based on all the various data points that Splunk allows you to collect. Conducting a breach assessment based on multiple data points with Splunk helps you quickly pull together and connect the dots of said breach without written complex correlation rules. This is an important point because when you start discussing big data analytics the first thing that might come to mind is the complexity and the immediate need to hire a data scientist. The great thing about Splunk is that it takes the complexity out of the picture and provides a junior analyst with the ability to build relationships with ease. A common theme in some of these chapters is complexity of large data sets, but have no fear, there are a lot more commercially available tools that span beyond Maltego and Splunk that provide you with the ability to pull together large disparate data sets with ease.
Splunk isn’t just for log aggregation either. It has multiple dashboards for managing and gauging the real time sales of an ecommerce site, dashboards for botnet tracking by various third party vendors.
Splunk also has integration applications into Amazon Web Services, Hadoop cluster health and welfare including end-to-end transaction monitoring. This extends into application management, IT Operations, Security and Compliance, Business Analytics and more.
Splunk also allows the user to create custom dashboards and representations of key data fields. When creating custom dashboards it’s not a matter of creating a pretty picture for management, but creating a meaningful picture (this is discussed further in Chapter 6 – Data Visualization). Not all data can be represented with graphs, nor can it hold the same meaning. Representation of data needs to be exacting and clear. When someone looks at a security dashboard it needs to be clear about what it is and why it looks the way it does. Colors also play a big part in data representation; this is mentioned because the color red for instance, is generally equated to a negative result. Colors in general can mean different things to different people. Some people see a red number as a high alert, others think of it as purely a way of bringing a piece of information to everyone’s attention. Colors tend to dictate whether people see data results as good vs bad. Where others merely see color as a means to express a differentiation between data types. Being able to modify and customize these types of reports is part of the success that Splunk has in creating custom reporting dashboards.
Something else to consider when creating a custom dashboard or application for Splunk is who it is intended for. Make it clear who needs to see what data and why it is important. Clearly document your logic around each representation and have a way of conveying the thought process involved in its creation.
OpenGraphiti
OpenGraphiti is unix-based tool that works great for multiple operating systems. This python-based tool allows you to graphically represent your network by mapping data flows allowing you to create custom datasets and drill down into a three-dimensional map without the need for or expense of oculus rift goggles. Viewing the multiple subnets can become visually overwhelming and many people tend to like looking at specific pieces, as it is easier to see the details and decipher what the map is attempting to show.
Two things need to be pointed out in Fig. 8.2. First is that the yellow dots are the nodes or systems on the network and the second that the pink bloom is a representation of an exploit kit. Many botnet trackers depend on this type of technology to track malware in the wild and as it allows the visually inclined analyst to see many problem areas within the environment without having to reformat the same data for other types of analysts with a very small learning curve. With some slight massaging of the data, the analyst is able to view large datasets quickly. This tool is currently being used to track

CryptoLocker and CryptoDefense ransomware, Red October malware, and
the Kelihos botnet; it is also being used in the various Syrian electronic army campaigns and carding sites.
The data visualization of this particular tool relies on a semantic network of relationships between multiple nodes connecting the dots in any relationship in data streams. From the highly complex to just a high-level representation, the analyst can create an immense amount of detail that he or she can show graphically based on the datasets that have been referenced. Please note that this is not entirely automatic and does require an understanding of how to build relational semantic networks.
“OpenGraphiti can apply the algorithms to affect the spatial representation and interconnectivity of the data nodes and edges” (Fig. 8.3).
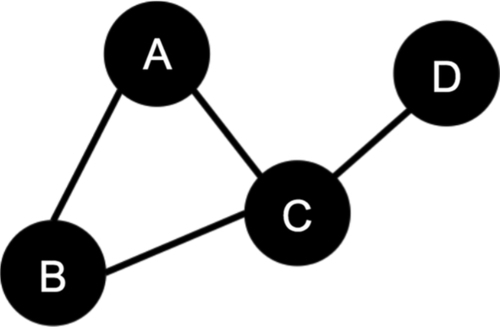
Creation of Data Files
Suppose you have a graph
where V = {0, 1, 2, 3} and E = {(0, 1), (0, 2), (1, 2), (2, 3)}.
Suppose further that:
• Vertex 0 has the attributes:{"type":"A","id":0}
• Vertex 1 has the attributes:{"type":"B","id":1}
• Vertex 2 has the attributes:{"type":"C","id":2}
• Vertex 3 has the attributes:{"type":"D","id":3}
And that:
• Edge (0,1) has the attributes:{'src':0,'dst':1,'type':'belongs', 'id': 0}
• Edge (0,2) has the attributes:{'src':0,'dst':2,'type':'owns', 'id': 1}
• Edge (1,2) has the attributes:{'src':1,'dst':2,'type':'has', 'id': 1}
• Edge (2,3) has the attributes:{'src':2,'dst':3,'type':'owns', 'id': 1}
As you can see, there is a list of "node" objects, each of which contain the node attributes and IDs, as well as a list of edge objects, each of which have the edge attributes, and the fields src and dst, which indicate the source and destination vertices, respectively.
The following are few use case examples for OpenGraphiti include the analysis of security data, such as firewall, intrusion detection and prevention systems (IDS/IPS), and malware infection alerts could be visualized to expose a previously unrecognized patterns in a malicious actor activity, or even a misconfiguration of a technical control that allows too much, or too little, access to data, files, or networks.
Financial analysts could, for example, analyze data to track venture investment with data points such as the investor, the type of company being invested in (the target), its vertical market, or even the success (or failure) of the target before, during, or after the merger or acquisition. Trends may be observed to support a new model for investment and exit success above and beyond a simple spreadsheet.
Social network analysis (SNA) can be visualized to show relationships between people and their relationships with other people or things. Data could be visualized to articulate the interconnections across related networks in the fields of anthropology, biology, communication studies, economics, geography, history, information science, organizational studies, political science, social psychology, development studies, and sociolinguistics, among others". (Open Source Visualization with OpenGraphiti by Thibault Reuille and Andrew Hay)
OpenGraphiti is a great open source data visualization tool, but with large complex data sets it is important that you consider a platform that can leverage multiple graphics processing unit (GPU) for rendering the data quickly. Lastly, when it comes to data visualization and threat forecasting, OpenGraphiti provides you with the ability to customize and optimize the code to fit your specific needs.
STIX
STIX is covered in Chapters 4 and 5, but the following snippet from the STIX websites provides the detail on how STIX can be used in conjunction with kill chain modeling.
Kill Chains in STIX
Network intrusions can be seen as a series of actions taken in sequence, each relying on the success of the last. Stages of the intrusion progress linearly - starting with initial reconnaissance and ending in compromise of sensitive data. These concepts are useful in coordinating defensive measures and defining the behavior of malicious actors.
For instance, the behavior of a financially motivated intruder may appear similar to an espionage-motivated one until the final stage where they execute actions to steal their preferred type of information from the target.
This concept is often called a "kill chain" or a "cyber attack lifecycle".
Defining A Kill Chain
STIX represents kill chains using the KillChainType. Each kill chain contains a name, information about the definer, and a set of phases (represented using KillChainPhaseType. Phases can be unordered or follow each other using the ordinality attribute.
The example below defines a two-phase model from scratch. Additionally, Lockheed Martin published one of the first papers on kill chains and their own kill chain has become a de facto standard for this purpose. As such, STIX has defined static IDs to use for this phase. The example below also demonstrates how to create that kill chain definition using the existing static IDs.
Referencing A Kill Chain Phase
Kill chains are referenced by phase and kill chain ID from either indicators or TTPs using KillChainPhaseReferenceType. A kill chain reference in an indicator indicates that the indicator detects malicious behavior at that phase of the kill chain. A kill chain reference or definition in a TTP indicates that the TTP is used (malware, infrastructure, etc.) at that phase of the kill chain.
The example below demonstrates how to reference the kill chains (defined as explained above) on an indicator (Fig. 8.4). The indicator contents are empty to focus on the kill chain reference". (http://stixproject.github.io/documentation/idioms/kill-chain/)

Threat intelligence has and will continue to provide timely value in pushing real time threat intelligence to your organization. The ability to classify and categorize threat intelligence data via the kill chain provides you with information as to where in the process of the chain that said exploit has taken place. Data classification is important and it is important to understand just how far down the kill chain a threat has been classified. This really determines just how exposed you are to said threat. Within threat forecasting and additional set of key performance indicators (KPIs) would include: reconnaissance, weaponization, delivery, exploitation, installation and command and control. However, as mentioned previously in the book, the key with threat forecasting is determining the validity of a threat in a timely fashion. Unnamed threats will have to be generalized and at some point classified and categorized, which often has to take place after the discovery.
Summary
Implementing a well-planned and structured kill chain can be a difficult task fraught with budget restrictions along with architecture and design issues that may never get resolved, as the nature of many compromises becomes more and more complex. The key to such an implementation is to keep it as simple as possible with the least number of moving parts that can all move together in a smooth motion, so that integration can be capitalized upon with the least amount of silo’d appliances. Essentially everything has to work as a team. Complication will happen all by itself as plugging holes takes time and effort. There is always something you forget to think about.
There is no silver bullet out there that can do it all in a single appliance, the problem is that you would be putting all your eggs into a single basket, so to speak, and relying on a single vendor for every bug fix and up date. By spreading out over different vendors, you can increase the amount of threat intelligence and provide a greater depth of security when using multiple technologies.