
CHAPTER 6
AWS Cloud Threat Prevention Framework
This chapter focuses on using AWS services for various cloud threat protection in alignment with MITRE ATT&CK Framework.
Introduction to AWS Well-Architected Framework
The AWS Well-Architected Framework encapsulates a set of principles, processes, and best practices to follow when designing and running workloads in the cloud. Designing for the cloud is much different than designing for an on-premises architecture, and this framework helps you understand the pros and cons of decisions you make while building systems on AWS. By using the framework, you will learn architectural best practices for designing and operating reliable, secure, efficient, and cost-effective systems in the cloud. The well-architected approach to building systems will highly likely provide substantial benefits and measurable returns on investment.
The AWS Well-Architected Framework consists of a set of foundational questions for you to consistently measure your architectures against best practices and identify areas for improvement. The framework provides a consistent approach to evaluating systems against the qualities you expect from modern cloud-based systems, and the remediation that would be required to achieve those qualities. To help you review your systems against the best practices, AWS offers AWS Well-Architected Tool (AWS WA Tool), a free service in the cloud that provides a consistent process for you to review and measure your architecture using the AWS Well-Architected Framework. In addition, AWS offers AWS Well-Architected Labs to help you apply best practices. The lab provides you with a repository of code and documentation to give you hands-on experience implementing best practices.
Typically, organizations often have central Enterprise Technology Architecture teams to provide strategic context for the evolution and reach of digital capability in response to the constantly changing needs of the business environment. A typical Enterprise Architecture capability includes a set of architecture roles such as Business Architects, Infrastructure Architects, and Security Architects. AWS Well-Architected Framework prefers to distribute technology architecture capabilities into teams rather than having a central team with that capability. Undoubtedly, this approach introduces risks with distribution of the enterprise architecture decision-making authority. The framework mitigates these risks by enabling each team, along with an expert, to raise the bar on technology architecture standards and maintain them. Additionally, it implements automated methods to ensure the technology standards are being met. The approach enables security architects and threat hunters to be embedded in the SOC and security operation team to work closely with vulnerability threat and management. The distributed approach of the framework is supported by Amazon's leadership principles and establishes a culture across all roles that works back from the customer. Customer-obsessed teams build products in response to a customer need.
The framework also provides a set of general guidance and principles to design a robust cloud architecture. With cloud computing there is no need to guess the system capacity needs upfront. You can start with as little capacity as you need, knowing the compute will scale up and down automatically. The cloud provides the ability to test the applications at production-scale for a fraction of the cost of testing on-premises. With the cloud automation to create and replicate the workloads at low cost, the architecture experimentation has never been easier. This allows systems to evolve to meet the ongoing business needs. The cloud provides the ability to drive system architecture using data. The real-time system monitoring can inform the architecture choices and improvements over time. In cloud, there is also the ability to improve through game days by simulating a failure or event to test systems, processes, and team responses.
The Five Pillars of the Well-Architected Framework
If you have ever built a house, you would agree foundation is one of the most critical elements even though it is not visible when the house is built. Software development in cloud is like designing a house. If the foundation is not solid, structural problems can undermine the integrity and function of the building. Speaking in metaphor, a professional residential architect, together with a reputable building contractor, structural engineers, and various others, design a house. Once the design is complete, the same design can be constructed multiple times. When architecting the systems in AWS, incorporating the five pillars of the Well-Architected Framework will help you develop stable and efficient systems.
The five pillars are Operational Excellence, Security, Reliability, Performance Efficiency, and Cost Optimization. Figure 6.1 and the following sections show further details.
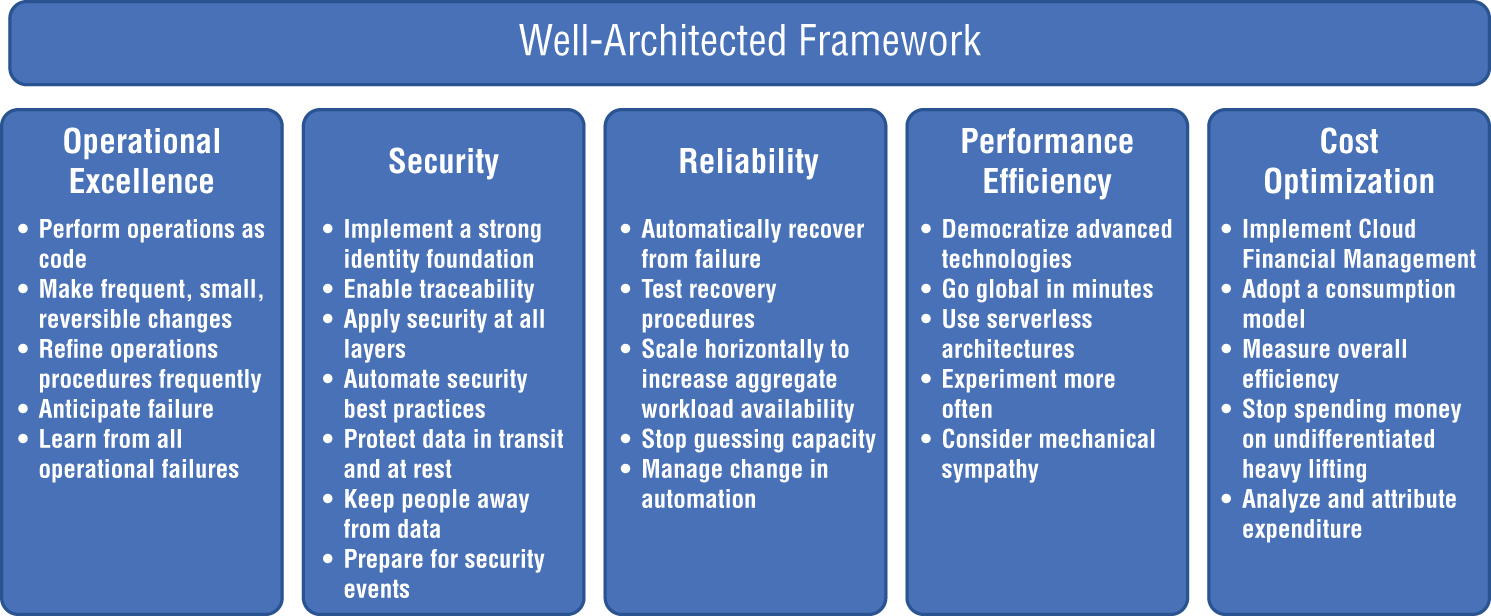
Figure 6.1: The AWS Well-Architected Framework
Operational Excellence
The Operational Excellence pillar includes the ability to support development and run workloads effectively, gain insight into their operations, and to continuously improve supporting processes and procedures to deliver business value.
Security
The Security pillar encompasses the ability to protect data, systems, and assets to take advantage of cloud technologies to improve your security.
Reliability
The Reliability pillar encompasses the ability of a workload to perform its intended function correctly and consistently when it's expected to. This includes the ability to operate and test the workload through its total lifecycle.
Performance Efficiency
The Performance Efficiency pillar includes the ability to use computing resources efficiently to meet system requirements, and to maintain that efficiency as demand changes and technologies evolve.
Cost Optimization
The Cost Optimization pillar includes the ability to run systems to deliver business value at the lowest price point.
The Shared Responsibility Model
Security and compliance is a shared responsibility between AWS and the customer. This shared model can help relieve the customer's operational burden as AWS operates, manages, and controls the components from the host operating system and virtualization layer down to the physical security of the facilities in which the service operates. The customer assumes responsibility and management of the guest operating system (including updates and security patches), other associated application software, as well as the configuration of the AWS-provided security group firewall. Customers should carefully consider the services they choose as their responsibilities vary depending on the services used, the integration of those services into their IT environment, and applicable laws and regulations. The nature of this shared responsibility also provides the flexibility and customer control that permits the deployment. As shown in Figure 6.2, this differentiation of responsibility is commonly referred to as security “of” the cloud versus security “in” the cloud.
- AWS's responsibility is “Security of the Cloud.” AWS is responsible for protecting the infrastructure that runs all of the services offered in the AWS Cloud. This infrastructure is composed of the hardware, software, networking, and facilities that run AWS Cloud services.
- The customer responsibility is “Security in the Cloud.” Customer responsibility will be determined by the AWS Cloud services that a customer selects. This determines the amount of configuration work the customer must perform as part of their security responsibilities. For example, a service such as Amazon Elastic Compute Cloud (Amazon EC2) is categorized as Infrastructure as a Service (IaaS) and, as such, requires the customer to perform all of the necessary security configuration and management tasks. Customers that deploy an Amazon EC2 instance are responsible for management of the guest operating system (including updates and security patches), any application software or utilities installed by the customer on the instances, and the configuration of the AWS-provided firewall (called a security group) on each instance. For abstracted services, such as Amazon S3 and Amazon DynamoDB, AWS operates the infrastructure layer, the operating system, and platforms, and customers access the endpoints to store and retrieve data. Customers are responsible for managing their data (including encryption options), classifying their assets, and using IAM tools to apply the appropriate permissions.
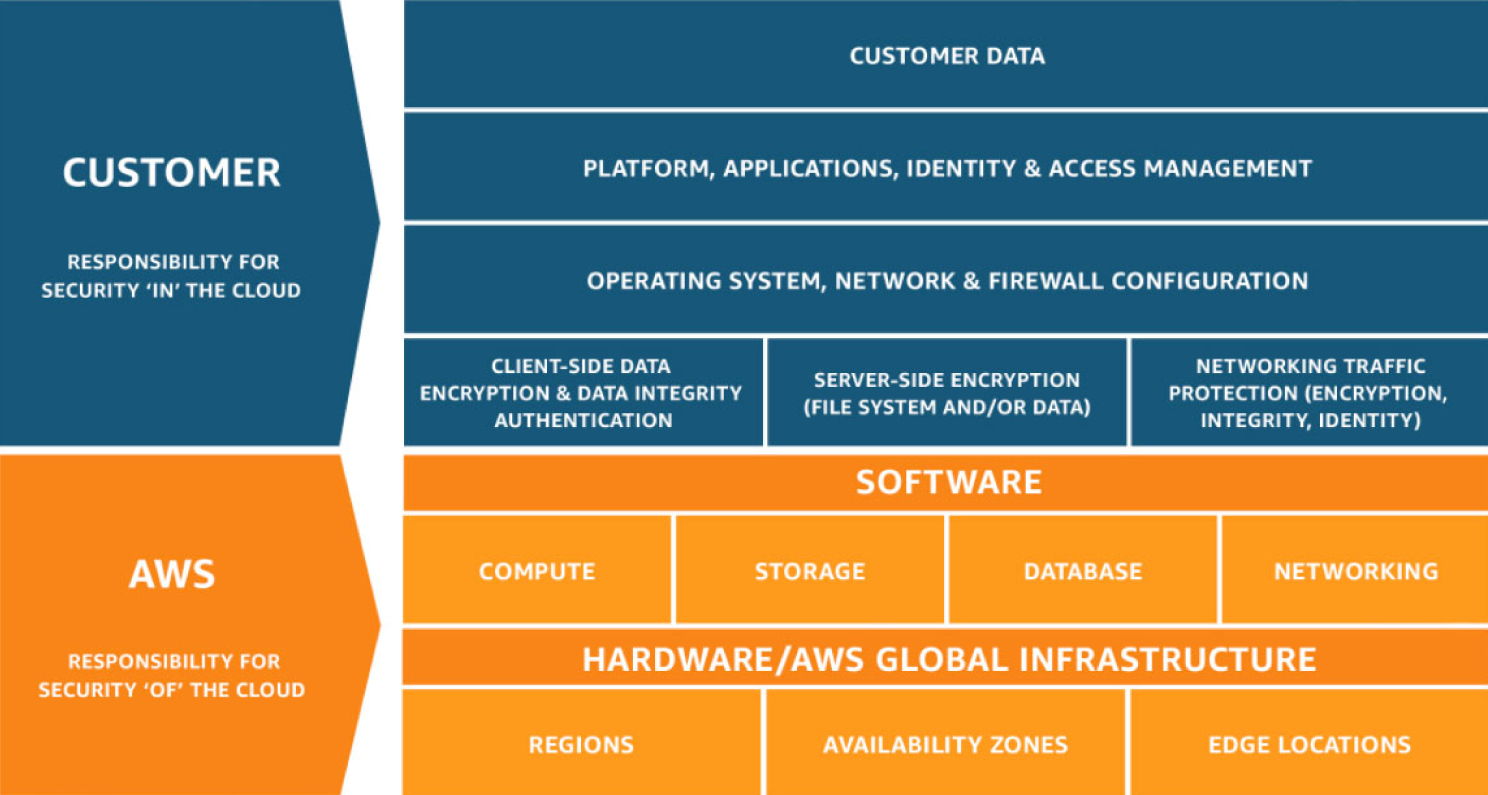
Figure 6.2: The AWS Shared Responsibility Model
This customer/AWS shared responsibility model also extends to IT controls. Just as the responsibility to operate the IT environment is shared between AWS and its customers, so is the management, operation, and verification of IT controls shared. AWS can help relieve customer burden of operating controls by managing those controls associated with the physical infrastructure deployed in the AWS environment that may previously have been managed by the customer. As every customer is deployed differently in AWS, customers can take advantage of shifting management of certain IT controls to AWS, which results in a (new) distributed control environment. Customers can then use the AWS control and compliance documentation available to them to perform their control evaluation and verification procedures as required.
Here are examples of controls that are managed by AWS, AWS customers, and/or both:
- Inherited controls: Controls that a customer fully inherits from AWS, such as physical and environmental controls.
- Shared controls: Controls that apply to both the infrastructure layer and customer layers, but in completely separate contexts or perspectives. In a shared control, AWS provides the requirements for the infrastructure and the customer must provide their own control implementation within their use of AWS services. Examples include:
- Patch Management: AWS is responsible for patching and fixing flaws within the infrastructure, but customers are responsible for patching their guest OS and applications.
- Configuration Management: AWS maintains the configuration of its infrastructure devices, but a customer is responsible for configuring their own guest operating systems, databases, and applications.
- Awareness and training: AWS trains AWS employees, but a customer must train their own employees.
- Customer specific: Controls that are solely the responsibility of the customer based on the application they are deploying within AWS services. Examples include service and communications protection or zone security, which may require a customer to route or zone data within specific security environments.
AWS Services for Monitoring, Logging, and Alerting
The monitoring, logging, and alerting polices are an important aspect of the customer responsibility in the AWS Shared Responsibility. These policies enable the customers to improve their chances of detecting malicious behavior on systems and networks. Monitoring is an important part of maintaining the reliability, availability, and performance of AWS solutions. AWS provides tools and features that enable the customers to record and monitor the cyber security-related events on a continual basis within the AWS environment.
Monitoring, logging, and alerting are an important part of maintaining security controls in AWS solutions. Monitoring is also important to maintain the reliability, availability, and performance of AWS solutions. Being able to visualize AWS security alerts, compliance, and detailed information in one location allows for faster threat response times.
This section takes a deep dive into the different AWS services for logging, monitoring, and alerting that are available for AWS hosted applications.
AWS CloudTrail
AWS CloudTrail is a service that enables governance, compliance, operational auditing, and risk auditing of your AWS account. With CloudTrail, you can log, continuously monitor, and retain account activity related to actions across your AWS infrastructure. CloudTrail provides event history of your AWS account activity, including actions taken through the AWS Management Console, AWS SDKs, command-line tools, and other AWS services. This event history simplifies security analysis, resource change tracking, and troubleshooting. In addition, you can use CloudTrail to detect unusual activity in your AWS accounts. These capabilities help simplify operational analysis and troubleshooting.
AWS CloudTrail is one of the most used and effective tools to govern compliance and auditing in the AWS environment. Typically, in a large organization the AWS environment may include hundreds of EC2 servers, databases, load balancers, security groups, route tables, transit gateways, network ACLs, and endpoints. In such a complex environment, it is a nightmare if the network goes down. Analyzing through all networking resources to determine why the traffic is no longer routing correctly is tedious. It might take hours to resolve a simple route table misconfiguration and have the traffic back up and running. Having AWS CloudTrail enabled will allow the organization to troubleshoot and pinpoint the root cause in minutes.
AWS CloudTrail is enabled on your AWS account when you create it. The AWS CloudTrail dashboard shows the CloudTrail insights and event history as shown in Figure 6.3. When activity occurs in your AWS account, that activity is recorded in a CloudTrail event. You can easily view events in the CloudTrail console by going to Event History.
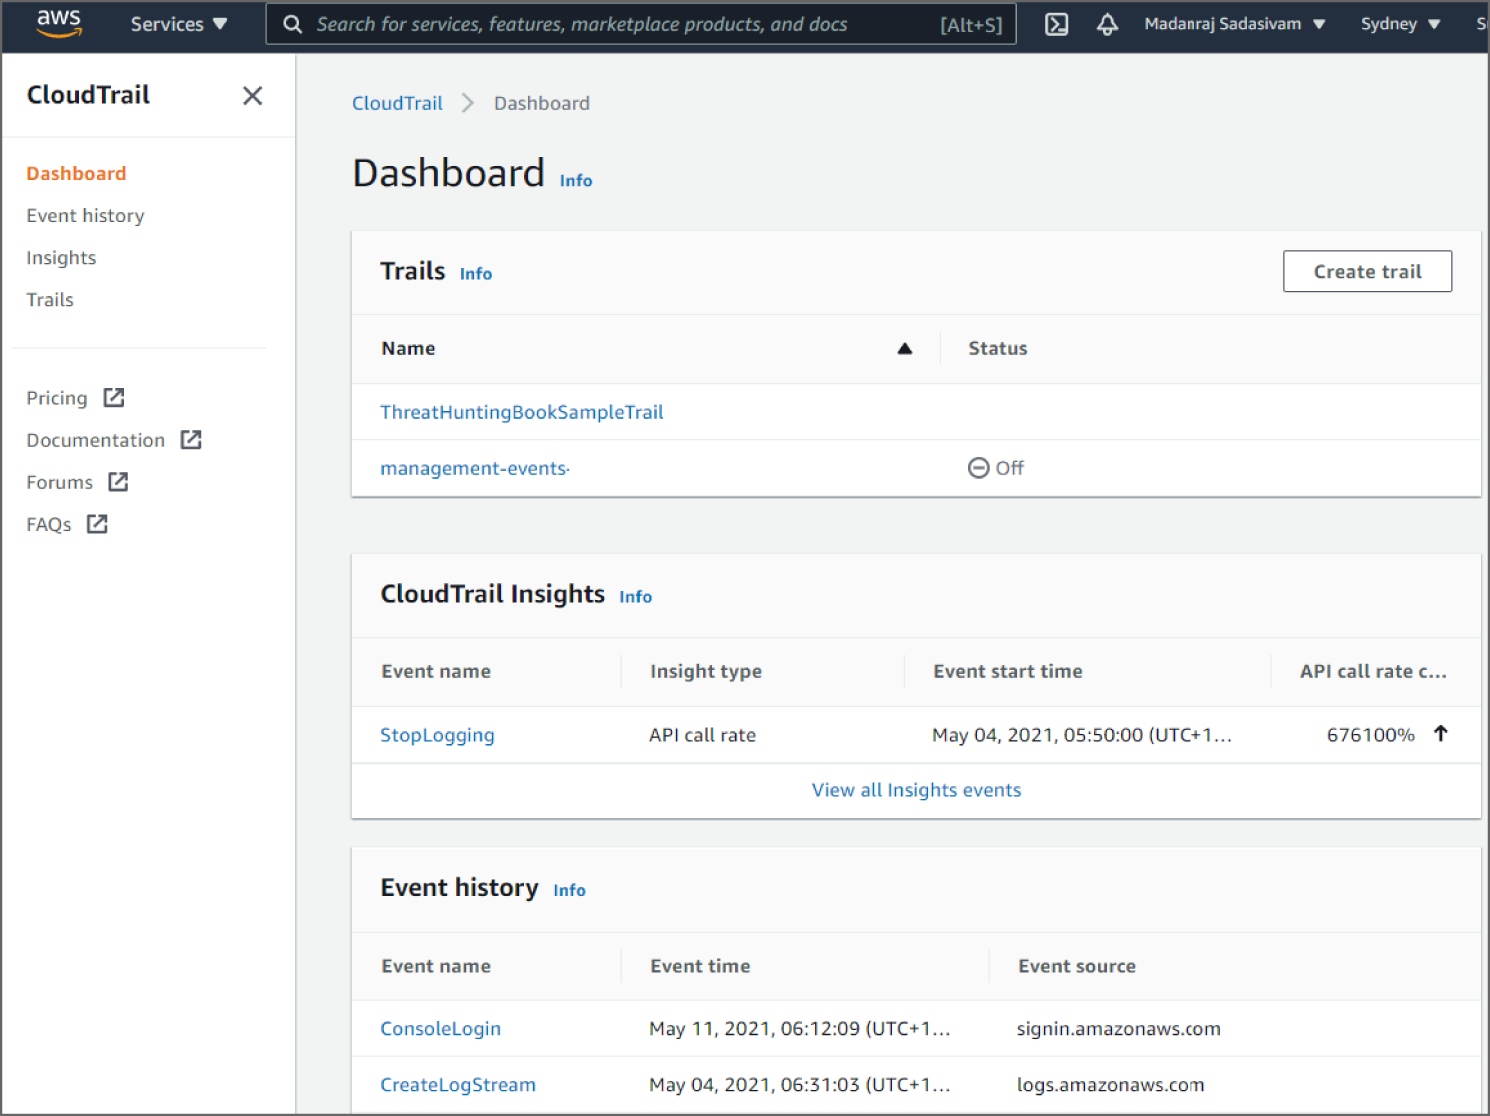
Figure 6.3: The CloudTrail console dashboard page
Event History allows you to view, search, and download the past 90 days of activity in your AWS account. In addition, you can create a CloudTrail trail to archive, analyze, and respond to changes in your AWS resources. A trail is a configuration that enables delivery of events to an Amazon S3 bucket that you specify. You can also deliver and analyze events in a trail with Amazon CloudWatch Logs and Amazon CloudWatch Events. You can create a trail with the CloudTrail console, the AWS CLI, or the CloudTrail API. You can create two types of trails for an AWS account:
- A trail that applies to all regions: When you create a trail that applies to all regions, CloudTrail records events in each region and delivers the CloudTrail event log files to an S3 bucket that you specify. If a region is added after you create a trail that applies to all regions, that new region is automatically included, and events in that region are logged. Because creating a trail in all regions is a recommended best practice so you capture activity in all regions in your account, an all-regions trail is the default option when you create a trail in the CloudTrail console. You can only update a single-region trail to log all regions by using the AWS CLI.
- A trail that applies to one region: When you create a trail that applies to one region, CloudTrail records the events in that region only. It then delivers the CloudTrail event log files to an Amazon S3 bucket that you specify. You can only create a single-region trail by using the AWS CLI. If you create additional single trails, you can have those trails deliver CloudTrail event log files to the same Amazon S3 bucket or to separate buckets. This is the default option when you create a trail using the AWS CLI or the CloudTrail API.
Amazon CloudWatch Logs
Amazon CloudWatch monitors your Amazon Web Services (AWS) resources and the applications you run on AWS in real time. You can use CloudWatch to collect and track metrics, which are variables you can measure for your resources and applications.
The CloudWatch home page automatically displays metrics about every AWS service you use. You can additionally create custom dashboards to display metrics about your custom applications, and display custom collections of metrics that you choose.
You can create alarms that watch metrics and send notifications or automatically make changes to the resources you are monitoring when a threshold is breached. For example, you can monitor the CPU usage and disk reads and writes of your Amazon EC2 instances and then use this data to determine whether you should launch additional instances to handle increased load. You can also use this data to stop underused instances to save money. With CloudWatch, you gain system-wide visibility into resource utilization, application performance, and operational health.
Amazon CloudWatch dashboards are customizable home pages in the CloudWatch console that you can use to monitor your resources in a single view, even those resources that are spread across different regions (see Figure 6.4). You can use CloudWatch dashboards to create customized views of the metrics and alarms for your AWS resources. With dashboards, you can create the following:
- A single view for selected metrics and alarms to help you assess the health of your resources and applications across one or more regions. You can select the color used for each metric on each graph, so that you can easily track the same metric across multiple graphs.
- Dashboards that display graphs and other widgets from multiple AWS accounts and multiple regions.
- An operational playbook that provides guidance for team members during operational events about how to respond to specific incidents.
- A common view of critical resource and application measurements that can be shared by team members for faster communication flow during operational events.
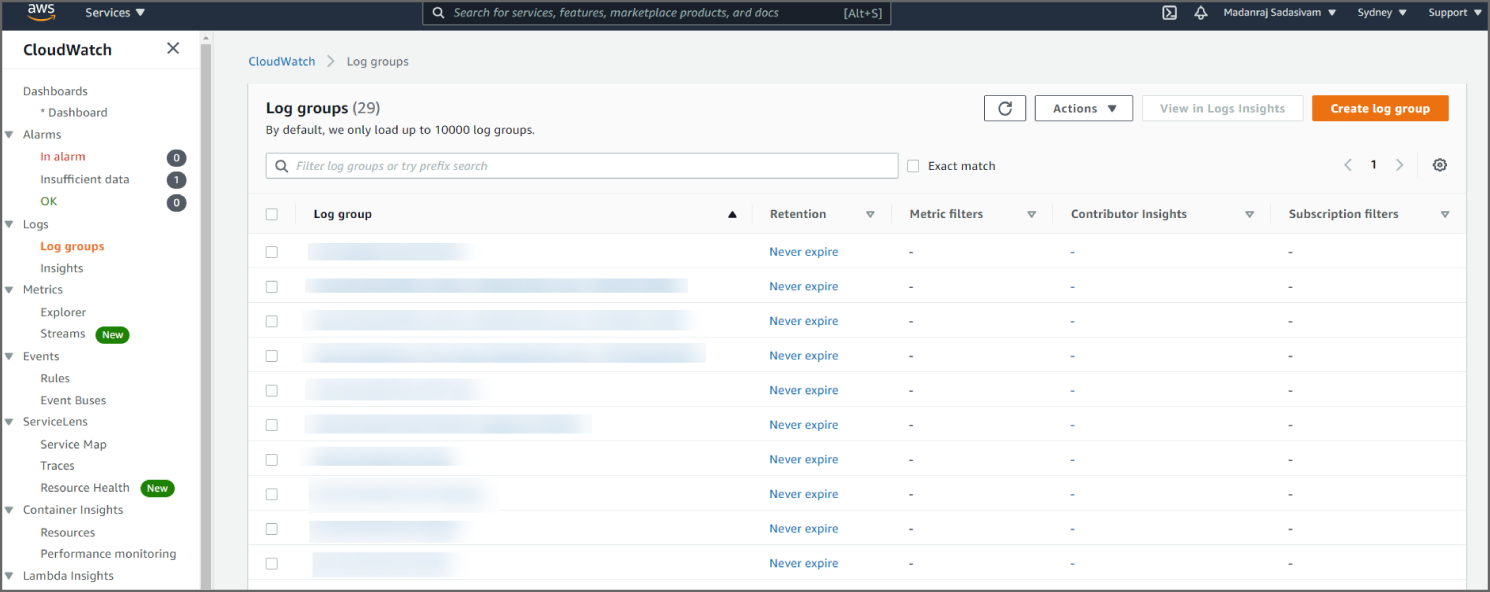
Figure 6.4: The CloudWatch Logs console
The CloudWatch Logs console shows the log groups. The log group details page shows information such as the stored bytes, subscriptions, Amazon Resource Name (ARN), included log streams, and more. The service allows you to interactively search and analyze the insights related to your Amazon CloudWatch Logs when a security event occurs.
Amazon VPC Flow Logs
VPC Flow Logs is a feature that enables you to capture information about the IP traffic going to and from network interfaces in your VPC. Flow log data can be published to Amazon CloudWatch Logs or Amazon S3. After you've created a flow log, you can retrieve and view its data in the chosen destination.
Flow logs can help you with a number of tasks, such as:
- Diagnosing overly restrictive security group rules
- Monitoring the traffic that is reaching your instance
- Determining the direction of the traffic to and from the network interfaces
Flow log data is collected outside of the path of your network traffic, and therefore does not affect network throughput or latency. You can create or delete flow logs without any risk of impact to network performance.
You can create a flow log for a VPC, a subnet, or a network interface. If you create a flow log for a subnet or VPC, each network interface in that subnet or VPC is monitored. Flow log data for a monitored network interface is recorded as flow log records, which are log events consisting of fields that describe the traffic flow.
To create a flow log, you specify:
- The resource for which to create the flow log
- The type of traffic to capture (accepted traffic, rejected traffic, or all traffic)
- The destinations to which you want to publish the flow log data
You can see in Figure 6.5 where the Amazon VPC flow logs can be found.
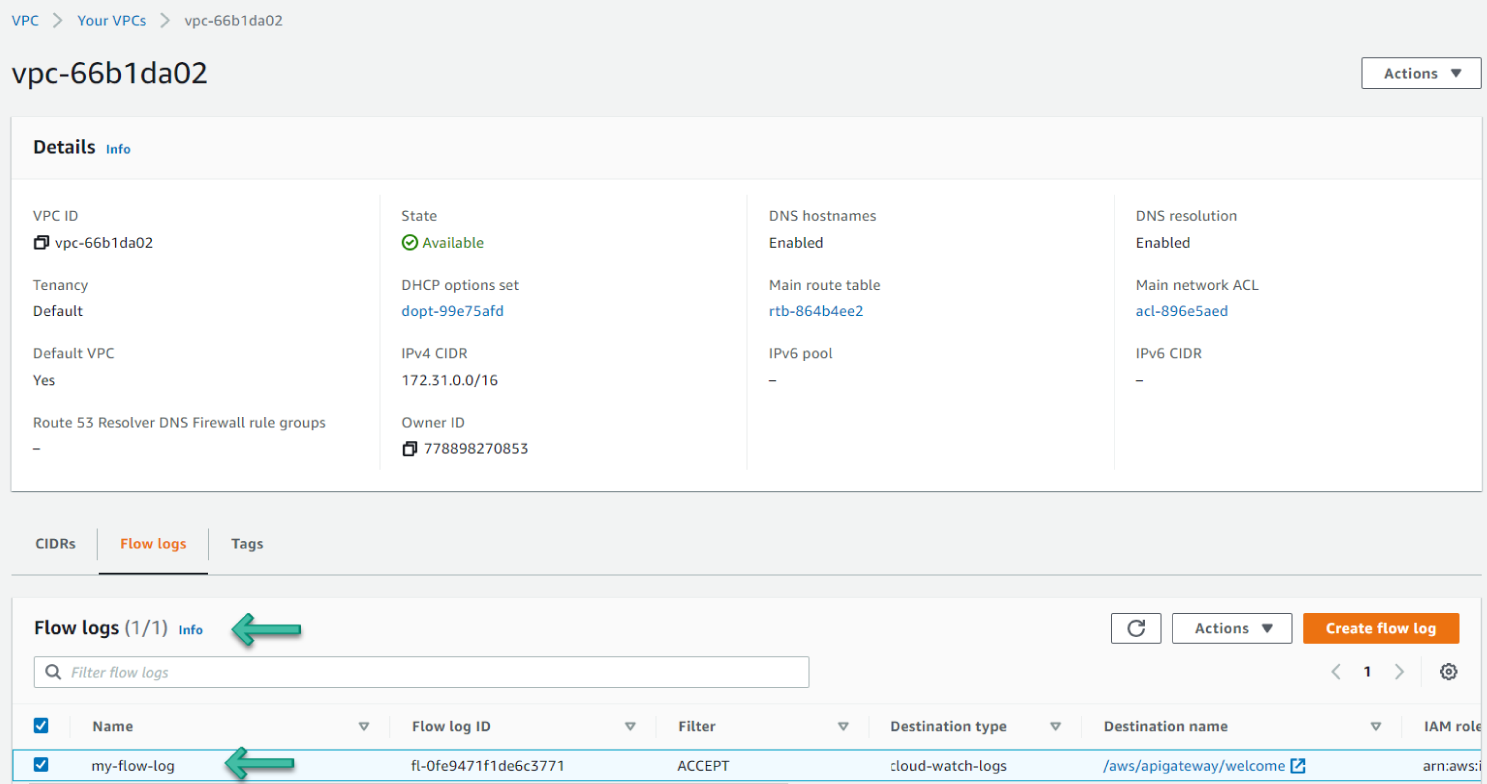
Figure 6.5: The VPC flow logs console
Amazon GuardDuty
Amazon GuardDuty is a continuous security monitoring service that analyzes and processes the following data sources: VPC Flow Logs, AWS CloudTrail management event logs, CloudTrail S3 data event logs, and DNS logs. It uses threat intelligence feeds, such as lists of malicious IP addresses and domains, and machine learning to identify unexpected and potentially unauthorized and malicious activity within your AWS environment. This can include issues like escalations of privileges, uses of exposed credentials, or communication with malicious IP addresses or domains. For example, GuardDuty can detect compromised EC2 instances serving malware or mining bitcoin. It also monitors AWS account access behavior for signs of compromise, such as unauthorized infrastructure deployments, like instances deployed in a region that has never been used, or unusual API calls, like a password policy change to reduce password strength.
GuardDuty informs you of the status of your AWS environment by producing security findings that you can view in the GuardDuty console or through Amazon CloudWatch events. You can see in Figure 6.6 an example of the Amazon GuardDuty dashboard.
Amazon GuardDuty correlates the system logs to allow for a more intelligent decision by providing more accurate events than other tools.
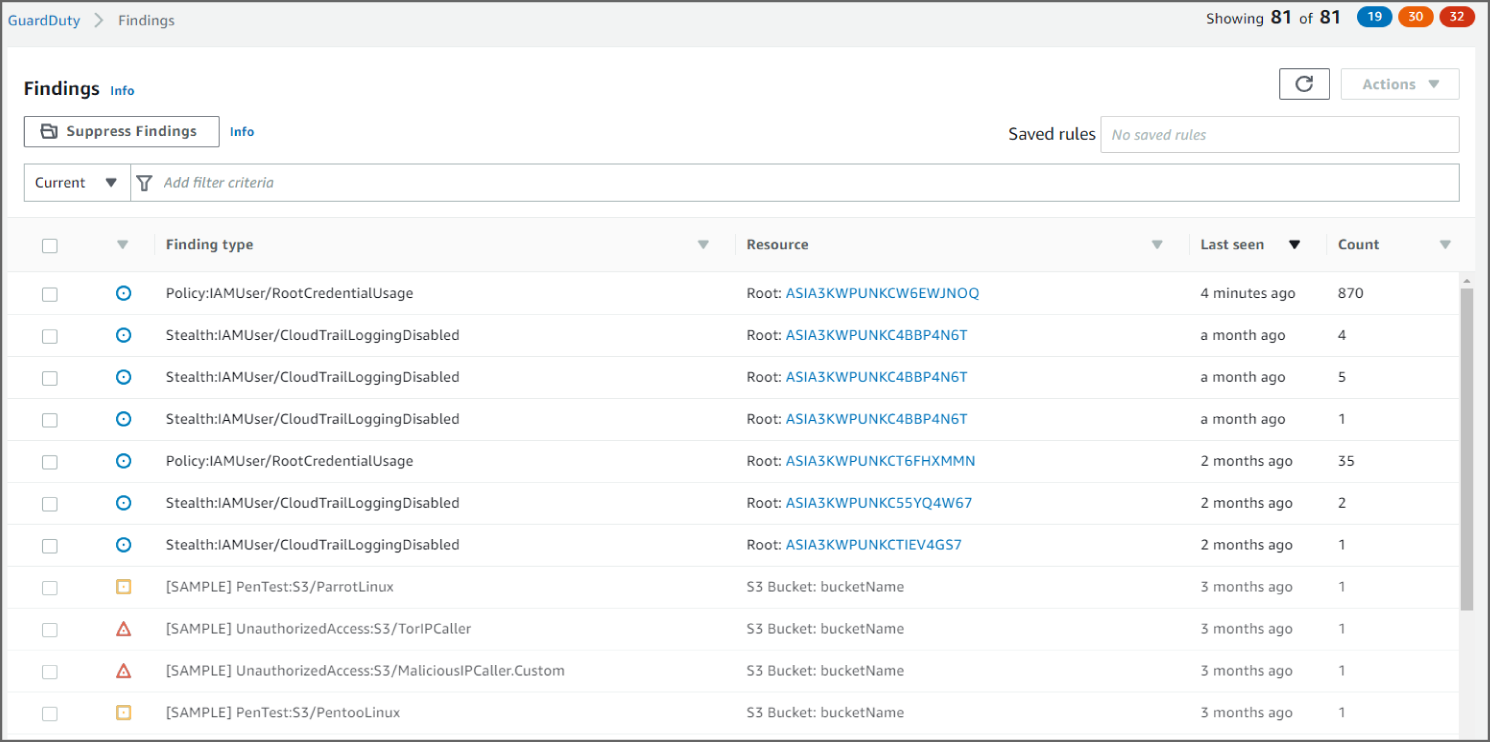
Figure 6.6: View of the GuardDuty dashboard
AWS Security Hub
AWS Security Hub gives you a comprehensive view of your security alerts and security posture across your AWS accounts. There are a range of powerful security tools at your disposal, from firewalls and endpoint protection to vulnerability and compliance scanners. But oftentimes this leaves your team switching back-and-forth between these tools to deal with hundreds, and sometimes thousands, of security alerts every day. With Security Hub, you now have a single place that aggregates, organizes, and prioritizes your security alerts, or findings, from multiple AWS services, such as Amazon GuardDuty, Amazon Inspector, Amazon Macie, AWS Identity and Access Management (IAM) Access Analyzer, AWS Systems Manager, and AWS Firewall Manager, as well as from AWS Partner Network (APN) solutions. AWS Security Hub continuously monitors your environment using automated security checks based on the AWS best practices and industry standards that your organization follows. You can also take action on these security findings by investigating them in Amazon Detective or by using Amazon CloudWatch Event rules to send the findings to ticketing, chat, Security Information and Event Management (SIEM), Security Orchestration Automation and Response (SOAR), and incident management tools or to custom remediation playbooks. Get started with AWS Security Hub in just a few clicks in the Management Console and once enabled, Security Hub will begin aggregating and prioritizing findings and conducting security checks.
As you can see in Figure 6.7, the AWS Security Hub dashboard gives a summary of security insights for small findings. Integrated dashboards bring together your security findings across accounts to show you the current security and compliance status. Now you can easily spot trends, identify potential issues, and take the necessary next steps. For example, you can send findings to ticketing, chat, email, or automated remediation systems using integration with Amazon CloudWatch Events.
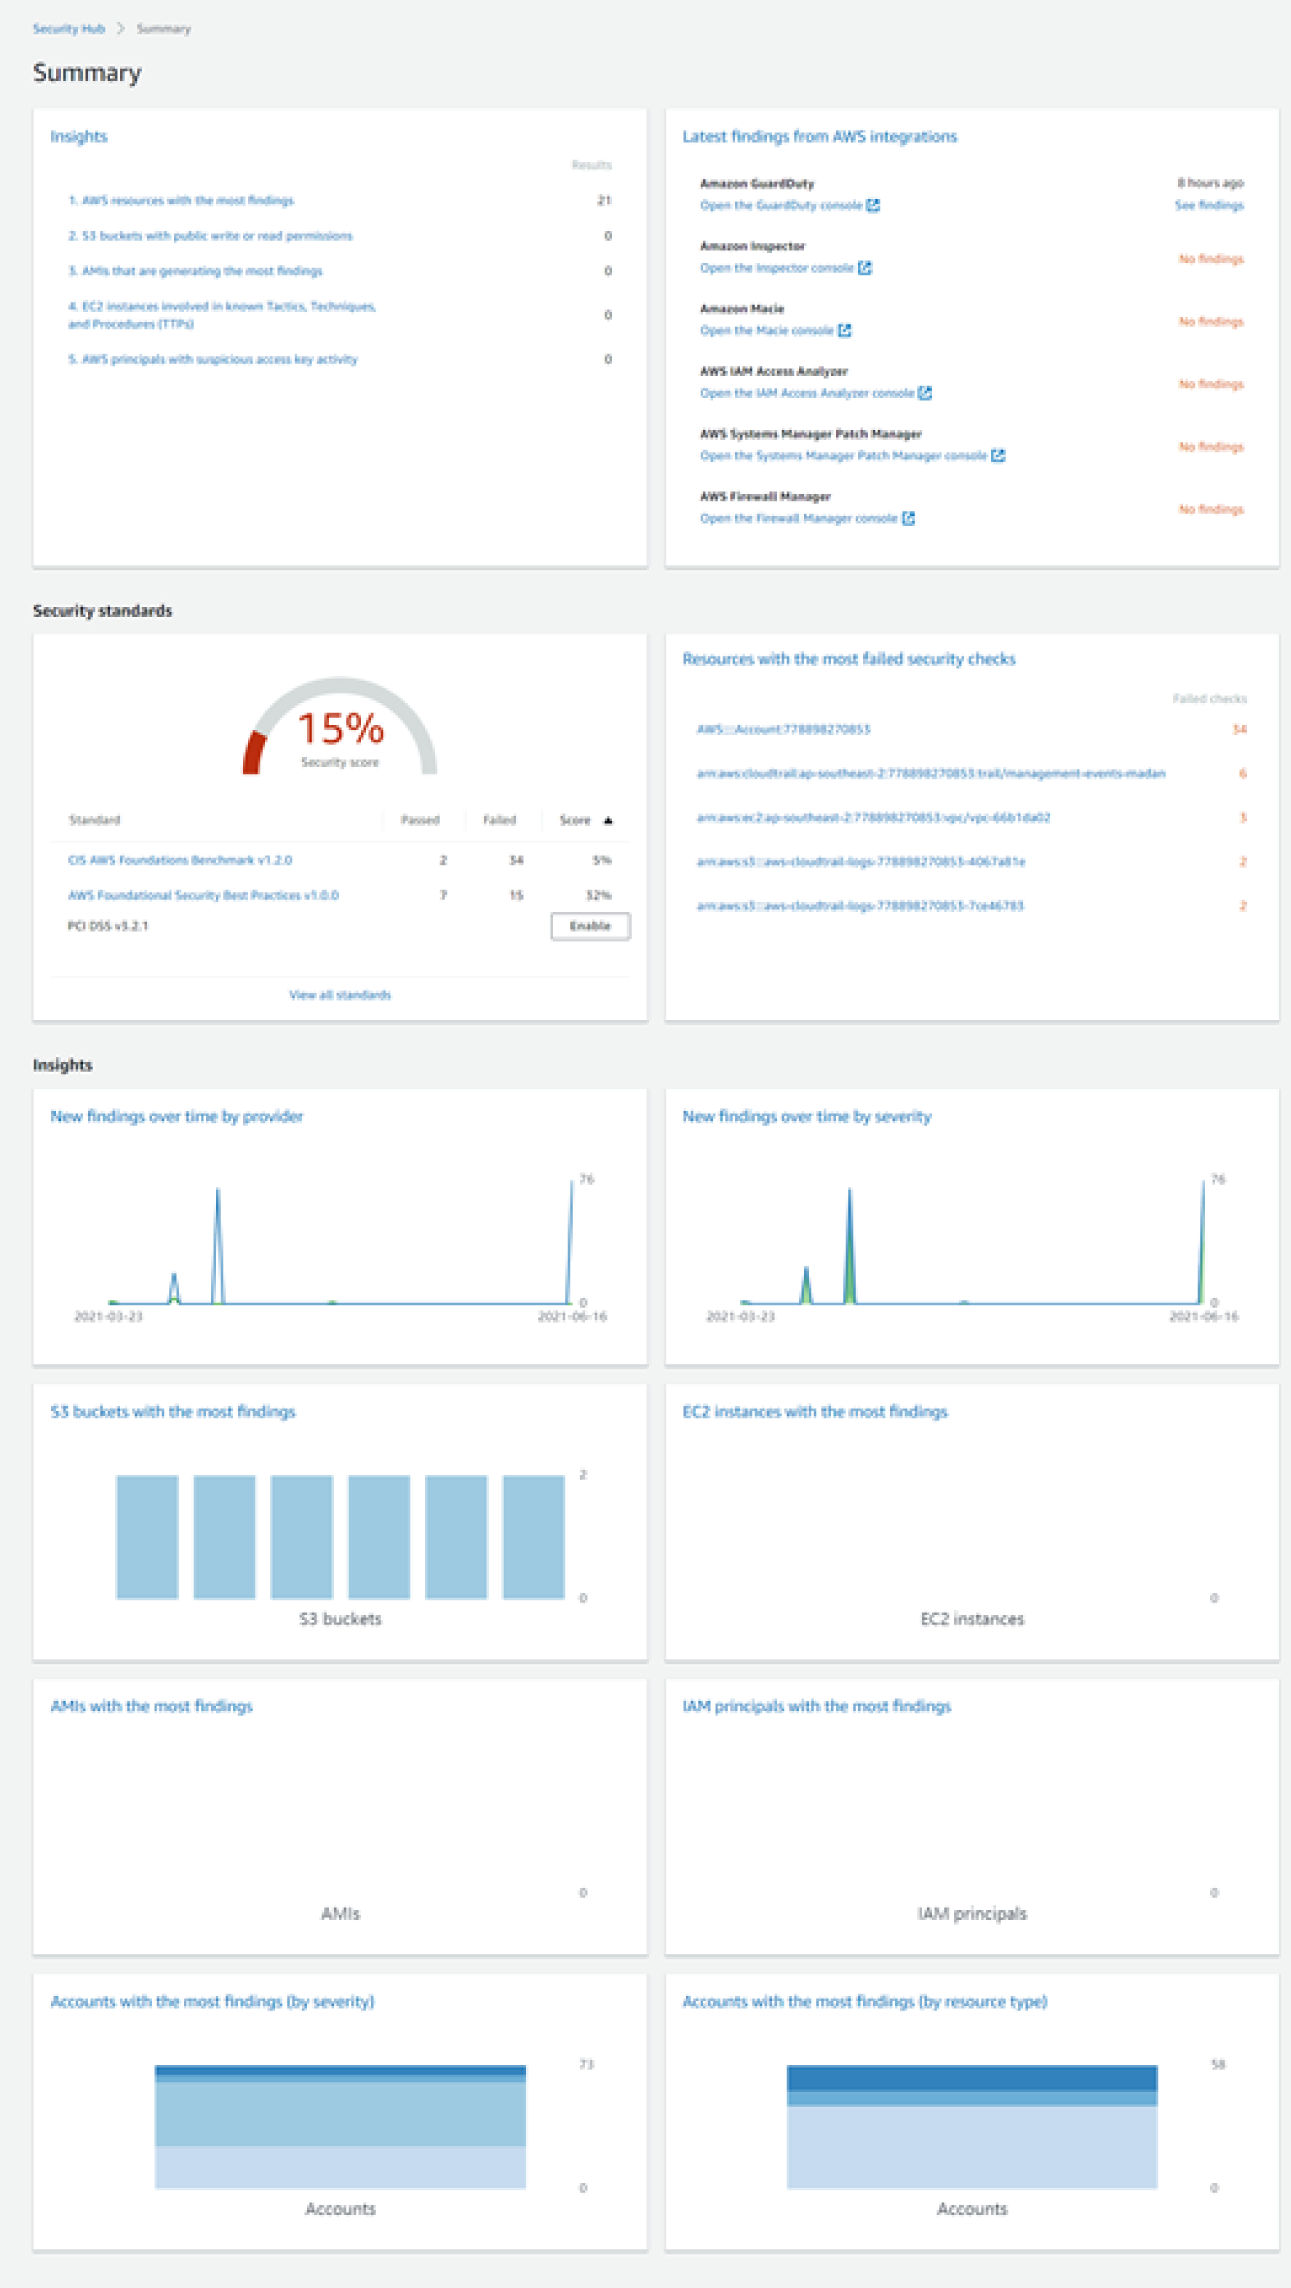
Figure 6.7: View of the Security Hub dashboard
AWS Protect Features
Organizations need to develop and implement the necessary security protections to restrict the effect of a possible cybersecurity incident. To comply with this requirement, an organization should track access to digital and physical resources, provide awareness and training, set up processes to secure data, manage network configuration baselines and operations to fix system components on time, and implement protective technologies to ensure cyber resilience.
How Do You Prevent Initial Access?
Adversaries may attempt to take advantage of a weakness in an Internet-facing computer or program using software, data, or commands in order to cause unintended or unanticipated behavior. The weakness in the system can be a bug, a glitch, or a design vulnerability. These applications are often websites, but can include databases, standard services such as SSH, network device administration and management protocols (like SNMP and Smart Install), and any other applications with Internet-accessible open sockets, such as web servers and related services.
SQL injection is one of several different types of code injection techniques used to attack data-driven applications. This is done by the attacker injecting an input in the query not intended by the programmer of the application gaining access of the database, which results in potential reading, modification, or deletion of users' data. The vulnerabilities are due to the lack of input validation, which is the most critical part of software security that is often not properly covered in the design phase of the software development lifecycle.
How Do You Protect APIs from SQL Injection Attacks Using API Gateway and AWS WAF?
When you build web applications, you probably look for a platform where you can build highly scalable, secure, and robust REST APIs. As APIs are publicly exposed, the use of Amazon API Gateway and AWS WAF avoids the malicious codes injected by the attackers. See Figure 6.8.
Amazon API Gateway handles all the tasks involved in accepting and processing up to hundreds of thousands of concurrent API calls, including traffic management, authorization and access control, monitoring, and API version management.
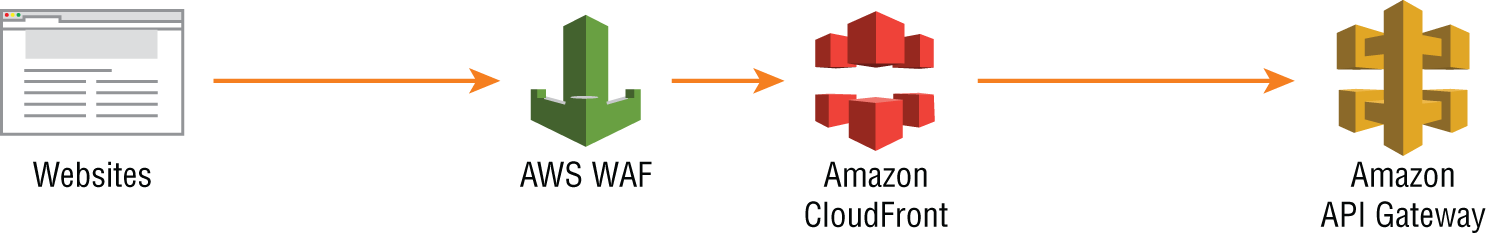
Figure 6.8: Amazon API Gateway and AWS WAF
AWS WAF is a web application firewall that helps protect your web applications from common web exploits such as SQL injection and cross-site scripting that could affect application availability, compromise security, or consume excessive resources.
The following walkthrough describes how to protect APIs provided by Amazon API Gateway using AWF WAF.
Prerequisites
- To use AWS WAF, Amazon API Gateway, and other AWS services, you need an AWS account. If you don't have an account, visit
https://aws.amazon.comand choose Create an AWS Account. - As a best practice, you should also create an AWS Identity and Access Management (IAM) user with administrator permissions and use that for all work that does not require root credentials.
- For an Amazon API Gateway REST API, AWS WAF is available in the regions listed at AWS service endpoints. You can use any of the regions in the list. For this walkthrough, use Asia Pacific (Sydney) region.
Create an API
For this walkthrough, use the example PetStore API provided in Amazon API Gateway by default. See Figure 6.9.
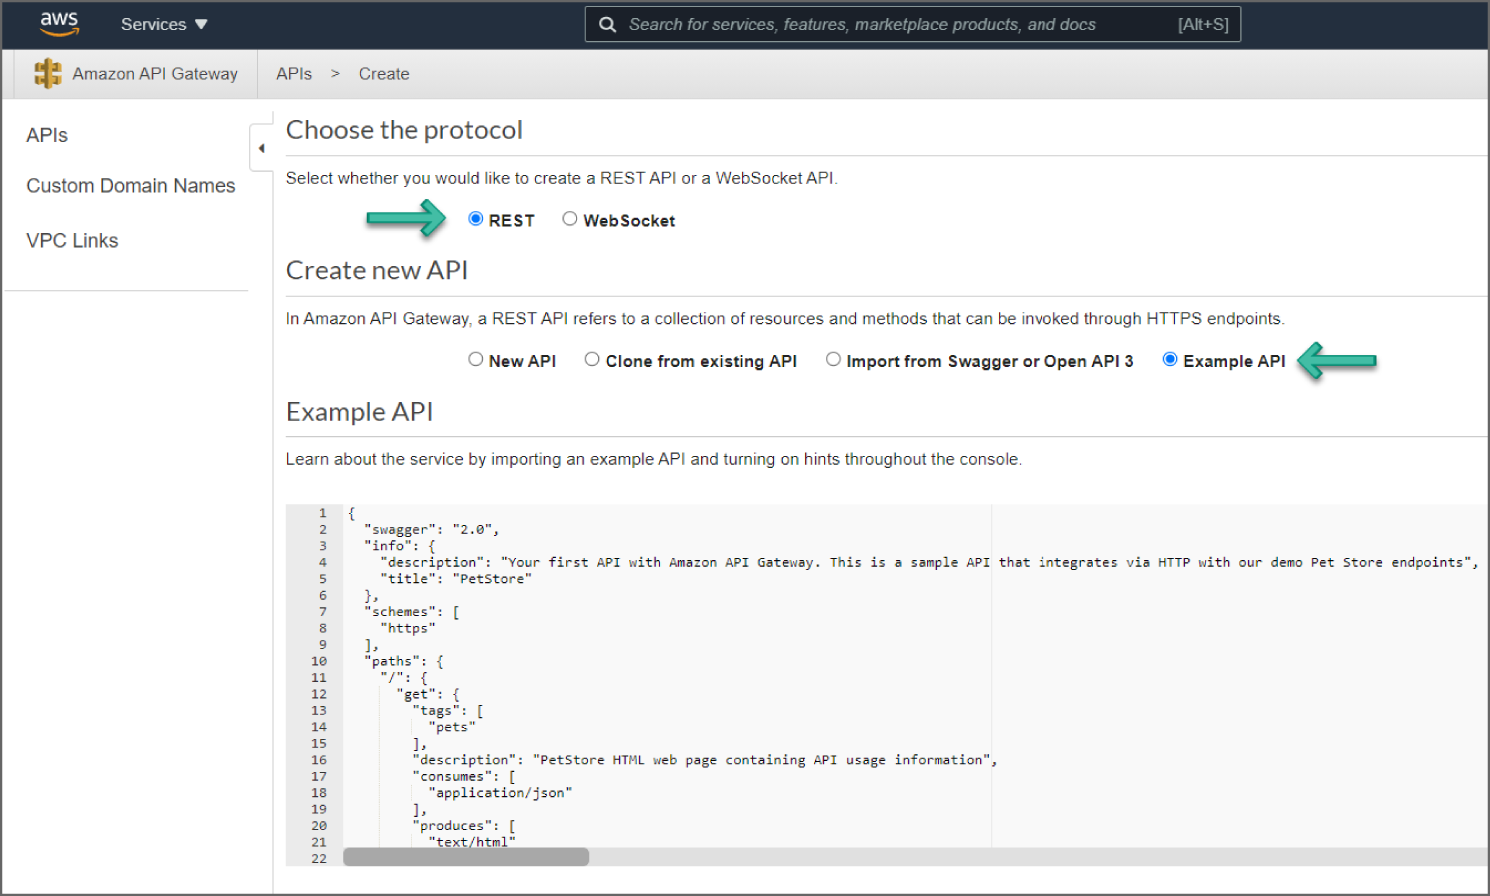
Figure 6.9: Create Example API
After you have created the PetStore API on your account, deploy a stage called “prod” for the PetStore API. On the API Gateway console, select the PetStore API and choose Actions ➪ Deploy API, as shown in Figure 6.10.
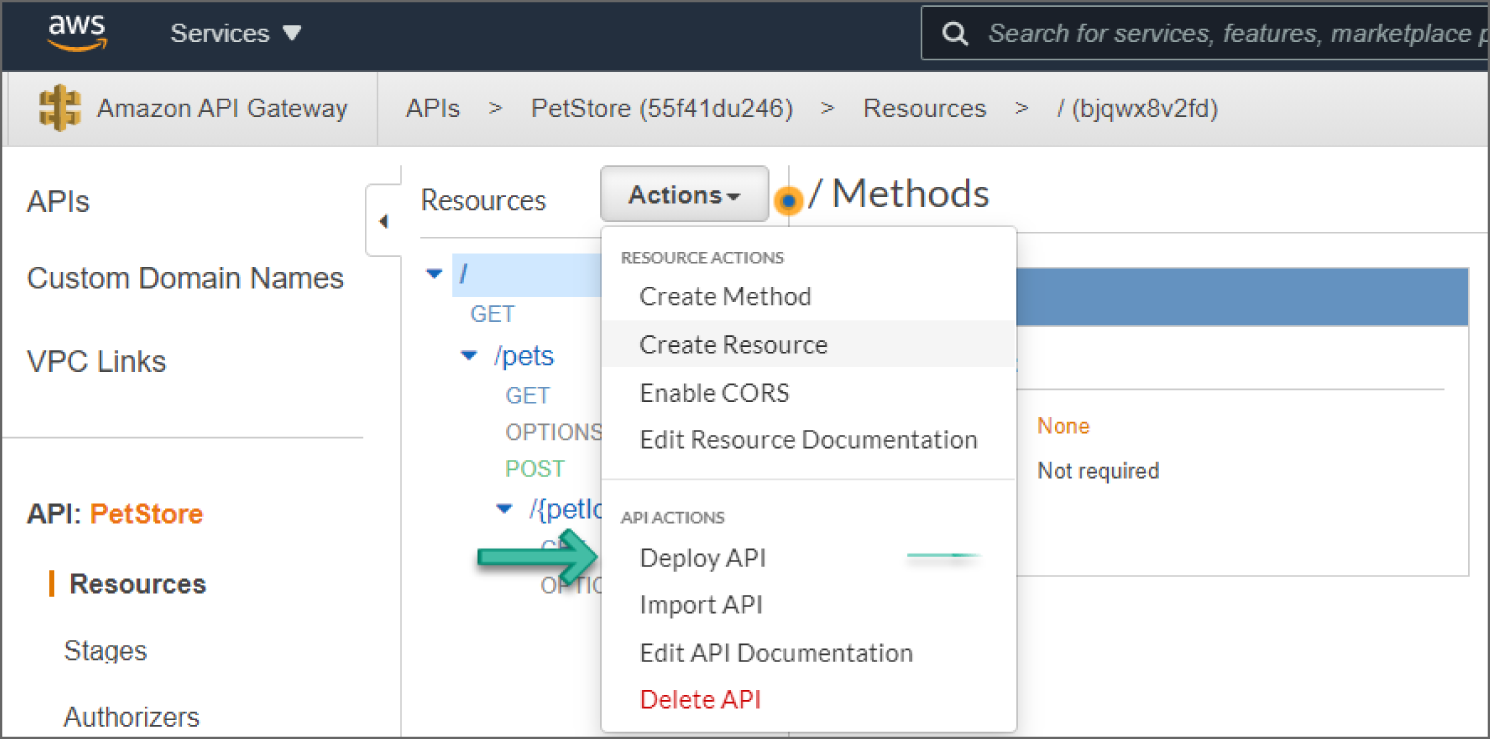
Figure 6.10: Deploy API screen
For Deployment Stage name, select [New Stage] and type prod for Stage name. Click Deploy and the new API stage is created. See Figure 6.11.
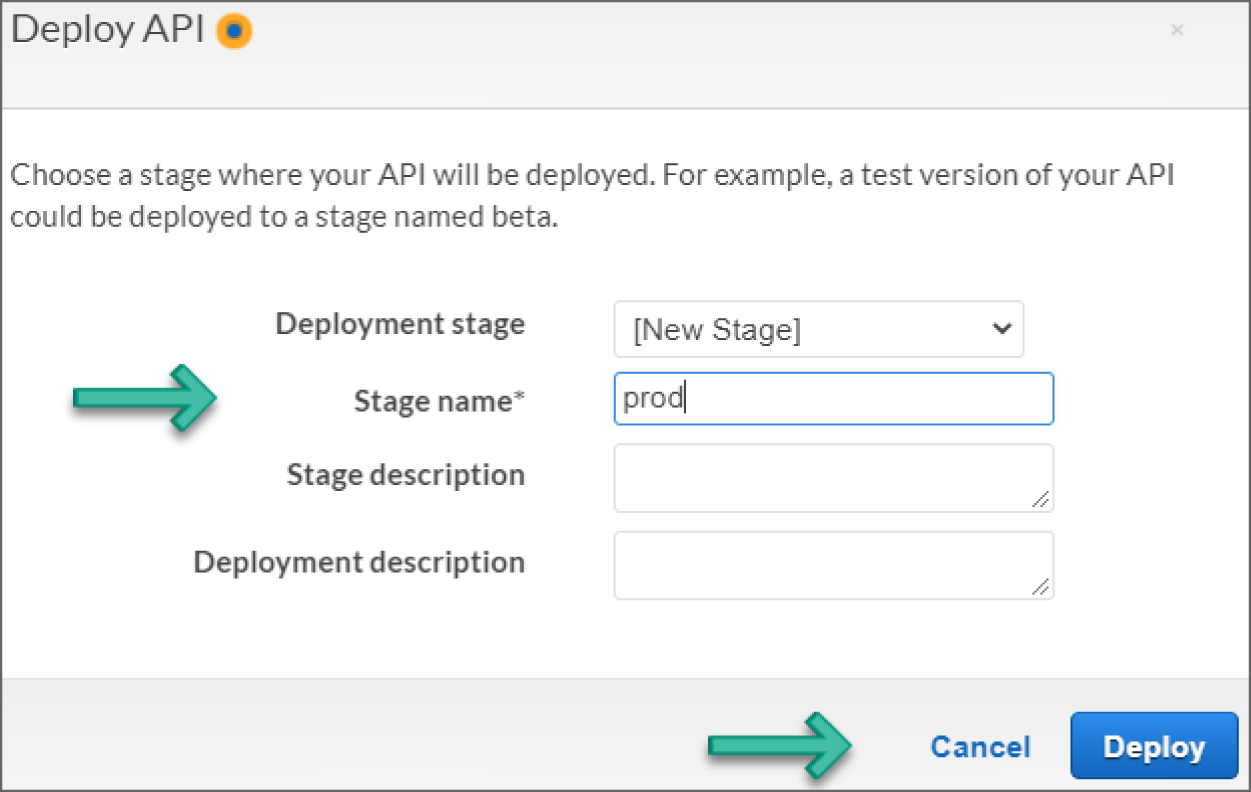
Figure 6.11: Create Stage name screen
Create and Configure an AWS WAF
Log in to AWS WAF and the AWS Shield dashboard. You should see Go to links for AWS WAF, AWS Shield, and AWS Firewall Manager. Currently, AWS WAF, AWS Shield, and AWS Firewall Manager are accessible from the same dashboard. If AWS decides to separate them, go to the dashboard for AWS WAF and continue with this walkthrough.
Next, click Go to AWS WAF. You should see the new AWS WAF landing page, as shown in Figure 6.12.
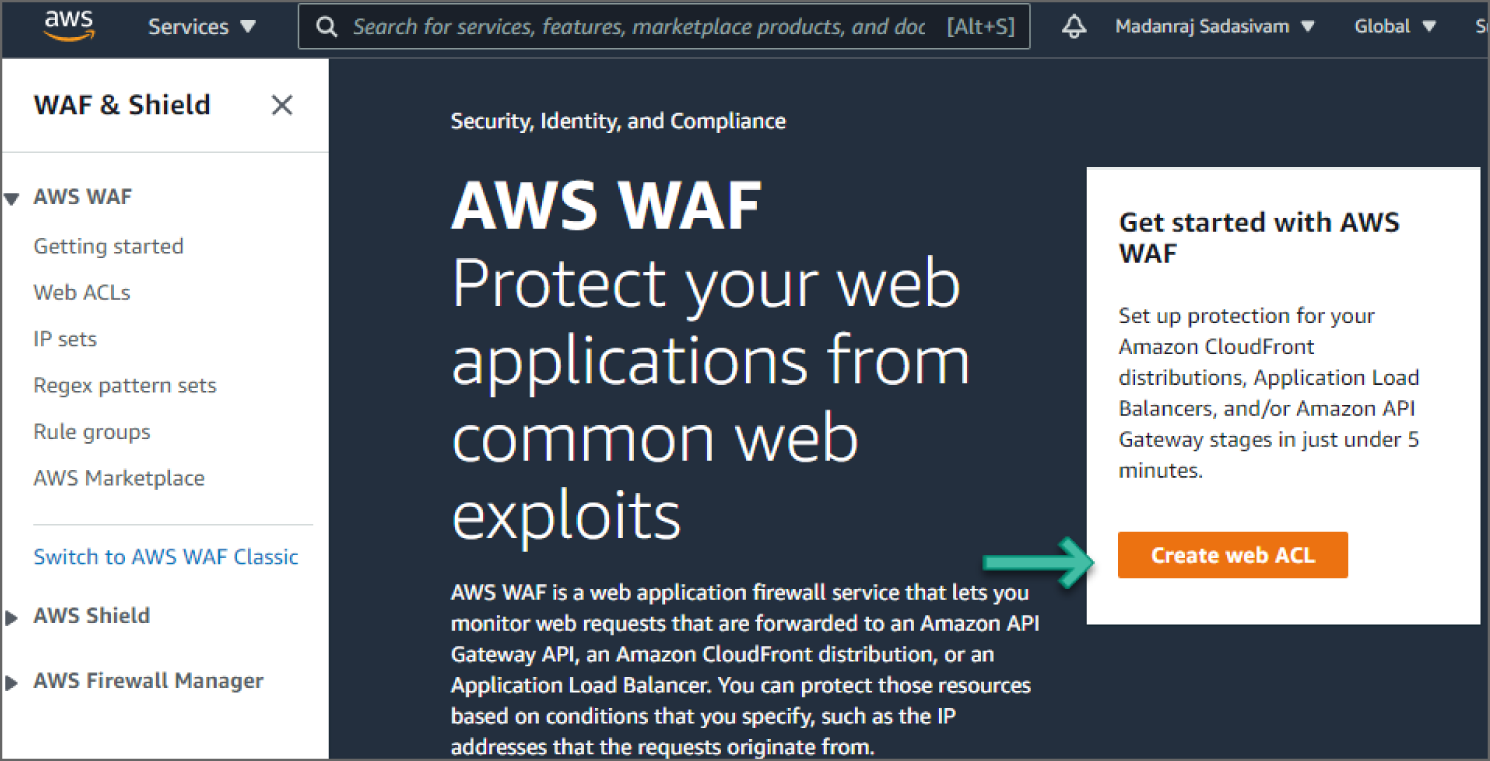
Figure 6.12: AWS WAF screen
AWS currently provides an option to switch to AWS WAF Classic. We will be using New AWS WAF, which is more flexible than AWS WAF Classic. AWS managed rule groups are only supported by the new WAF. Next, follow these steps:
- Click on Create Web ACL.
- In the Web ACL details section, provide a name in the Name field. Optionally, provide a description in the Description field.
- You can use the auto-populated value for the CloudWatch metric name field.
- For Resource type, select Regional resources (Application Load Balancer, API Gateway, AWS AppSync). See Figure 6.13.
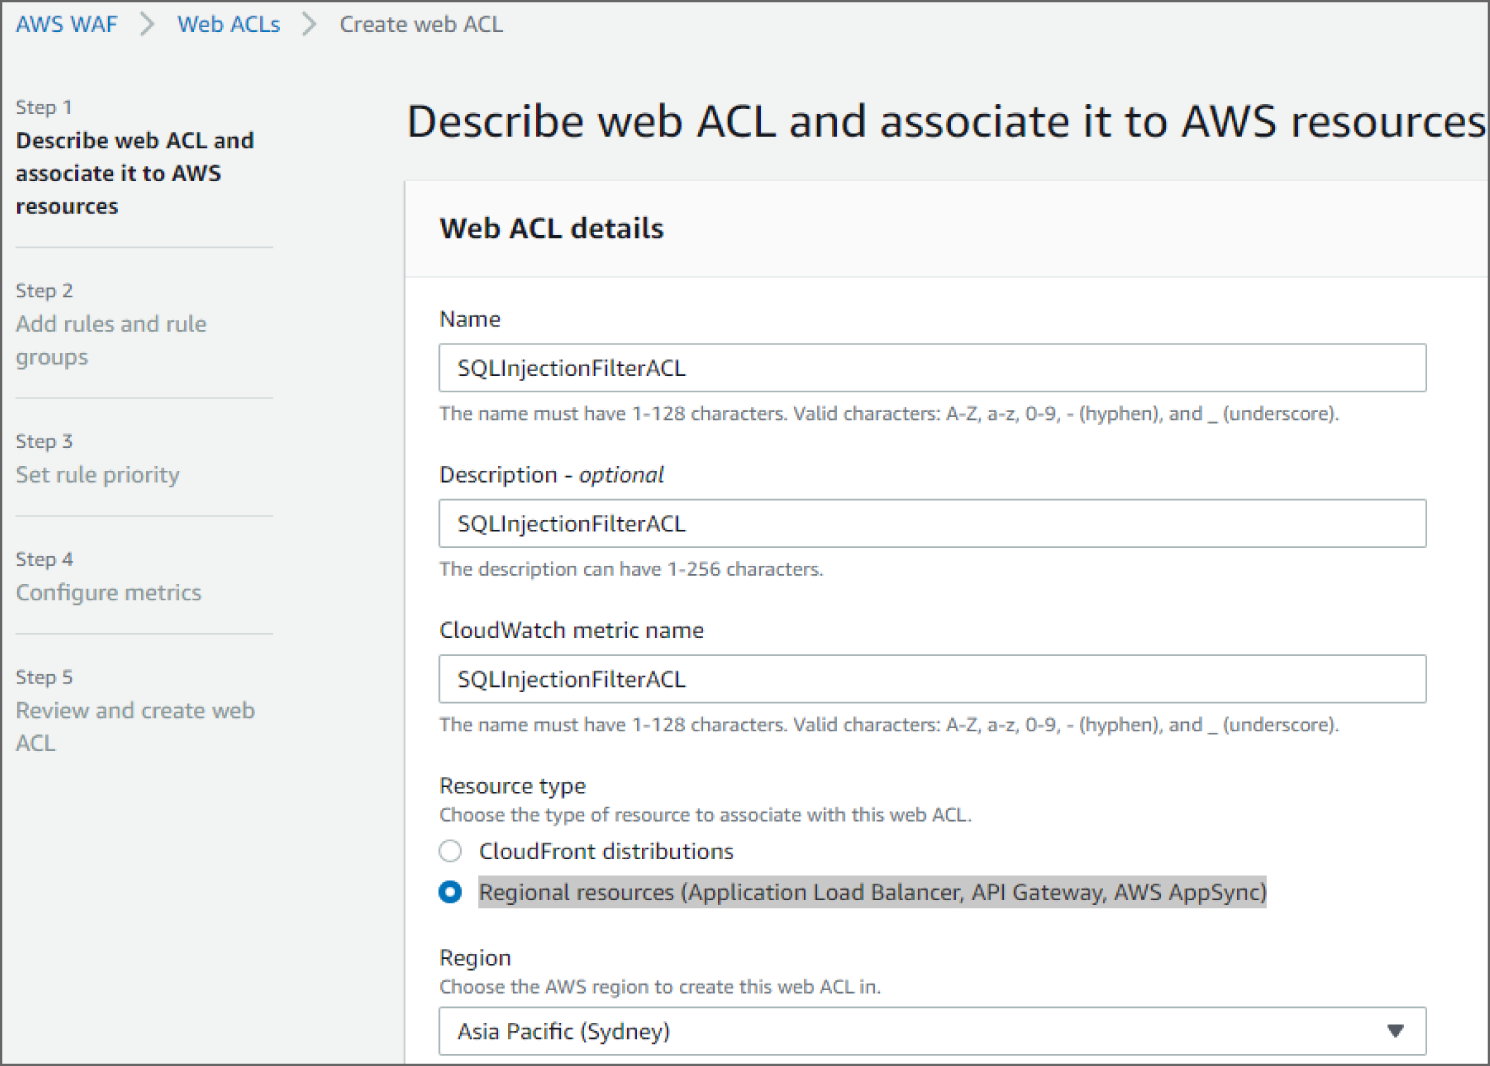
Figure 6.13: Describe Web ACL screen
- Under the Associated AWS resources section, click Add AWS Resources.
- On the Add AWS Resources screen, select the PetStore API created for this walkthrough and click Add. See Figure 6.14.
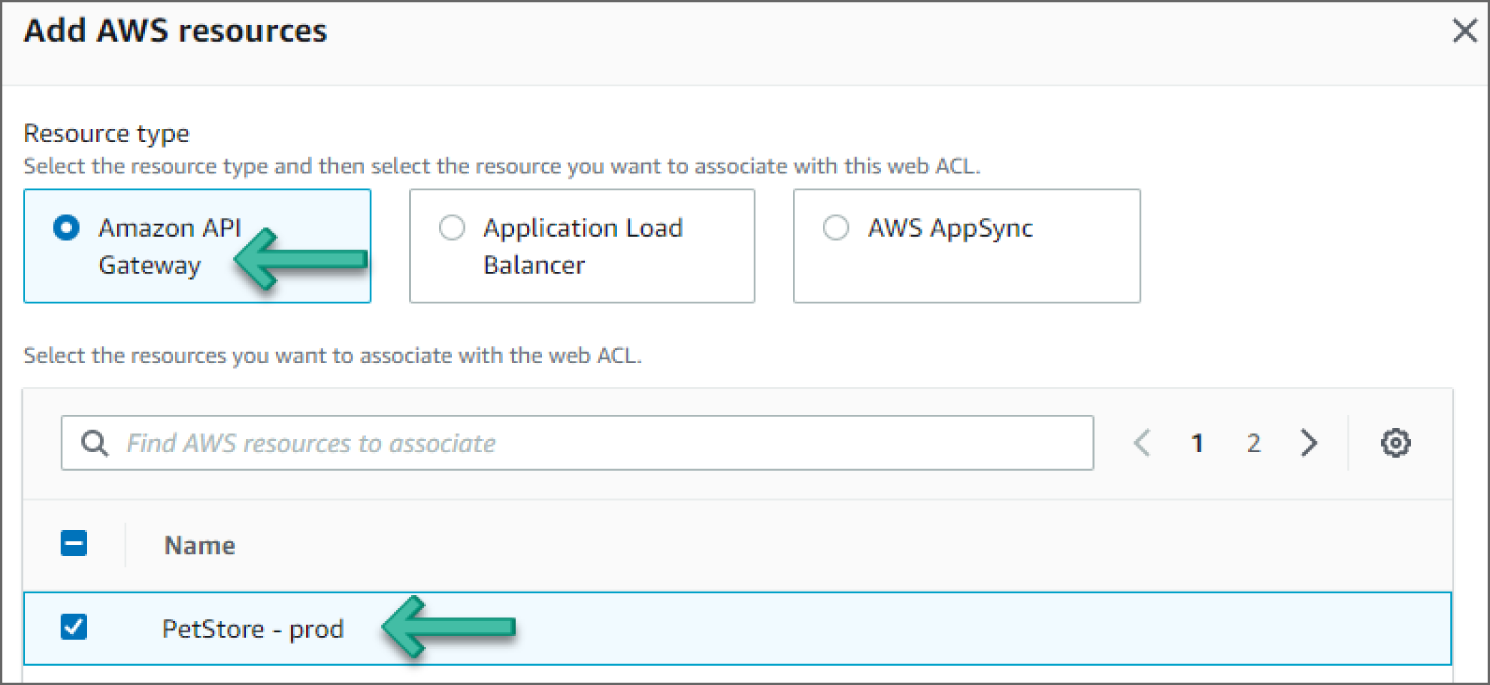
Figure 6.14: Add AWS Resource screen
- Once you're back at the Associated AWS resources section, select the PetStore – prod, API Gateway and click Next, as shown in Figure 6.15.
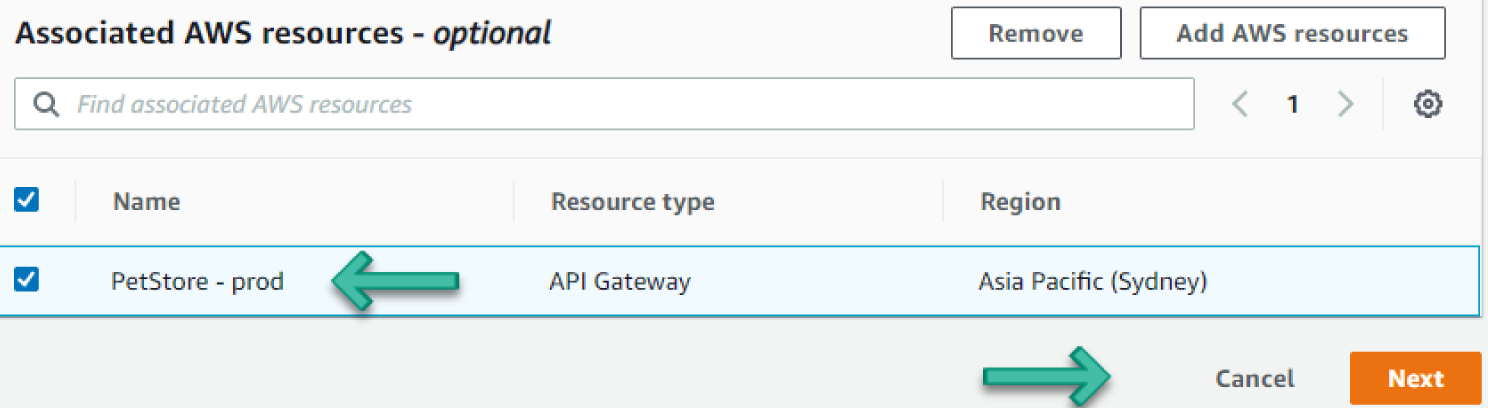
Figure 6.15: Associated AWS Resources screen
- On the Add Rules and Rule Groups page, expand the Add Rules drop-down and select Add My Own Rules and rule Groups. See Figure 6.16.
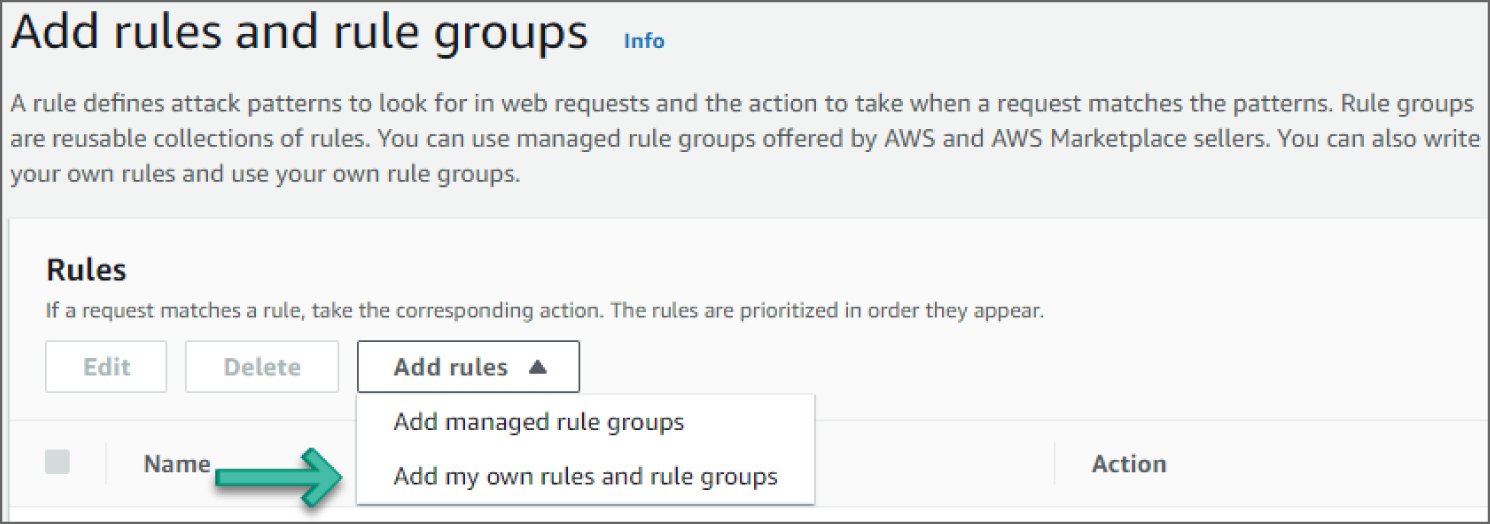
Figure 6.16: Add Rules and Rule Groups screen
- Under Rule builder, in the Rule section, provide a name in the Name field and set Type to Regular rule. Under If a Request, choose Matches the Statement. Under Inspect and Match type, in the Rule section, choose All Query Parameters and Contains SQL Injection Attacks, respectively. See Figure 6.17.
- Under the Then section, add an Action to Block and click Add rule, as shown in Figure 6.18.
- On the Add Rules and Rule Groups page, select Rule and for Default Web ACL action for requests that don't match any rules, select Allow. Click Next.
- On the Set Rule Priority page, select Rule as the first one and click Next.
- On the Configure Metrics page, select Rule. You will use the auto-populated value for the CloudWatch metric name. Click Next.
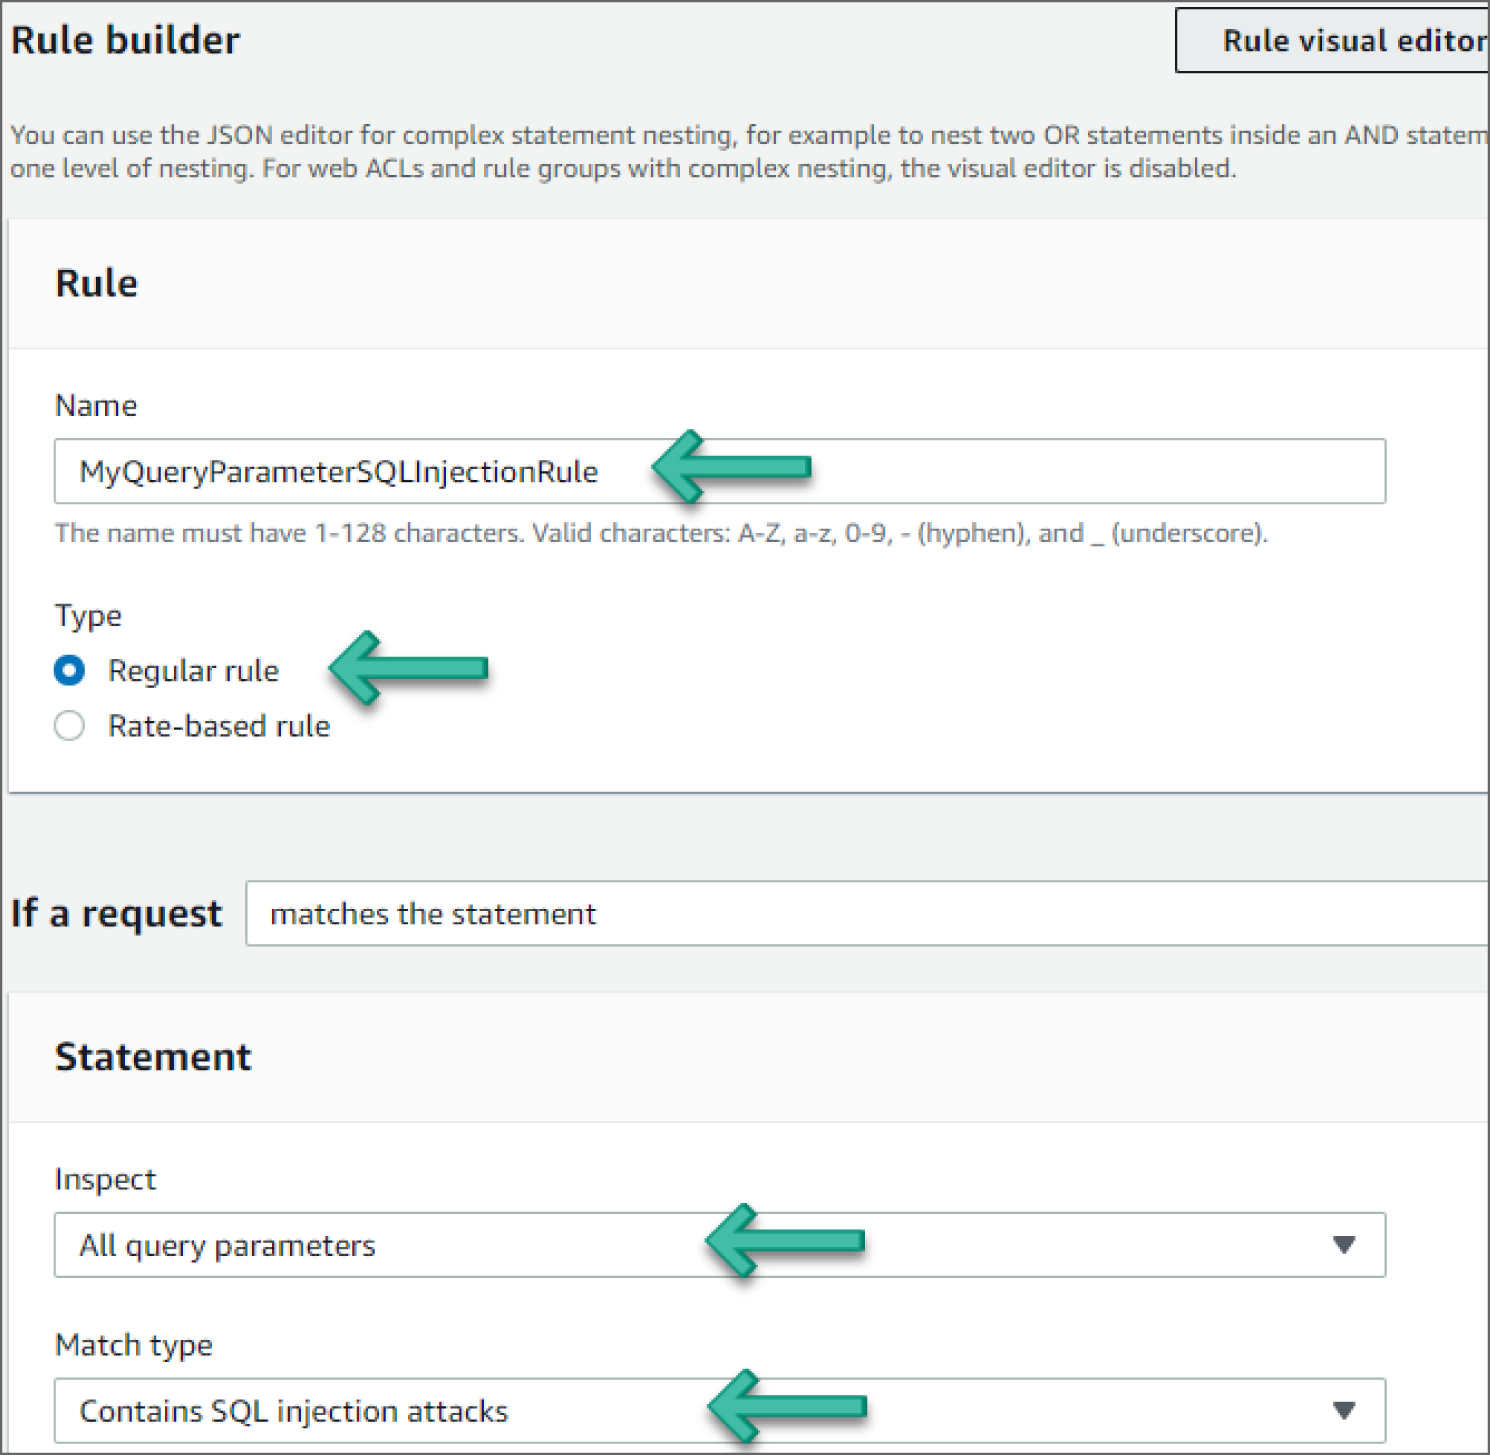
Figure 6.17: Rule Builder screen
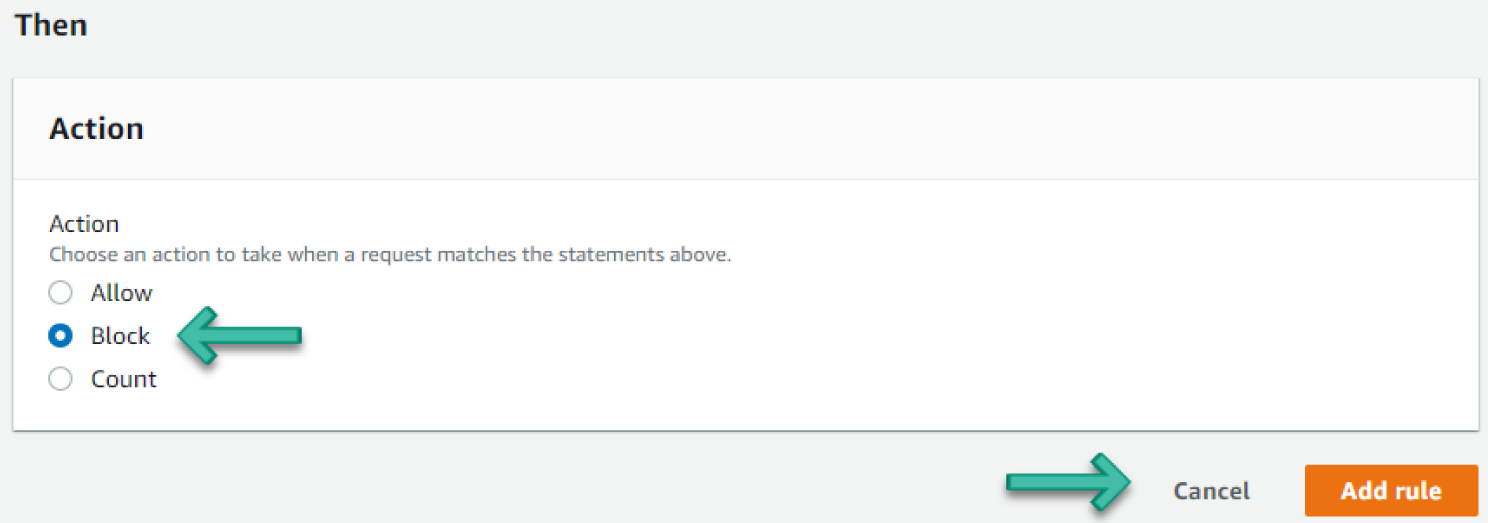
Figure 6.18: Action screen
- On the Review and Create Web ACL page, review the changes and click Create Web ACL. The ACL will be successfully created. See Figure 6.19.
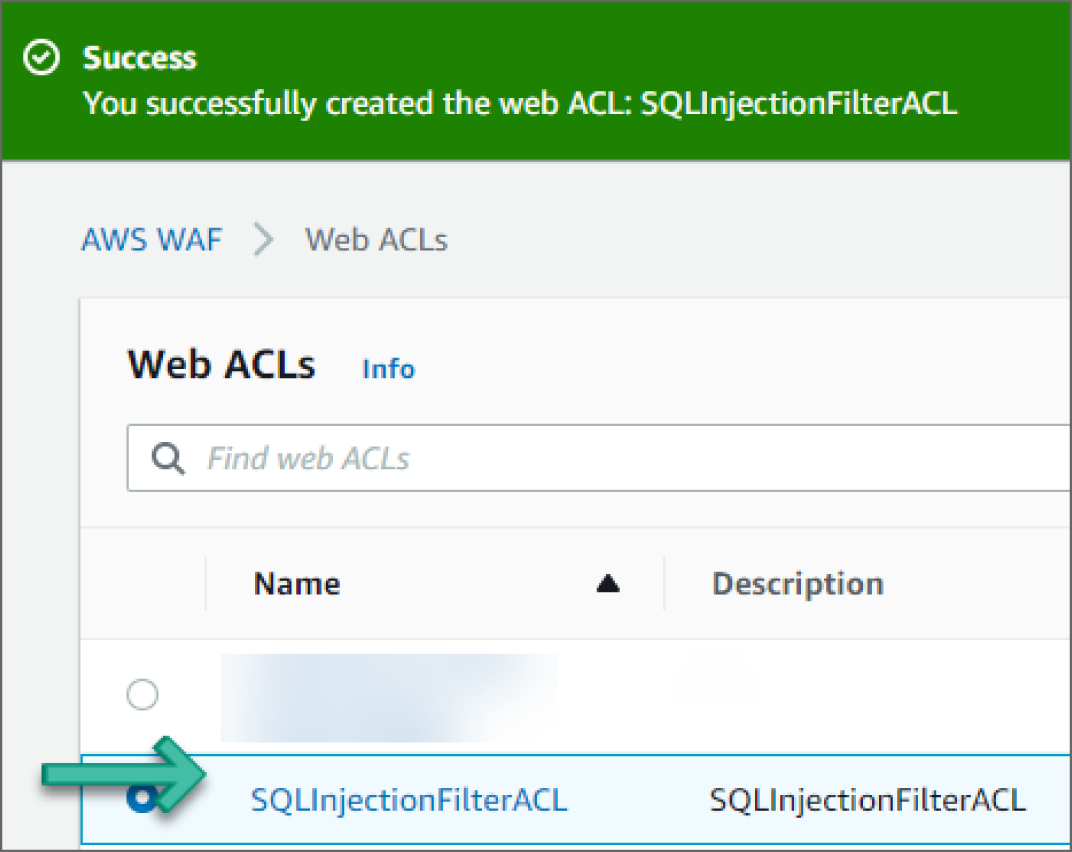
Figure 6.19: Confirmation of Web ACL Creation screen
AWS Detection Features
Organizations need to take appropriate action to detect cybersecurity threat alerts. The continuous monitoring solutions play a key role in detecting anomalous activity and other operational continuity threats. The organization should have network transparency to predict cyber incidents and access the required information to respond to one. Continuous surveillance and tracking security alerts are very effective ways of detecting and avoiding cyberattacks in the networks.
How Do You Detect Privilege Escalation?
Privilege escalation consists of techniques that adversaries use to gain higher-level permissions on a system or network. Adversaries can often enter and explore a network with unprivileged access but require elevated permissions to follow through on their objectives. Common approaches are to take advantage of system weaknesses, misconfigurations, and vulnerabilities. Examples of elevated access include: SYSTEM/root level, local administrator, user account with admin-like access, user accounts with access to a specific system or perform a specific function. These techniques often overlap with Persistence techniques, as OS features that let an adversary persist can execute in an elevated context.
Adversaries may obtain and abuse credentials of existing valid accounts as a means of gaining Initial Access, Persistence, Privilege Escalation, or Defense Evasion. Compromised credentials may be used to bypass access controls placed on various resources on systems within the network and may even be used for persistent access to remote systems and externally available services, such as VPNs, Outlook Web Access, and remote desktop. Compromised credentials may also grant an adversary increased privilege to specific systems or access to restricted areas of the network. Adversaries may choose not to use malware or tools in conjunction with the legitimate access those credentials provide to make it harder to detect their presence.
The abuse of valid accounts can be detected by configuring robust, consistent account activity audit policies across the enterprise and with externally accessible services. Look for suspicious account behavior across systems that share accounts, either user, admin, or service accounts. Examples: one account logged in to multiple systems simultaneously; multiple accounts logged in to the same machine simultaneously; accounts logged in at odd times or outside of business hours. Activity may be from interactive login sessions or process ownership from accounts being used to execute binaries on a remote system as a particular account. Correlate other security systems with login information (e.g., a user has an active login session but has not entered the building or does not have VPN access).
How Do You Detect the Abuse of Valid Account to Obtain High-Level Permissions?
Amazon GuardDuty uses threat intelligence feeds, such as lists of malicious IP addresses and domains, and machine learning to identify unexpected and potentially unauthorized and malicious activity within your AWS environment. This can include issues like escalations of privileges, uses of exposed credentials, or communication with malicious IP addresses or domains.
The following walkthrough describes how to set up and use Amazon GuardDuty to analyze Privilege Escalation anomaly detection.
Prerequisites
To use AWS GuardDuty services, you need an AWS account. If you don't have an account, visit https://aws.amazon.com and choose Create an AWS Account.
As a best practice, you should also create an AWS Identity and Access Management (IAM) user with administrator permissions and use that for all work that does not require root credentials.
Configure GuardDuty to Detect Privilege Escalation
Go to the GuardDuty service in the console. If you are logging in for the first time, you should see a Get Started page. Click Get Started. You should now see the Welcome to GuardDuty screen, as shown in Figure 6.20.
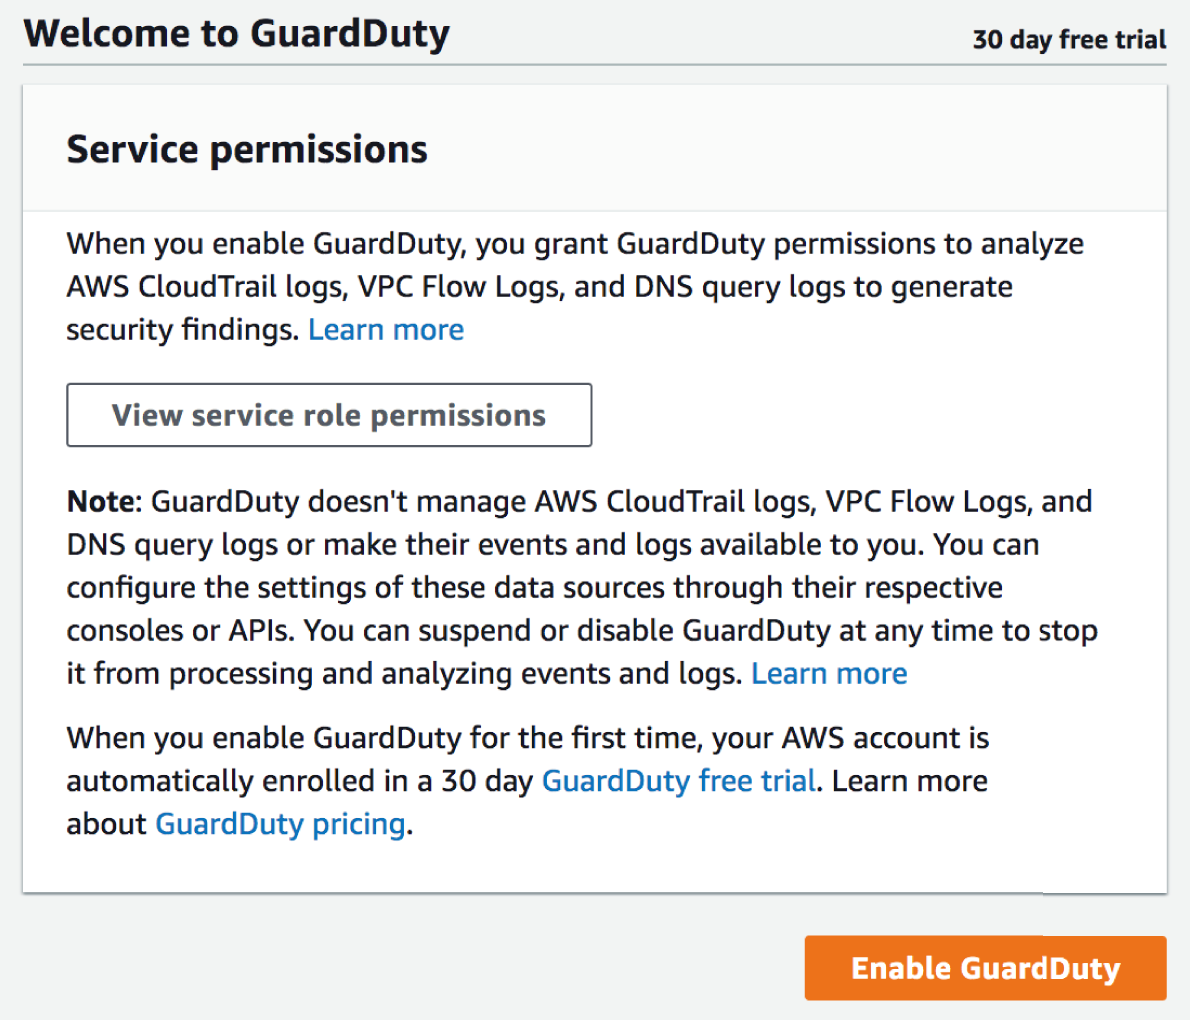
Figure 6.20: GuardDuty Welcome screen
- Click Enable GuardDuty. You can see GuardDuty in action using the sample events provided by AWS.
- Click Settings from the left sidebar in the GuardDuty dashboard.
- Click Generate Sample Findings under Sample Findings. See Figure 6.21.
- Click Findings on the left sidebar to go to the Findings page. New sample findings will now be generated.
- Click the
PrivilegeEscalation:IAMUser/AnomalousBehaviorevent to see additional information provided about the finding, as shown in Figure 6.22.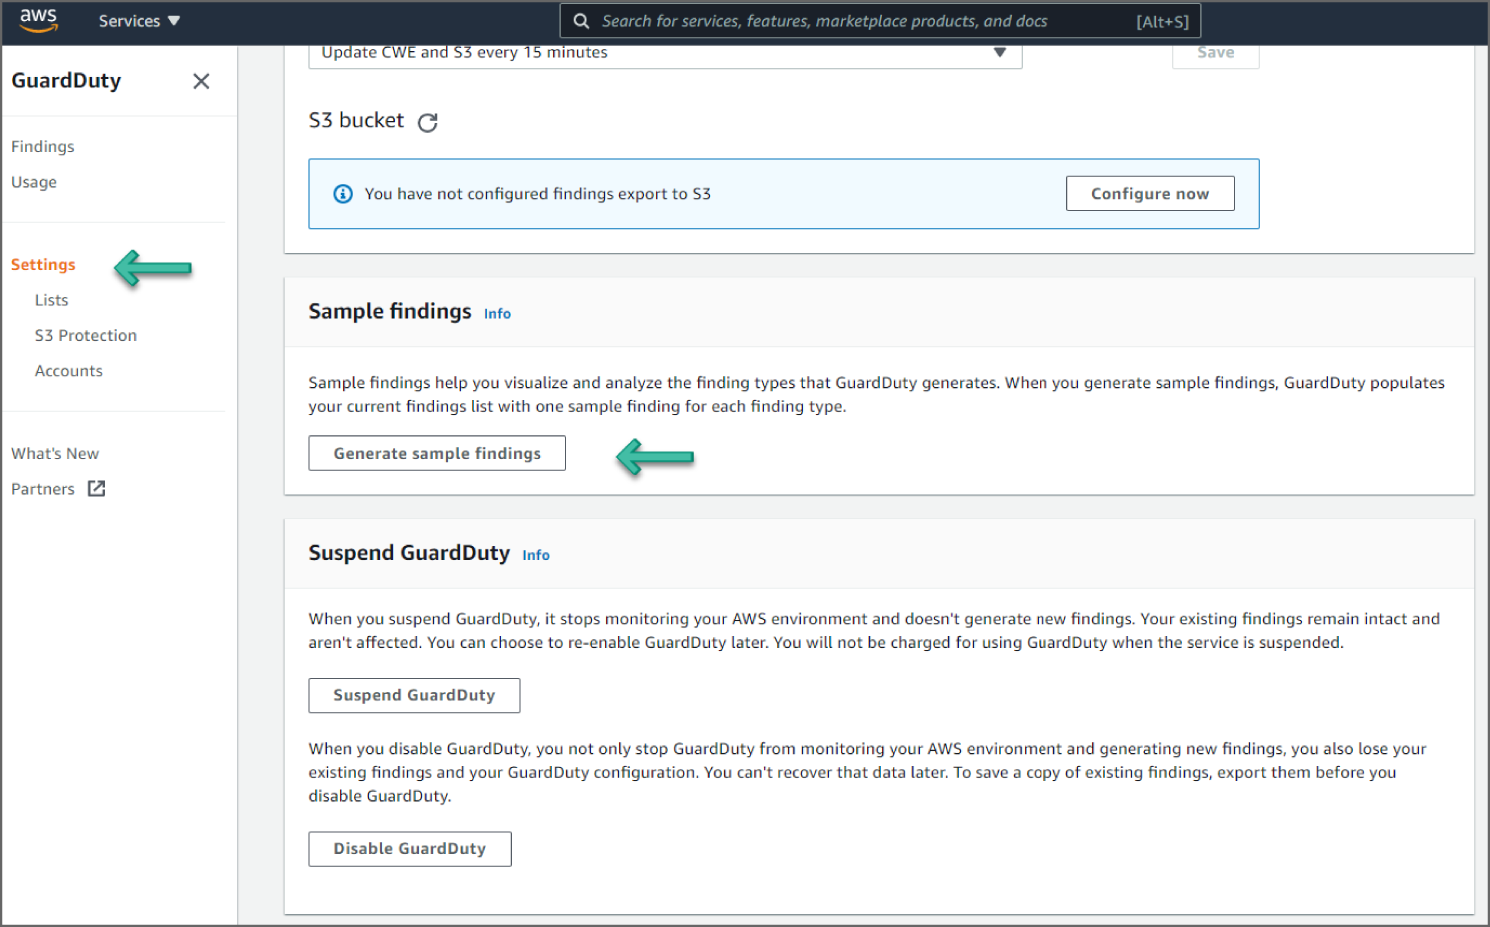
Figure 6.21: Generate Sample Findings screen
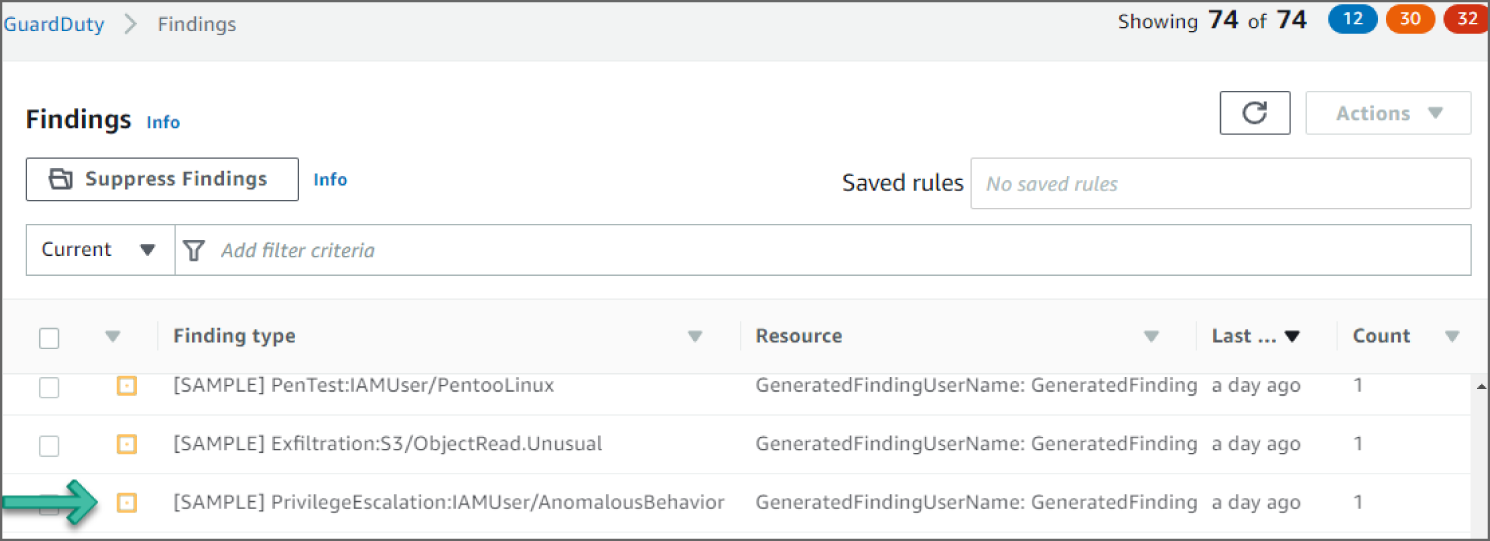
Figure 6.22: GuardDuty Findings screen
Reviewing the Findings
In the example shown in Figure 6.23, you see a PrivilegeEscalation:IAMUser/AnomalousBehavior finding. This finding informs you that an anomalous API request was observed in your account. This finding may include a single API or a series of related API requests made in proximity by a single user. The API observed is commonly associated with privilege escalation tactics where an adversary is attempting to gain higher-level permissions to an environment. APIs in this category typically involve operations that change IAM policies, roles, and users, such as, AssociateIamInstanceProfile, AddUserToGroup, or PutUserPolicy.
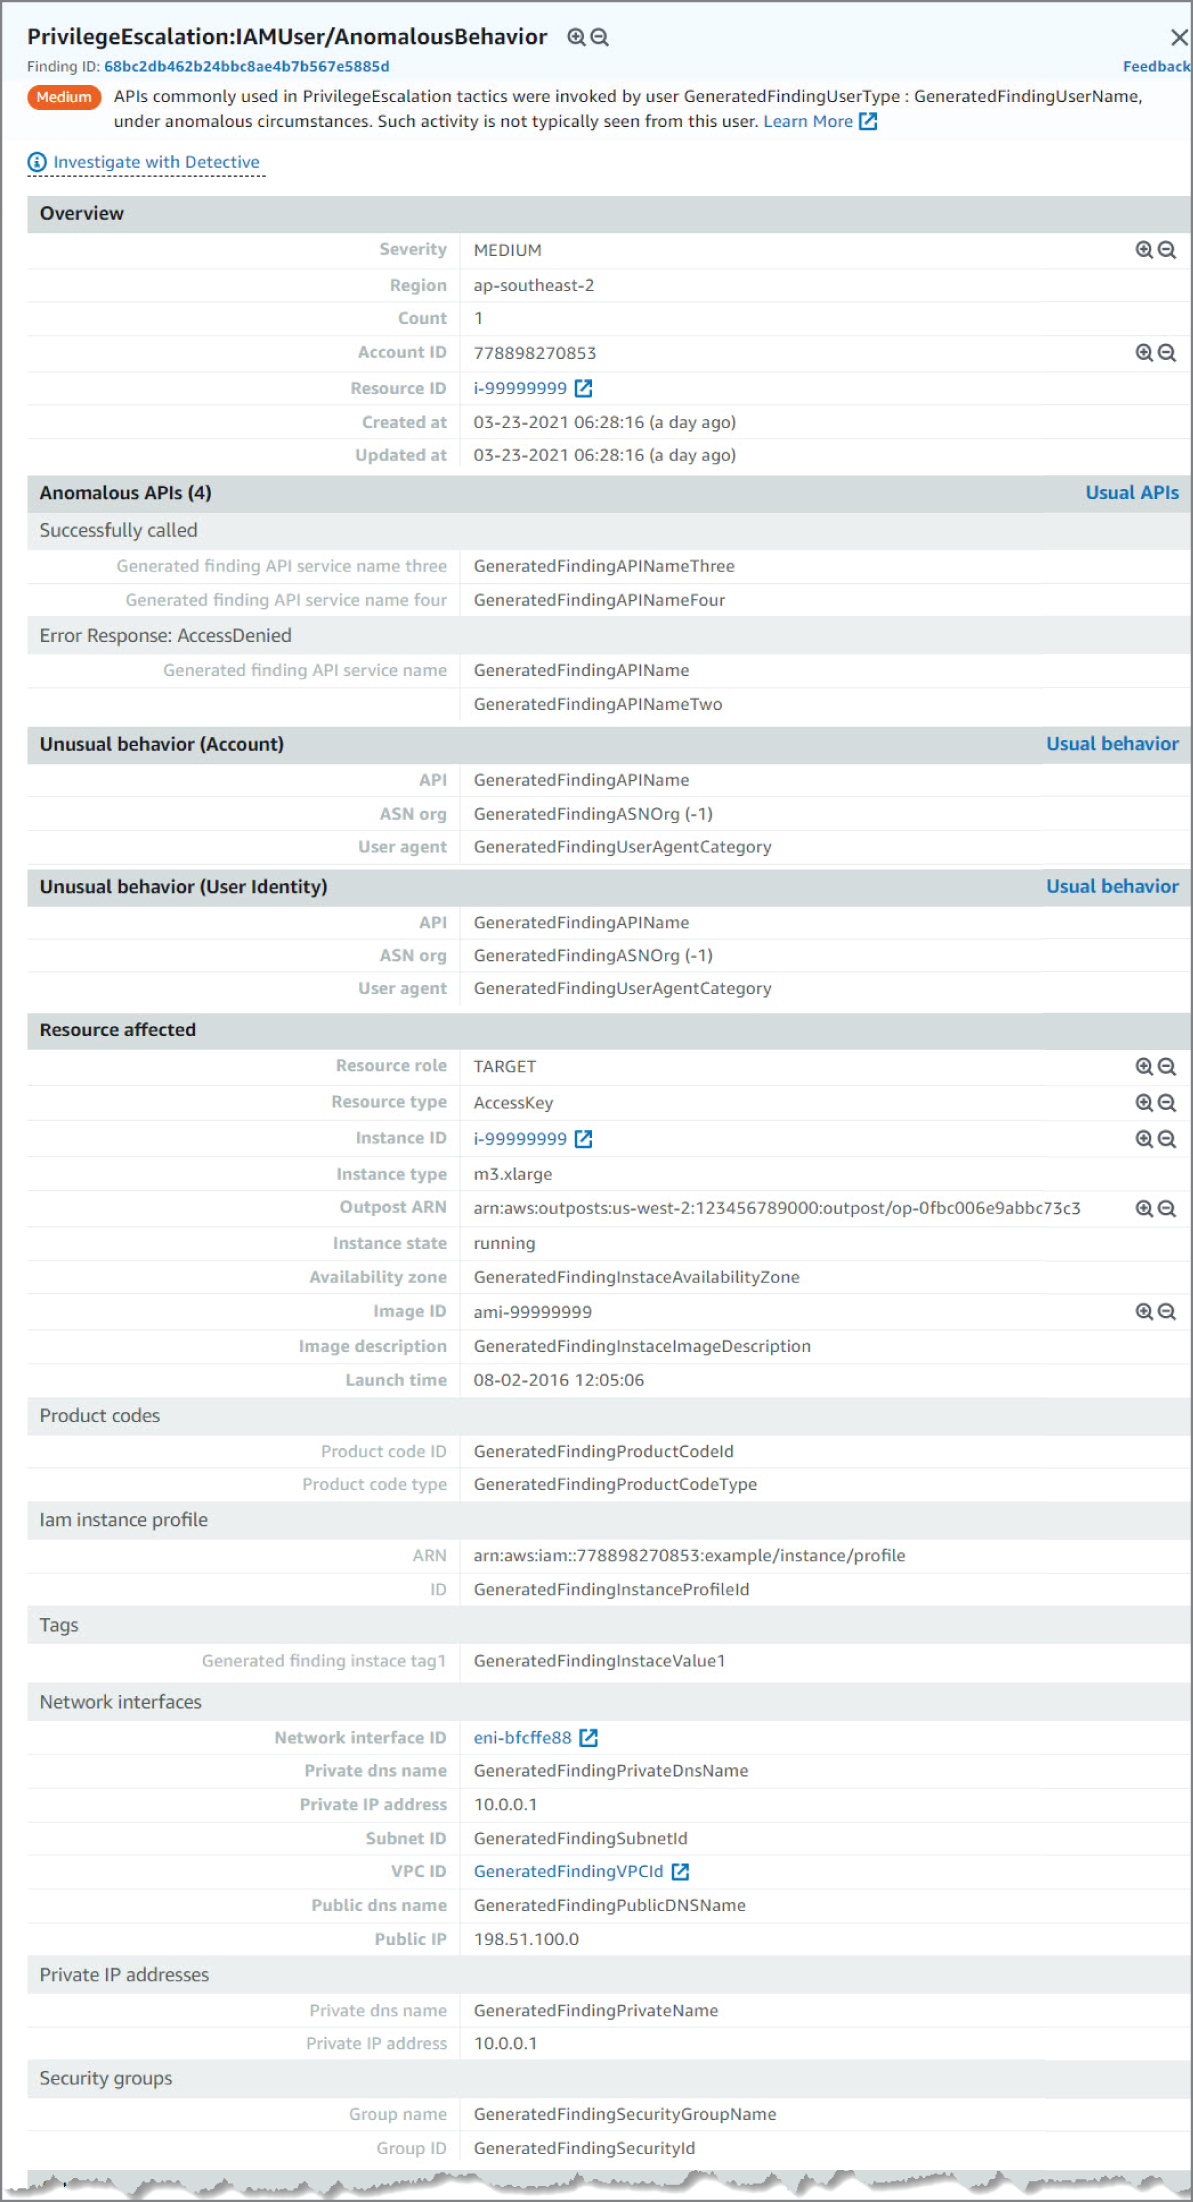
Figure 6.23: Privilege Escalation screen, upper portion
Looking at the information in this finding, you see the severity as MEDIUM, meaning it's something to check but not especially concerning. Now if you see many of these events back to back, there is room for concern, as it could mean a potential bad actor. You can see the region and account ID this event occurred in and the AWS Resource against which this activity took place. Moving down, you see the Anomalous APIs and the Unusual behavior details. The details point to the API name and the error response that triggered the findings. Moving down again, you can see the AWS resource that was targeted by the trigger activity. The information available varies based on resource type and action type. In this example, you can see the access key ID and resource details of the user engaged in the activity that prompted GuardDuty to generate the finding.
Moving down again, you see the action type, API, service name, and timestamps of when the event was first and last seen. Again, this is especially important if you see this type of event many times back to back. And at the bottom, there is information about the location of where the event occurred. You can see the caller type, IP address, location, and even the ISP information the activity occurred on. These are important when looking into geo-locations of events to determine patterns. See Figure 6.24.
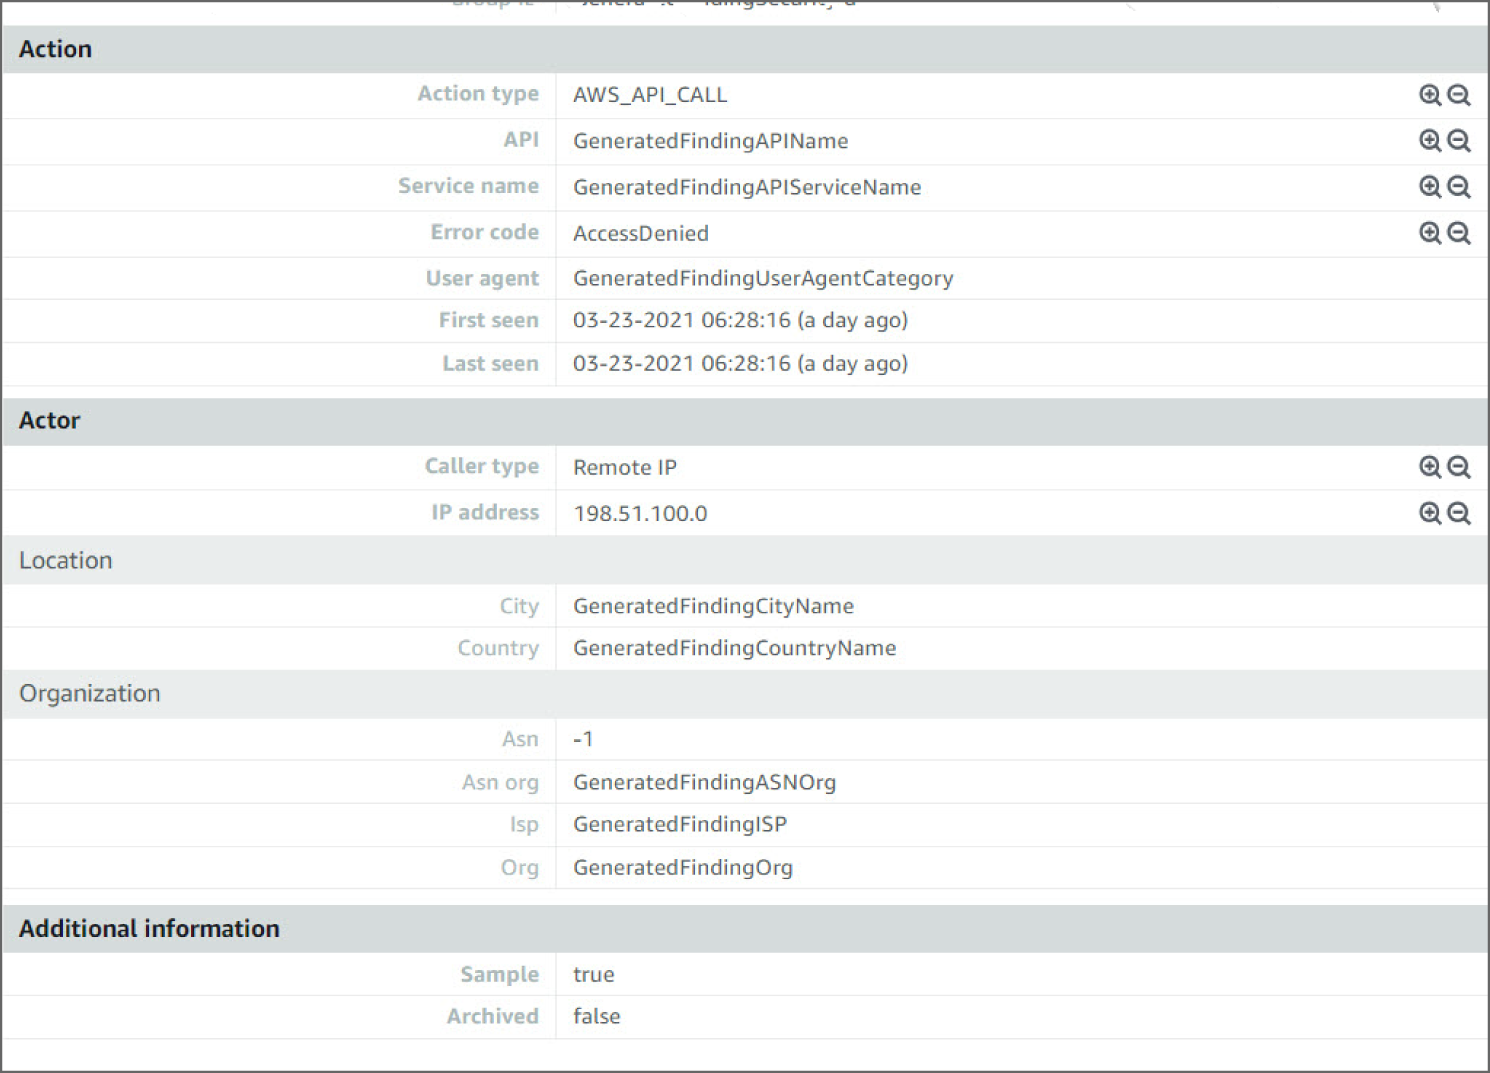
Figure 6.24: Privilege Escalation screen, lower portion
How Do You Detect Credential Access?
Credential Access consists of techniques for stealing credentials like account names and passwords. Techniques used to get credentials include keylogging or credential dumping. Using legitimate credentials can give adversaries access to systems, make them harder to detect, and provide the opportunity to create more accounts to help achieve their goals.
Adversaries may search compromised systems to find and obtain insecurely stored credentials. These credentials can be stored and/or misplaced in many locations on a system, including plaintext files (e.g., bash history), operating system or application-specific repositories (e.g., credentials in Registry), or other specialized files/artifacts (e.g., private keys).
While detecting adversaries accessing credentials may be difficult without knowing they exist in the environment, it may be possible to detect adversary use of credentials they have obtained. Monitor the command-line arguments of executing processes for suspicious words or regular expressions that may indicate searching for a password (for example: password, pwd, login, secure, or credentials).
Monitor for suspicious file access activity, specifically indications that a process is reading multiple files in a short amount of time and/or using command-line arguments indicative of searching for credential material (such as regex patterns). These may be indicators of automated/scripted credential access behavior.
Monitoring when the user's .bash_history is read can help alert to suspicious activity. While users do typically rely on their history of commands, they often access this history through other utilities like “history” instead of commands like cat ~/.bash_history
.
Additionally, monitor processes for applications that can be used to query the Registry, such as Reg, and collect command parameters that may indicate credentials are being searched. Correlate activity with related suspicious behavior that may indicate an active intrusion to reduce false positives.
How Do You Detect Unsecured Credentials?
Amazon Macie is a fully managed data security and data privacy service that uses machine learning and pattern matching to help you discover, monitor, and protect your sensitive data in AWS.
Macie automates the discovery of sensitive data, such as credentials, personally identifiable information (PII), and financial data, to provide you with a better understanding of the data that your organization stores in Amazon Simple Storage Service (Amazon S3). Macie also provides you with an inventory of your S3 buckets, and it automatically evaluates and monitors those buckets for security and access control. Within minutes, Macie can identify and report overly permissive or unencrypted buckets for your organization.
The following walkthrough describes how to set up and use Amazon Macie to detect unsecured credentials.
Prerequisites
To use Amazon Macie and other AWS services, you need an AWS account. If you don't have an account, visit http://aws.amazon.com and choose Create an AWS Account.
As a best practice, you should also create an AWS Identity and Access Management (IAM) user with administrator permissions and use that for all work that does not require root credentials.
You need an S3 bucket. The bucket should be in the same region in which you configure Macie. We created a bucket named threat-hunting-book-tutorial in the sydney region. See Figure 6.25.
You need to upload an AWS Access key file into the S3 bucket. Follow these steps to download the AWS access key file:
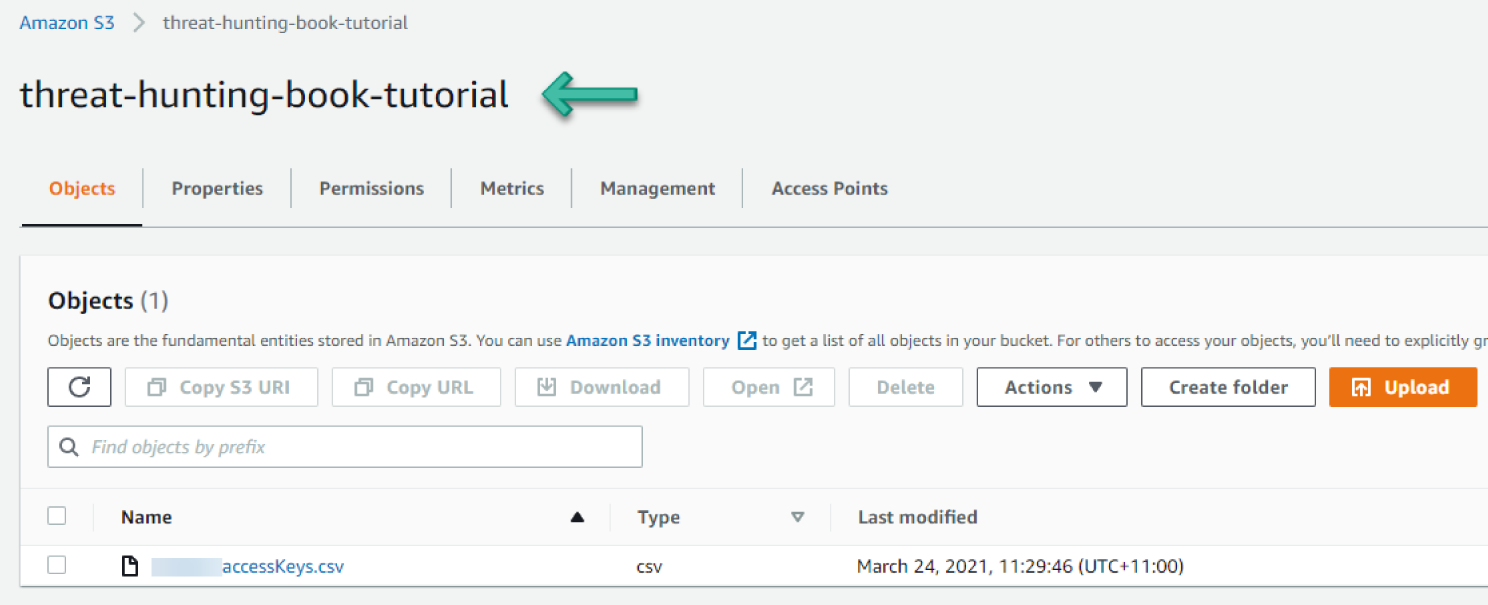
Figure 6.25: S3 bucket
- Open the IAM console at
https://console.aws.amazon.com/iam/. - On the navigation menu, choose Users.
- Choose your IAM username (not the check box).
- Open the Security credentials tab, and then choose Create Access Key.
- To download the key pair, choose Download .csv File. Store the .csv file with keys in a secure location.
- Configure Macie to discover and classify risks in an S3 bucket.
- Go to the Macie service in the console.
- By using the AWS Region selector in the upper-right corner of the page, select the region in which you want to enable Macie.
- If you are logging in for the first time, you should see a Get Started page, as shown in Figure 6.26. Click Get Started.
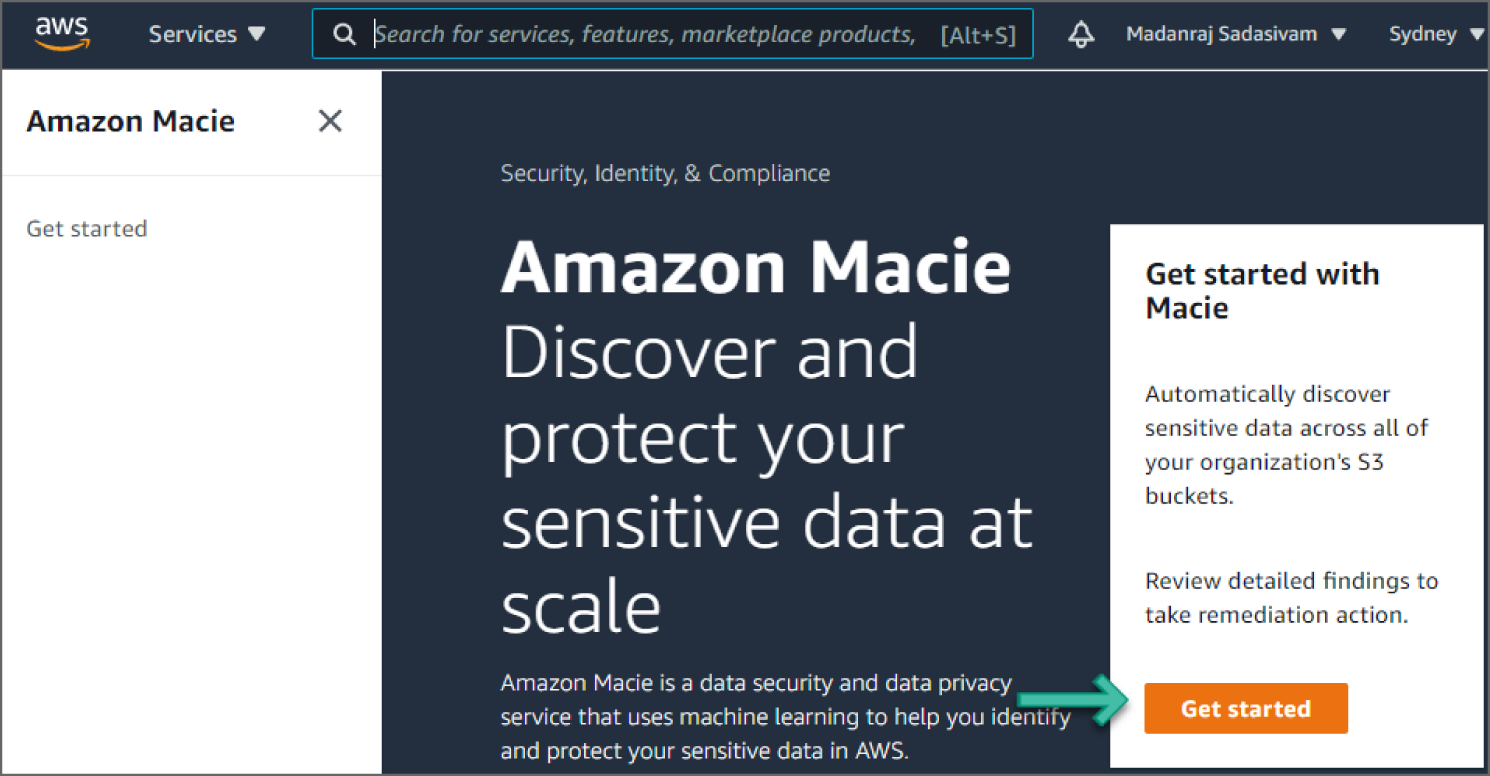
Figure 6.26: Macie screen
You should now see the Welcome to Macie screen with an option to enable it, as shown in Figure 6.27.
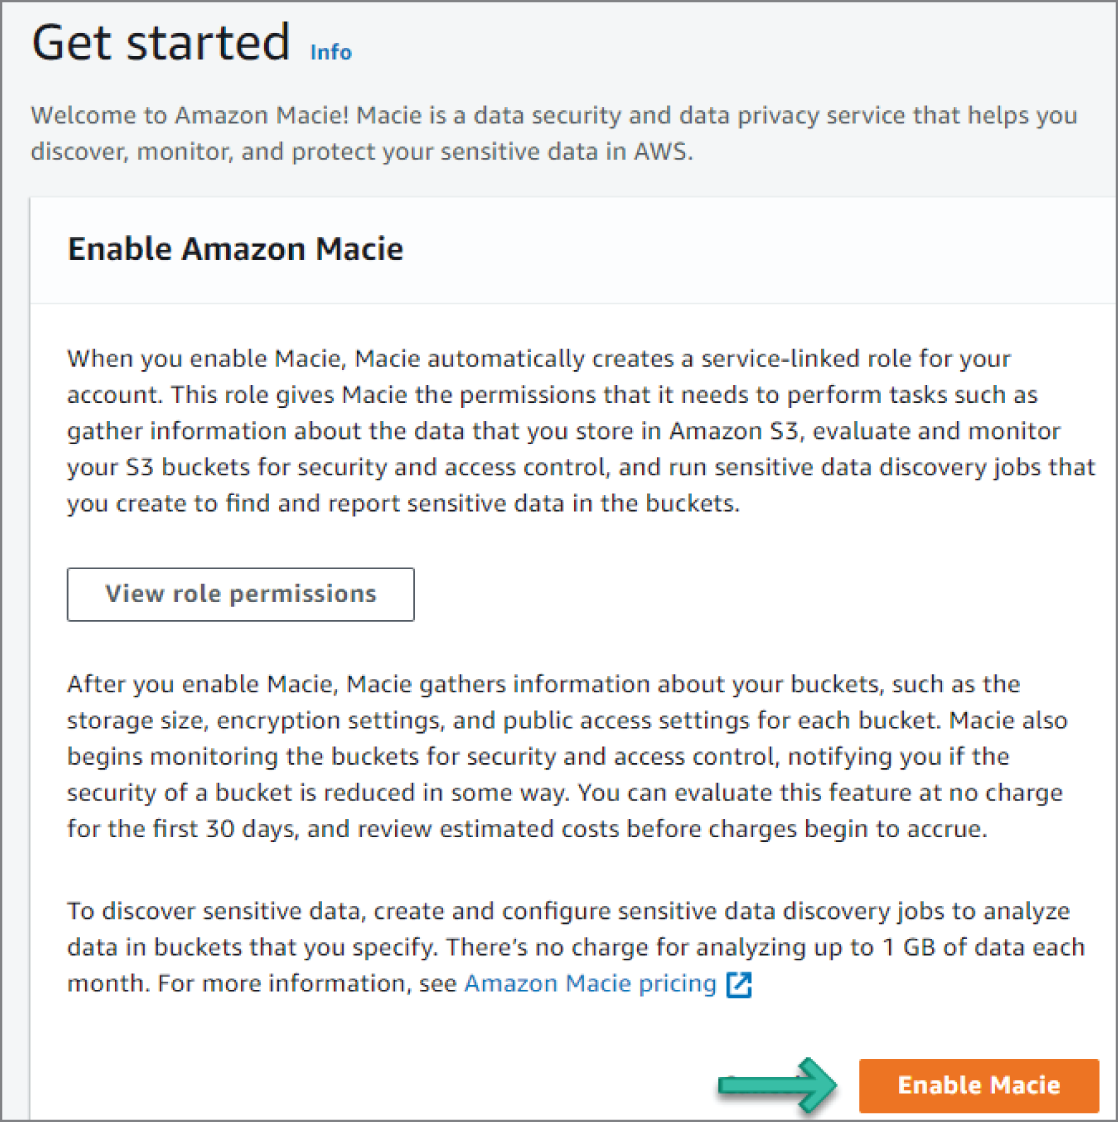
Figure 6.27: Enable Macie screen
Next, click Enable Macie. Within minutes, Macie generates an inventory of the Amazon Simple Storage Service (Amazon S3) buckets for your account in the current AWS region. Macie also begins monitoring the buckets for potential policy violations.
Macie stores your sensitive data discovery results for 90 days. To access the results and enable long-term storage and retention of them, configure Macie to store the results in an S3 bucket. Although this is optional, you must do this within 30 days of enabling Macie. After you do this, the S3 bucket can serve as a definitive, long-term repository for all of your discovery results. Specify the S3 bucket to use by navigating to the Settings | Discovery results on the sidebar menu, as shown in Figure 6.28.
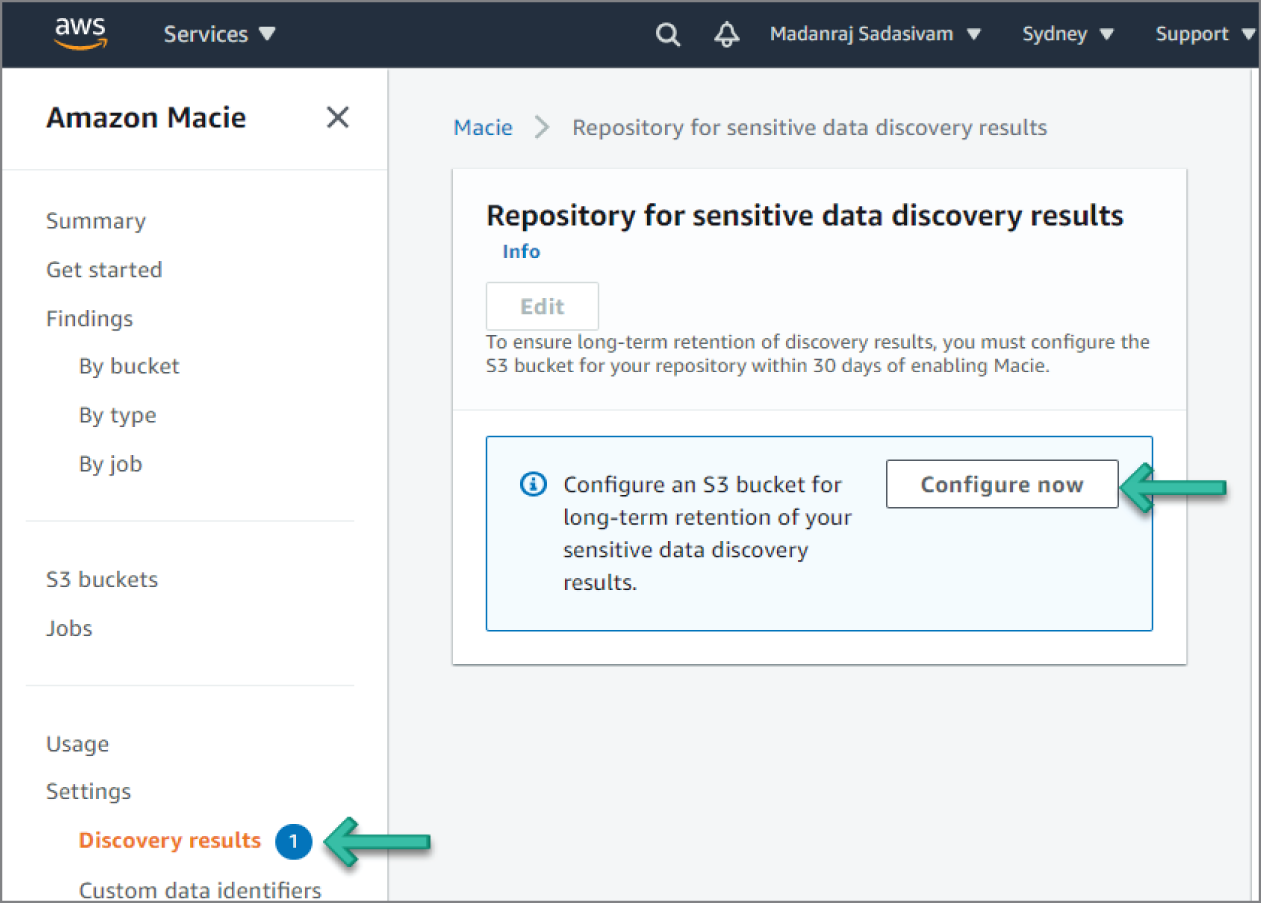
Figure 6.28: Configure S3 Bucket screen
In Macie, sensitive data discovery jobs analyze objects in S3 buckets to discover and report sensitive data. Click Jobs on the left sidebar. This will show you the list of discovery jobs currently created in Macie, as shown in Figure 6.29.
Click Create Job. This will show you an inventory of all S3 buckets for your account. The S3 bucket called threat-hunting-book-tutorial that we created in the Prerequisites steps is shown in Figure 6.30.
For the Select S3 buckets step, select the check box of the threat-hunting-book-tutorial bucket to analyze. Then click Next.
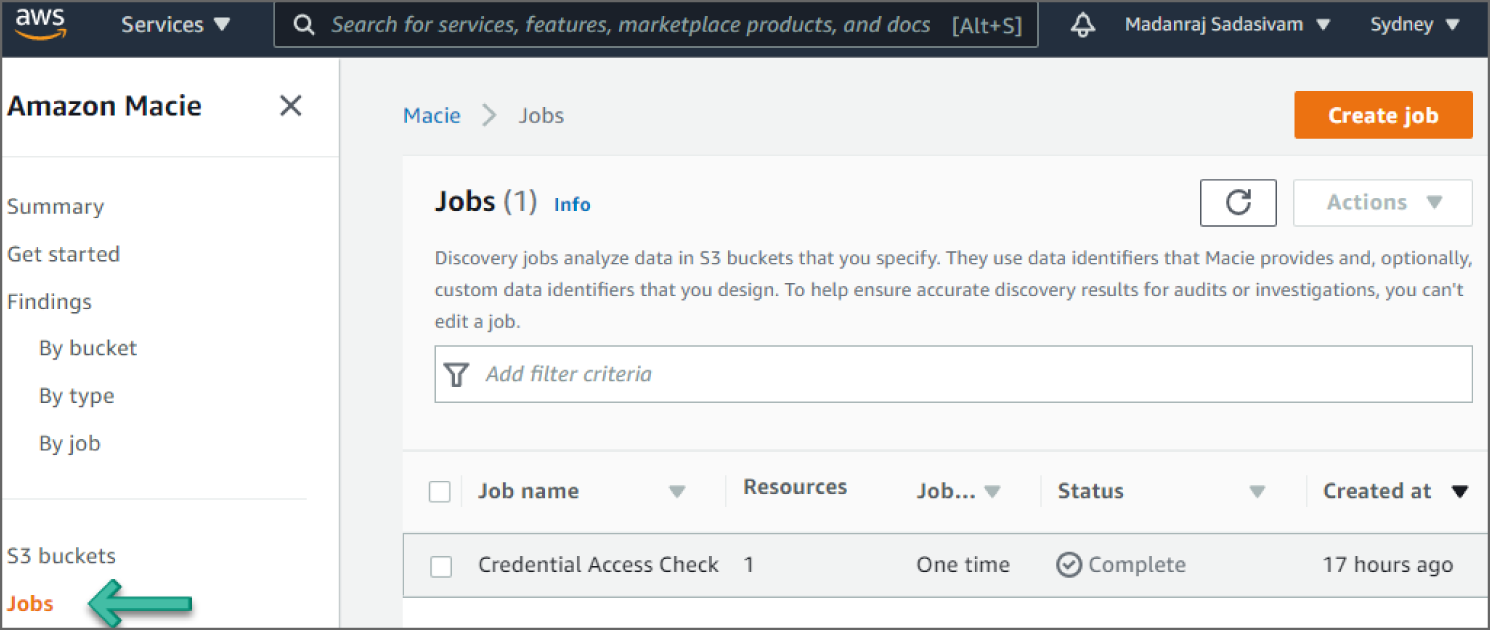
Figure 6.29: Macie Jobs screen
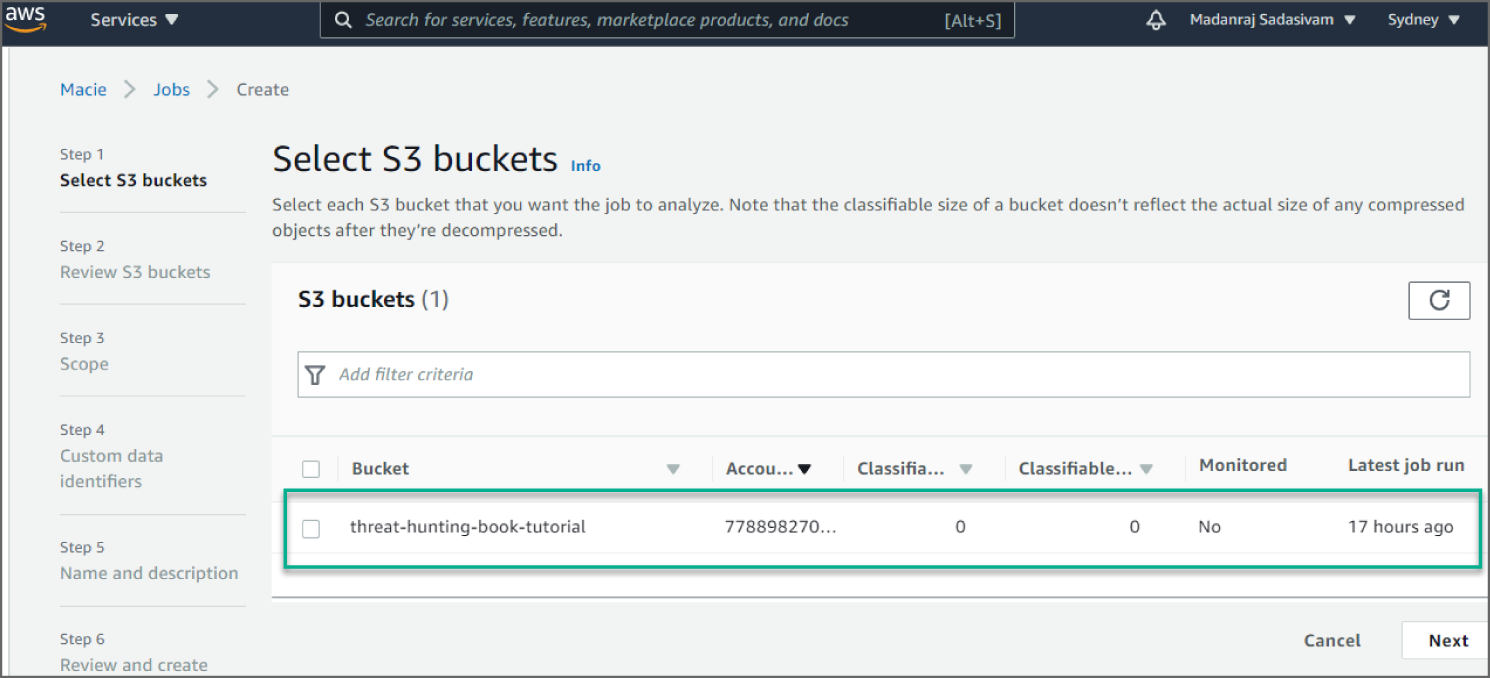
Figure 6.30: Select S3 Buckets screen
For the Review S3 buckets step, review and verify your bucket selections. You can also review the total estimated cost (in US dollars) of analyzing the data in each bucket and change your bucket selections as necessary. When you finish, click Next.
For the Scope step, select one-time job for Sensitive Data Discovery options. Then click Next, as shown in Figure 6.31.
For the Custom Data Identifiers step, click Next. For the Name and Description step, enter Unsecured Credentials Check for the name and, optionally, a description of the job. Then click Next. See Figure 6.32.
For the Review and create step, review the configuration settings for the job and verify that they're correct. You can also review the total estimated cost (in US dollars) of running the job once based on your bucket selections.
When you finish reviewing and verifying the settings, click Submit.
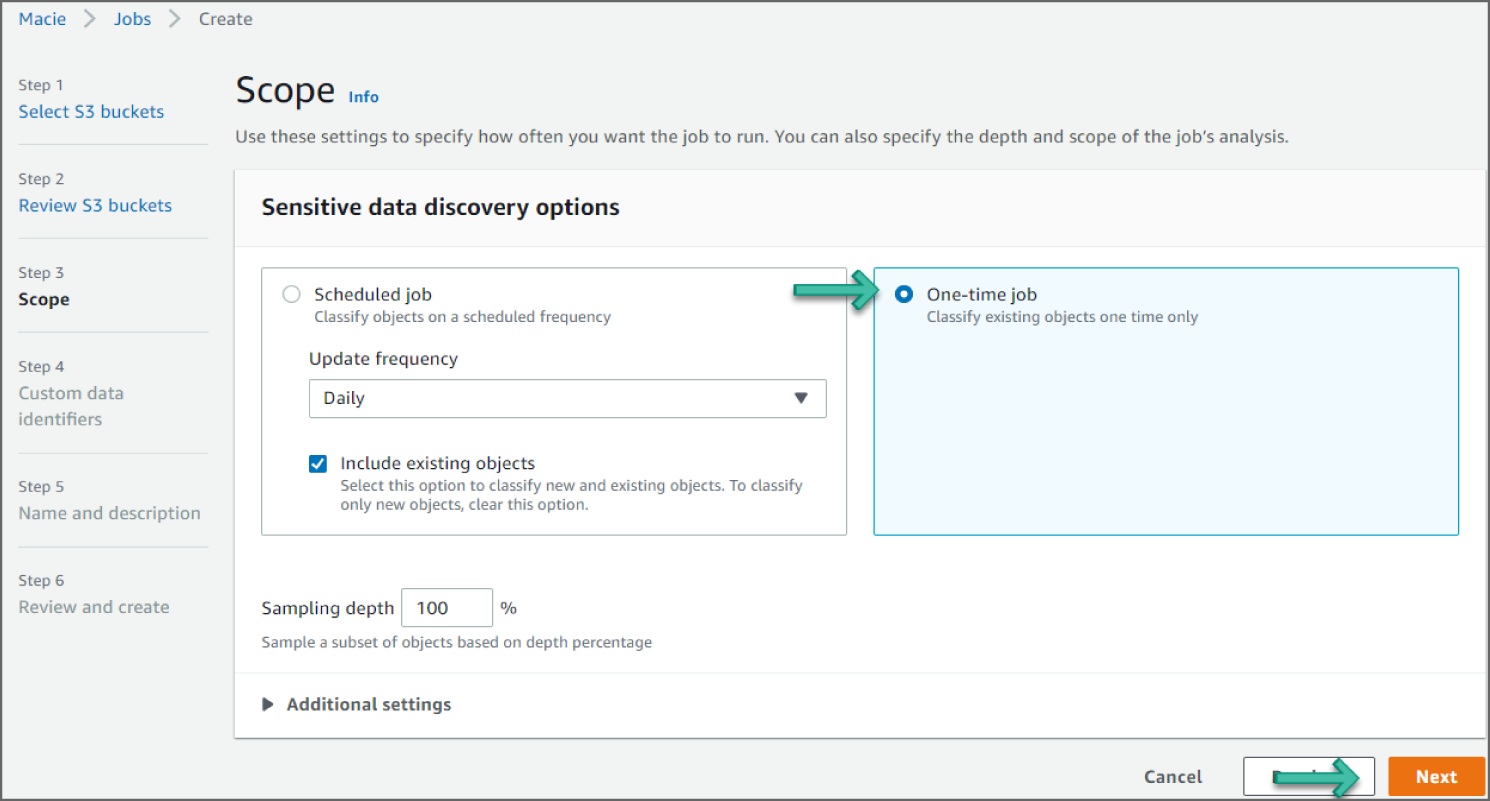
Figure 6.31: Scope screen
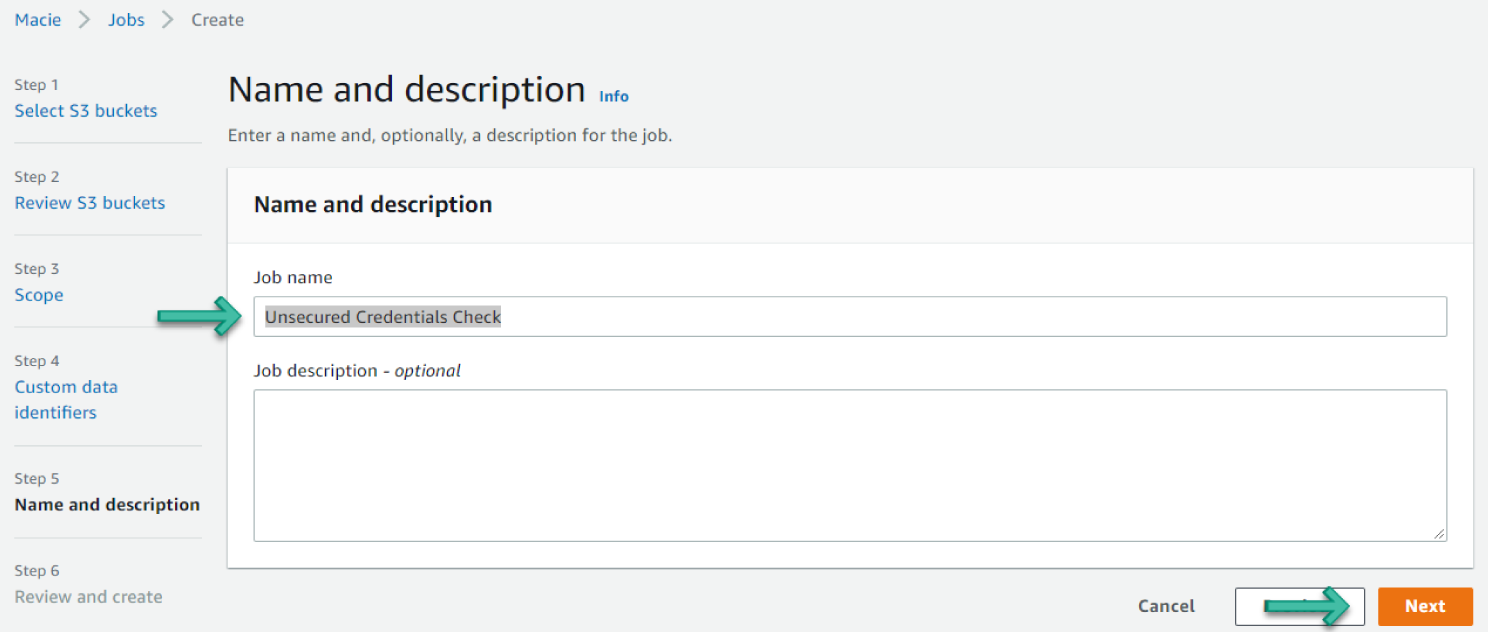
Figure 6.32: Name and Description screen
Reviewing the Findings
Macie monitors your S3 buckets and reports any potential policy violations as policy findings. If you create and run a sensitive data discovery job, Macie reports any sensitive data that it discovers as sensitive data findings. Use the following procedure to view detailed information for your findings:
- Open the Macie console at
https://console.aws.amazon.com/macie. - In the navigation pane, choose Findings. Optionally, to filter the findings by specific criteria, use the filter bar above the table to enter the criteria. See Figure 6.33.
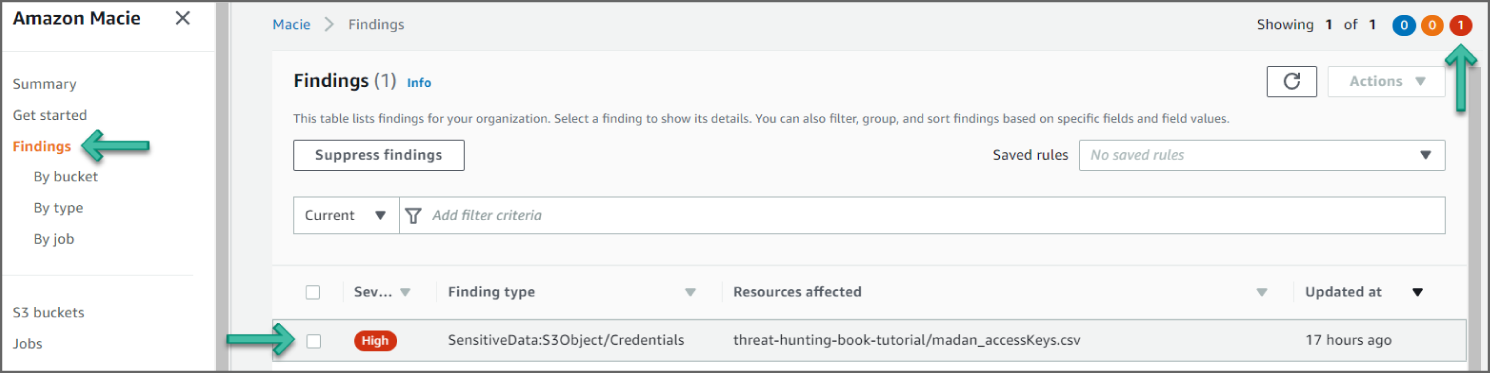
Figure 6.33: Findings screen
- To view the details of a specific finding, choose any field other than the check box for the finding. The details panel displays information for the finding.
- In the example shown in Figure 6.33, you see a
SensitiveData:S3Object/Credentialsfinding. This finding informs you that the object contains credentials such as access keys, account IDs, or private keys. In this example, the credential is the AWS secret key stored in the S3 bucket. - Findings for Macie are similar to GuardDuty. Looking at the information in this finding, you see the severity as HIGH, meaning it's concerning and needs immediately. You have information as to when the event occurred, and the region of the finding. See Figure 6.34.
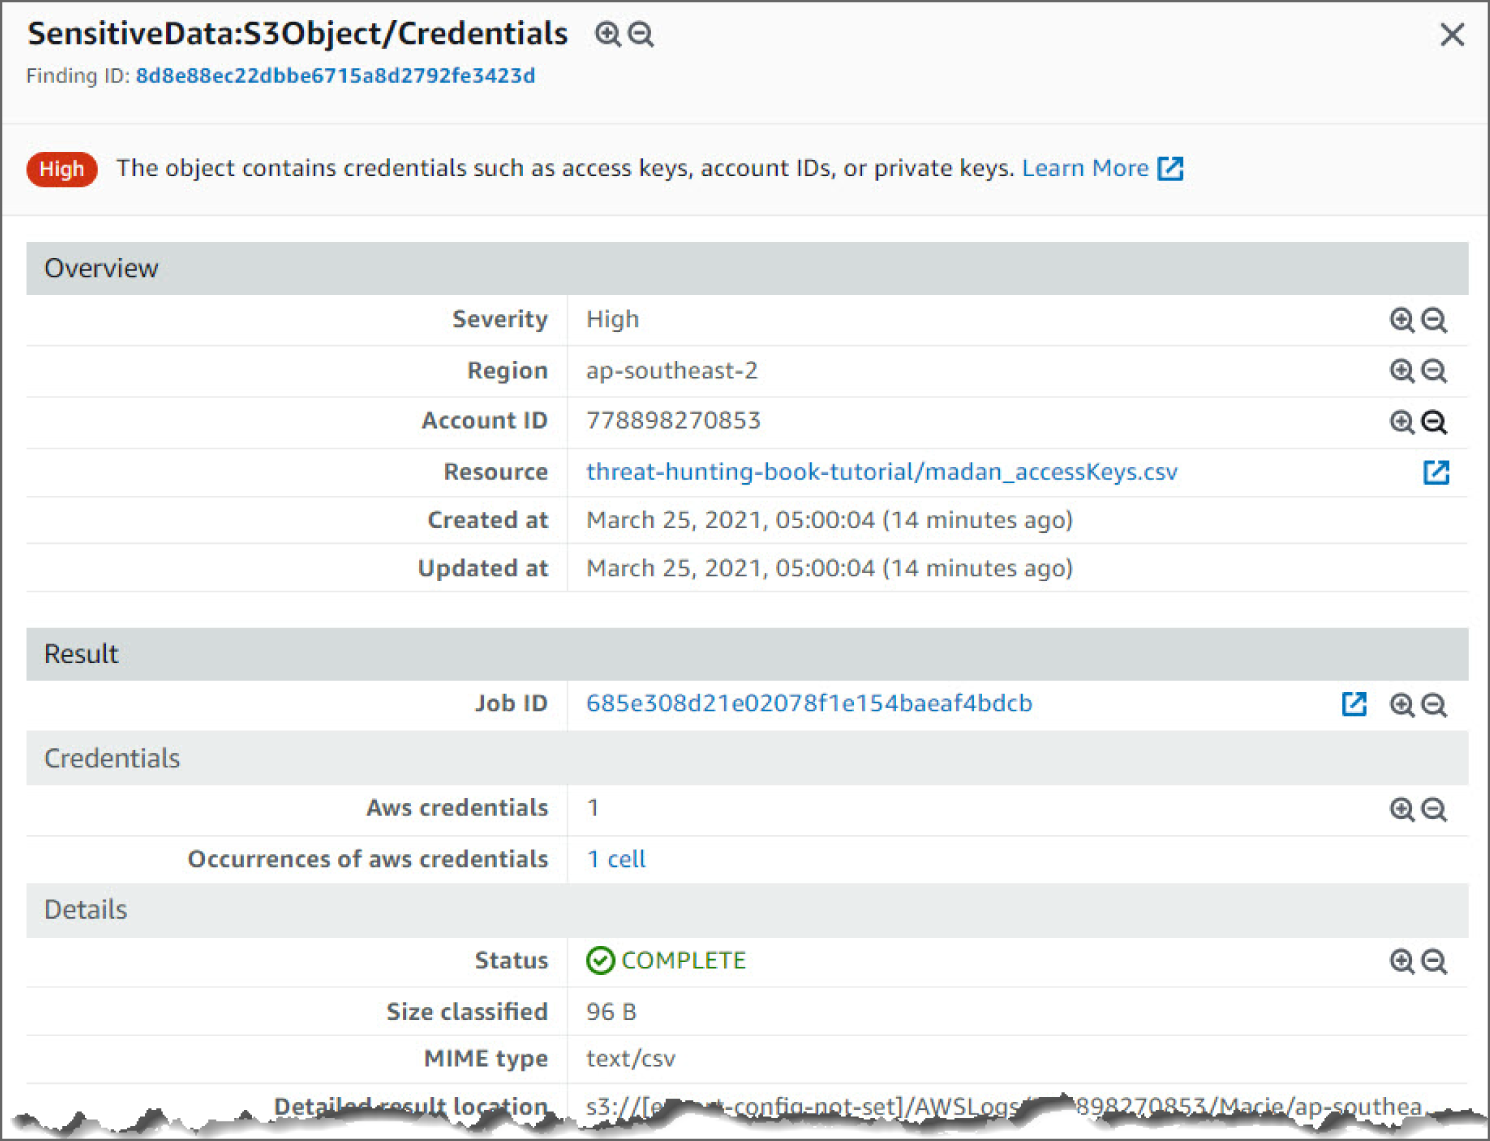
Figure 6.34: SensitiveData:S3Object/Credentials Screen 1
- Moving down again, you see the resource name that triggered the finding. This also points you to the AWS credential that is unsecure. The resource information includes Public Access, Encryption Type, Size, and Last Modified. See Figure 6.35.
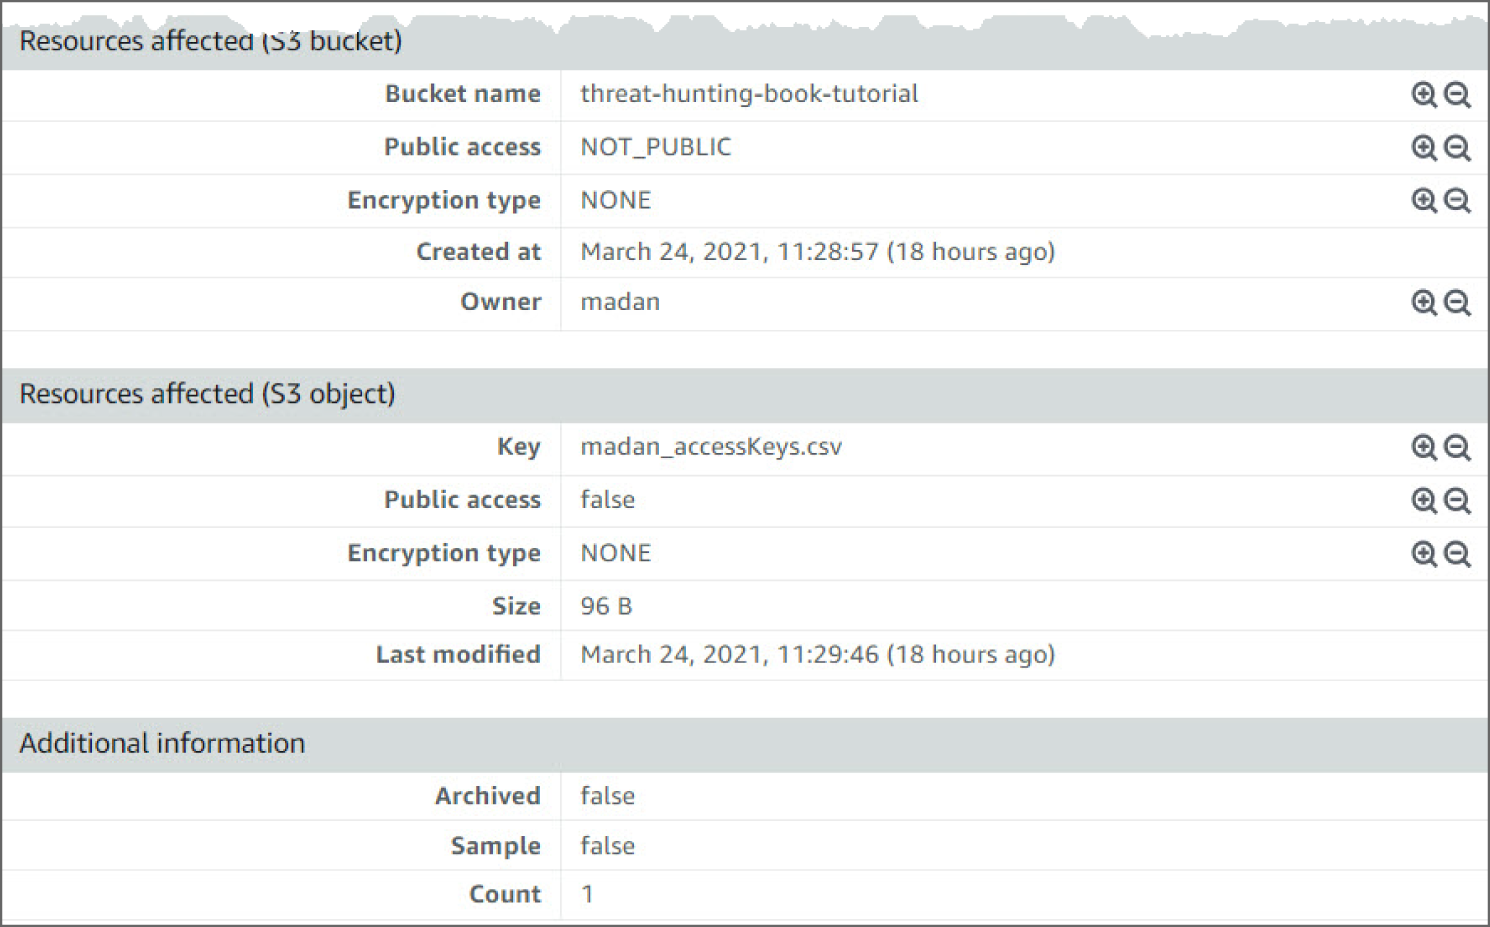
Figure 6.35: SensitiveData:S3Object/Credentials Screen 2
How Do You Detect Lateral Movement?
Lateral movement consists of techniques that adversaries use to enter and control remote systems on a network. Following through on their primary objective often requires exploring the network to find their target and subsequently gaining access to it. Reaching their objective often involves pivoting through multiple systems and accounts to own. Adversaries might install their own remote access tools to accomplish lateral movement or use legitimate credentials with native network and operating system tools, which may be stealthier.
Adversaries may use alternate authentication material, such as password hashes, Kerberos tickets, and application access tokens, in order to move laterally within an environment and bypass normal system access controls.
Authentication processes generally require a valid identity (e.g., username) along with one or more authentication factors (e.g., password, PIN, physical smart card, token generator, etc.). Alternate authentication material is legitimately generated by systems after a user or application successfully authenticates by providing a valid identity and the required authentication factors. Alternate authentication material may also be generated during the identity creation process.
Caching alternate authentication material allows the system to verify an identity has successfully authenticated without asking the user to reenter authentication factors. Because the alternate authentication must be maintained by the system—either in memory or on disk—it may be at risk of being stolen through Credential Access techniques. By stealing alternate authentication material, adversaries are able to bypass system access controls and authenticate to systems without knowing the plaintext password or any additional authentication factors.
The abuse of stolen alternate authentication material can be detected by configuring robust, consistent account activity audit policies across the enterprise and with externally accessible services. Look for suspicious account behavior across systems that share accounts, either user, admin, or service accounts. Examples: one account logged in to multiple systems simultaneously; multiple accounts logged in to the same machine simultaneously; accounts logged in at odd times or outside of business hours. Activity may be from interactive login sessions or process ownership from accounts being used to execute binaries on a remote system as a particular account. Correlate other security systems with login information (e.g., a user has an active login session but has not entered the building or does not have VPN access).
How Do You Detect the Use of Stolen Alternate Authentication Material?
The following walkthrough describes how to set up and use Amazon GuardDuty to analyze unauthorized access with stolen alternate authentication material.
Prerequisites
To use Amazon GuardDuty and other AWS services, you need an AWS account. If you don't have an account, visit https://aws.amazon.com and choose Create an AWS Account. As a best practice, you should also create an AWS Identity and Access Management (IAM) user with administrator permissions and use that for all work that does not require root credentials.
Configure and enable GuardDuty and generate sample findings and explore the basic operations. Refer to the section entitled “How Do You Detect Privilege Escalation?” earlier in this chapter for further details.
How Do You Detect Potential Unauthorized Access to Your AWS Resources?
Click Findings from the left sidebar to go to the Findings page. See Figure 6.36.

Figure 6.36: GuardDuty Findings menu
Click the UnauthorizedAccess:IAMUser/ConsoleLoginSuccess.B event to see additional information provided about the finding. See Figure 6.37.
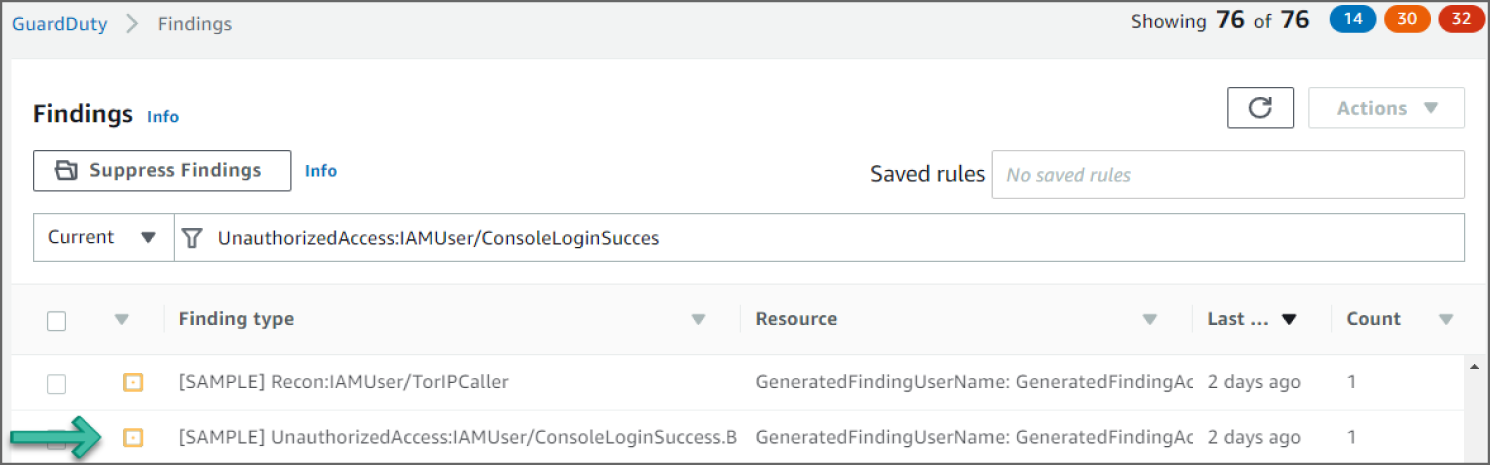
Figure 6.37: GuardDuty Findings screen
Reviewing the Findings
In the examples shown in Figures 6.38–6.40, you see an UnauthorizedAccess:IAMUser/ConsoleLoginSuccess.B finding. This finding informs you that successful logins to the AWS console were seen from multiple countries recently, using the credentials of principal GeneratedFindingUserName. This could be an indication of the unauthorized use of this user's password.
Looking at the information in this finding, you see the severity as MEDIUM, meaning it's something to check but not especially concerning. Now if you see many of these events back to back, there is room for concern, as it could mean a potential bad actor. You can see the region and account ID this event occurred in and the AWS Resource against which this activity took place. Moving down, you see the Action details. The details point to the Service name and the error code that triggered the findings. Moving down again, you can see Actor details including the Caller type, IP Address, and the geo-location.
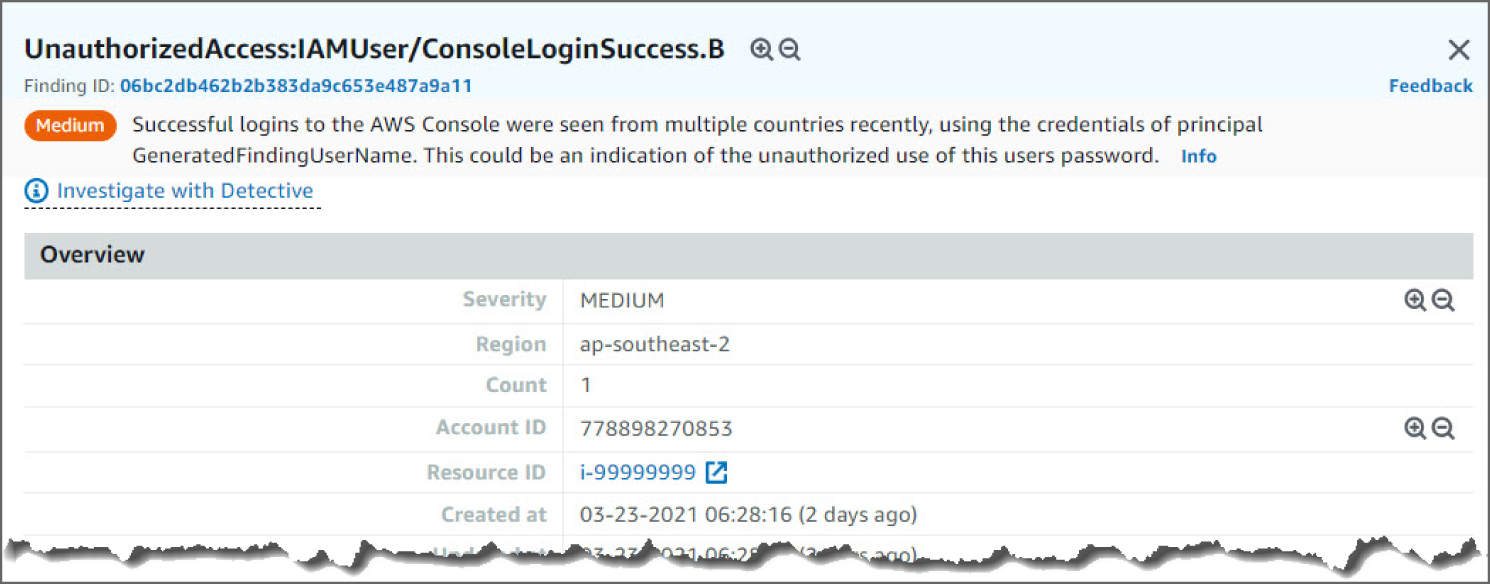
Figure 6.38: UnauthorizedAccess:IAMUser overview screen
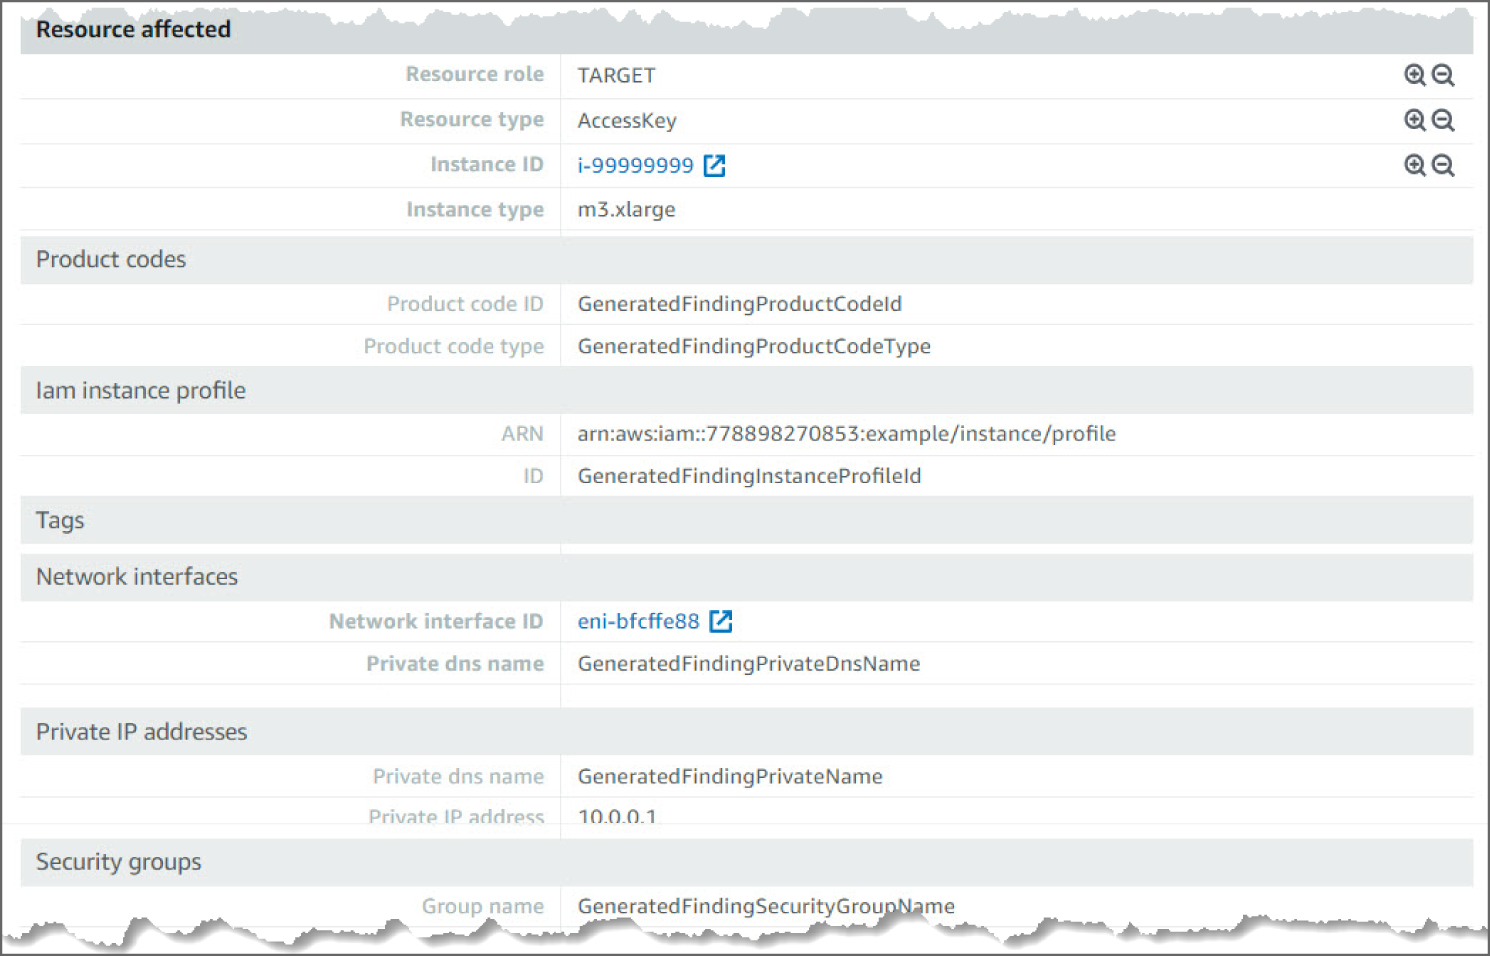
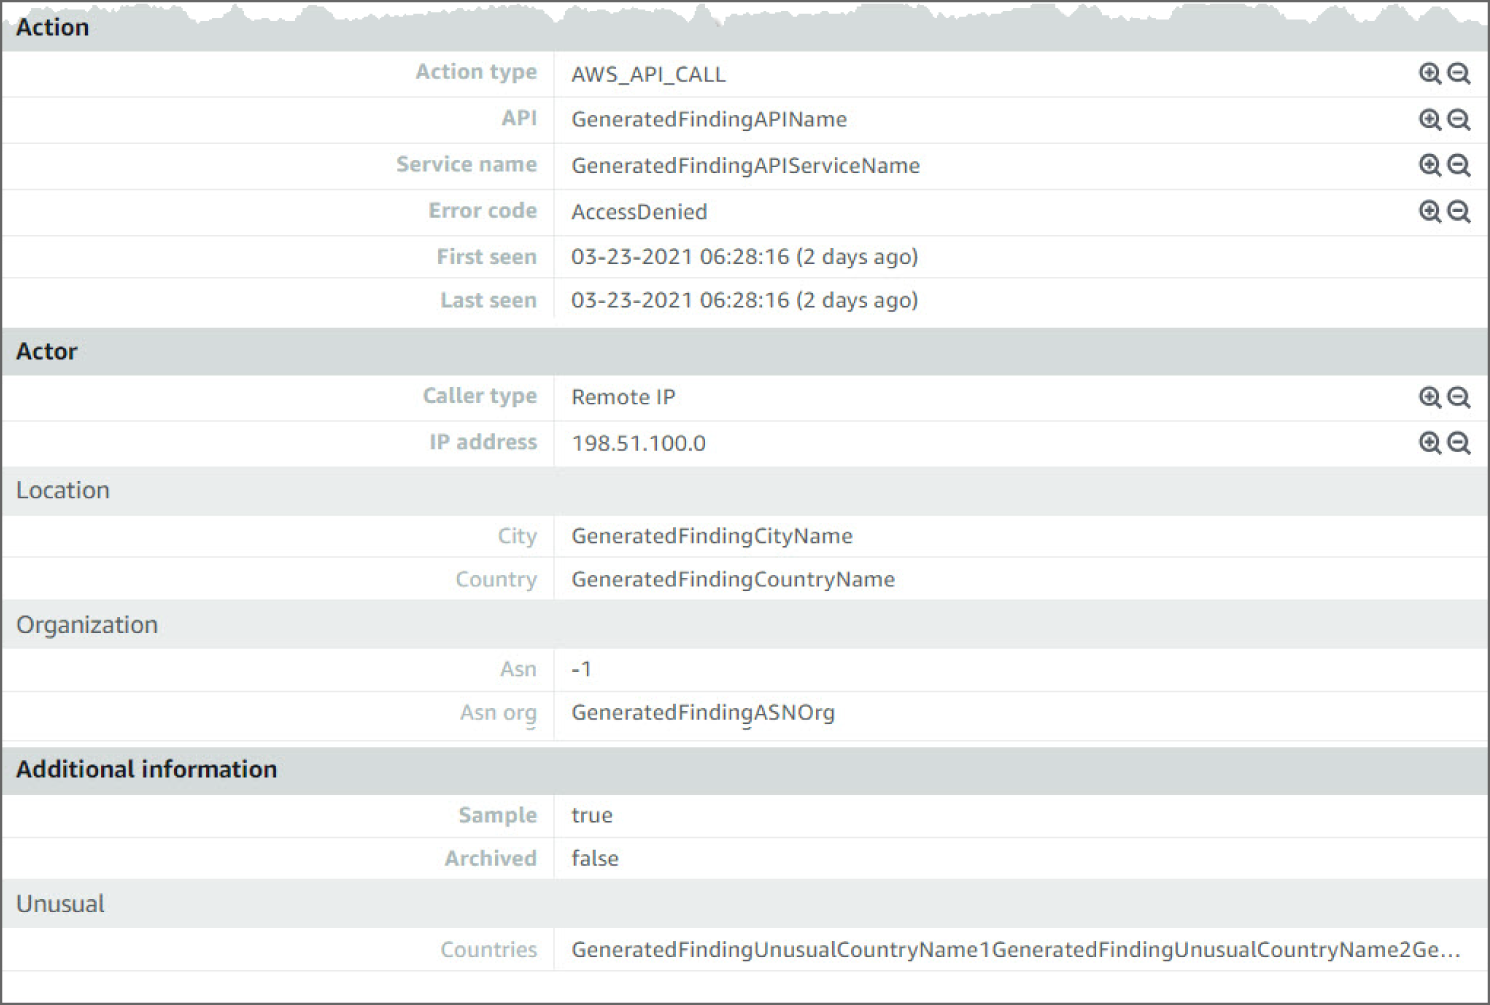
Figure 6.40: UnauthorizedAccess:IAMUser action screen
How Do You Detect Command and Control?
Command and Control consists of techniques that adversaries may use to communicate with systems under their control within a victim network. Adversaries commonly attempt to mimic normal, expected traffic to avoid detection. There are many ways an adversary can establish command and control with various levels of stealth depending on the victim's network structure and defenses.
Adversaries may communicate using the Domain Name System (DNS) application layer protocol to avoid detection/network filtering by blending in with existing traffic. Commands to the remote system, and often the results of those commands, will be embedded within the protocol traffic between the client and server.
The DNS protocol serves an administrative function in computer networking and thus may be very common in environments. DNS traffic may also be allowed even before network authentication is completed. DNS packets contain many fields and headers in which data can be concealed. Often known as DNS tunneling, adversaries may abuse DNS to communicate with systems under their control within a victim network while also mimicking normal, expected traffic.
The use of DNS for command and control can be detected by analyzing network data for uncommon data flows (e.g., a client sending significantly more data than it receives from a server). Processes utilizing the network that do not normally have network communication or have never been seen before are suspicious. Analyze packet contents to detect application layer protocols that do not follow the expected protocol standards regarding syntax, structure, or any other variable adversaries could leverage to conceal data.
How Do You Detect the Communications to a Command and Control Server Using the Domain Name System (DNS)?
The following walkthrough describes how to set up and use Amazon GuardDuty to determine if the EC2 instances within your AWS environment are querying a domain name associated with a known command and control (C&C) server.
Prerequisites
To use Amazon GuardDuty and other AWS services, you need an AWS account. If you don't have an account, visit https://aws.amazon.com and choose Create an AWS Account.
As a best practice, you should also create an AWS Identity and Access Management (IAM) user with administrator permissions and use that for all work that does not require root credentials.
Configure and enable GuardDuty, then generate sample findings and explore the basic operations. Refer to the “How Do You Detect Privilege Escalation?” section in this chapter for details.
How Do You Detect EC2 Instance Communication with a Command and Control (C&C) Server Using DNS
Click Findings from the left sidebar to go to the Findings page. See Figure 6.41.

Figure 6.41: GuardDuty Findings screen
Click the Backdoor:EC2/C&CActivity.B!DNS event to see additional information provided about the finding. See Figure 6.42.
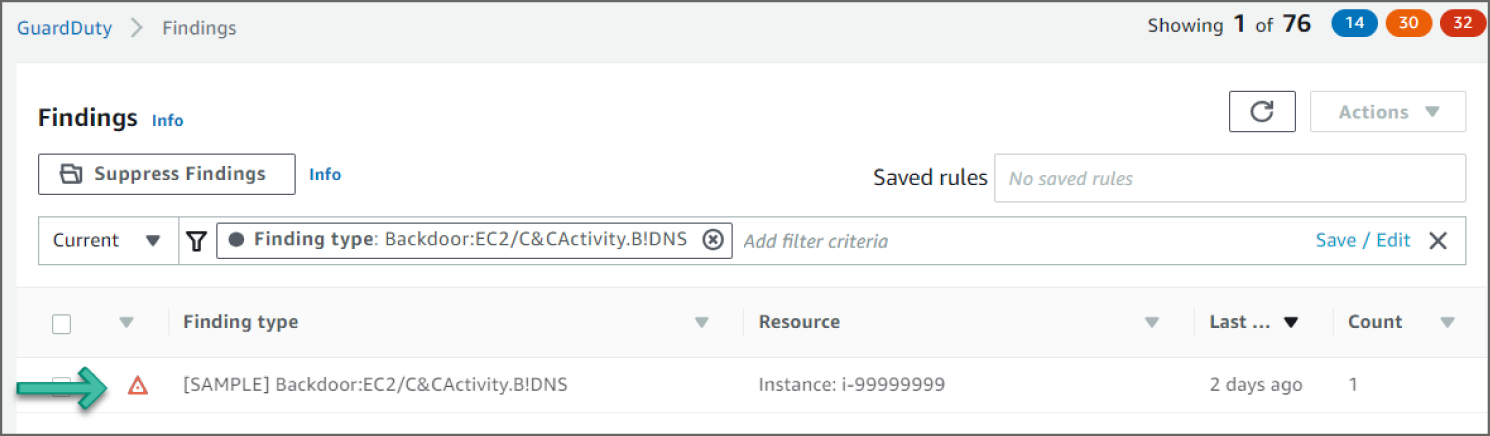
Figure 6.42: Findings screen
Reviewing the Findings
In the example shown in Figure 6.42, you see a Backdoor:EC2/C&CActivity.B!DNS finding. This finding informs you that the listed instance within your AWS environment is querying a domain name associated with a known command and control (C&C) server. The listed instance might be compromised. Command and control servers are computers that issue commands to members of a botnet. A botnet is a collection of Internet-connected devices, which might include PCs, servers, mobile devices, and Internet of Things devices, that are infected and controlled by a common type of malware. Botnets are often used to distribute malware and gather misappropriated information, such as credit card numbers. Depending on the purpose and structure of the botnet, the C&C server might also issue commands to begin a distributed denial-of-service (DDoS) attack.
Looking at the information in this finding, you see the severity as HIGH, as shown in Figure 6.43, meaning it's concerning and requires action immediately. You can see the region and account ID this event occurred in.
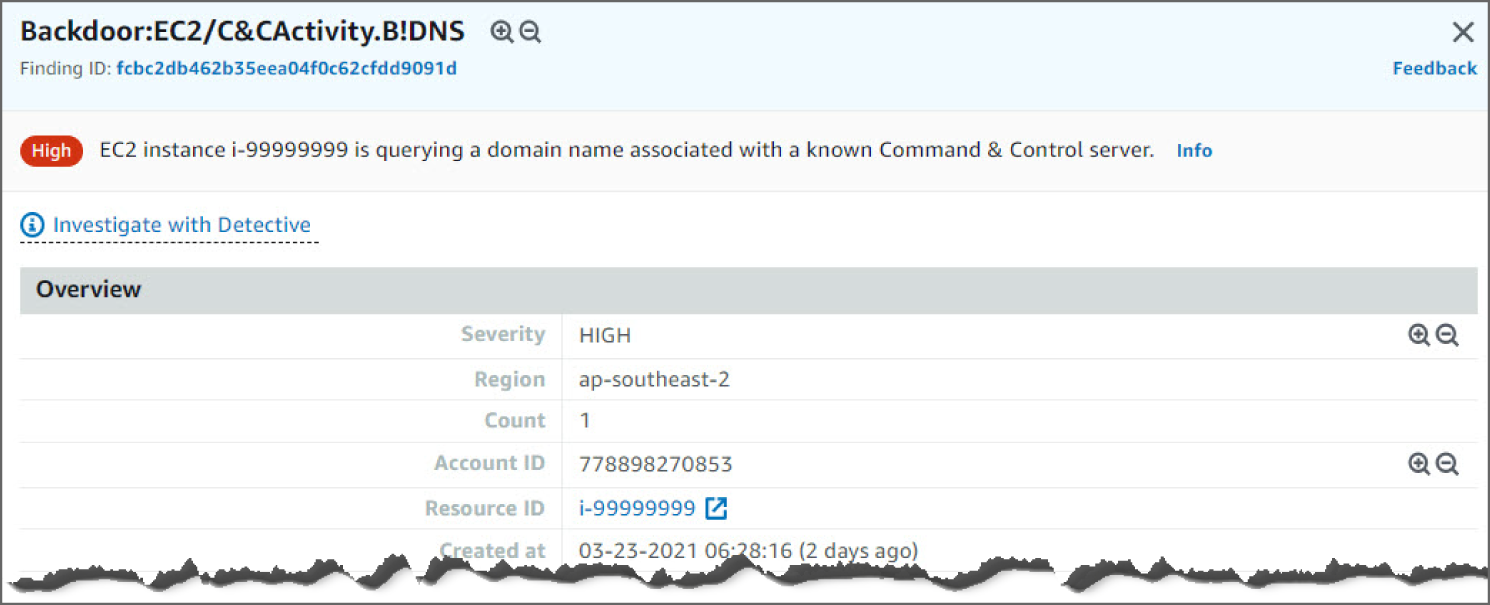
Figure 6.43: Backdoor:EC2/C&CActivity.B!DNS screen
Moving down, you see the AWS Resource against which this activity took place. See Figure 6.44.

Figure 6.44: Backdoor:EC2/C&CActivity.B!DNS screen
Moving down, you see the Action details. The details point to the protocol and action status that triggered the findings. Moving down again, you can see Actor details, including the domain name. See Figure 6.45.
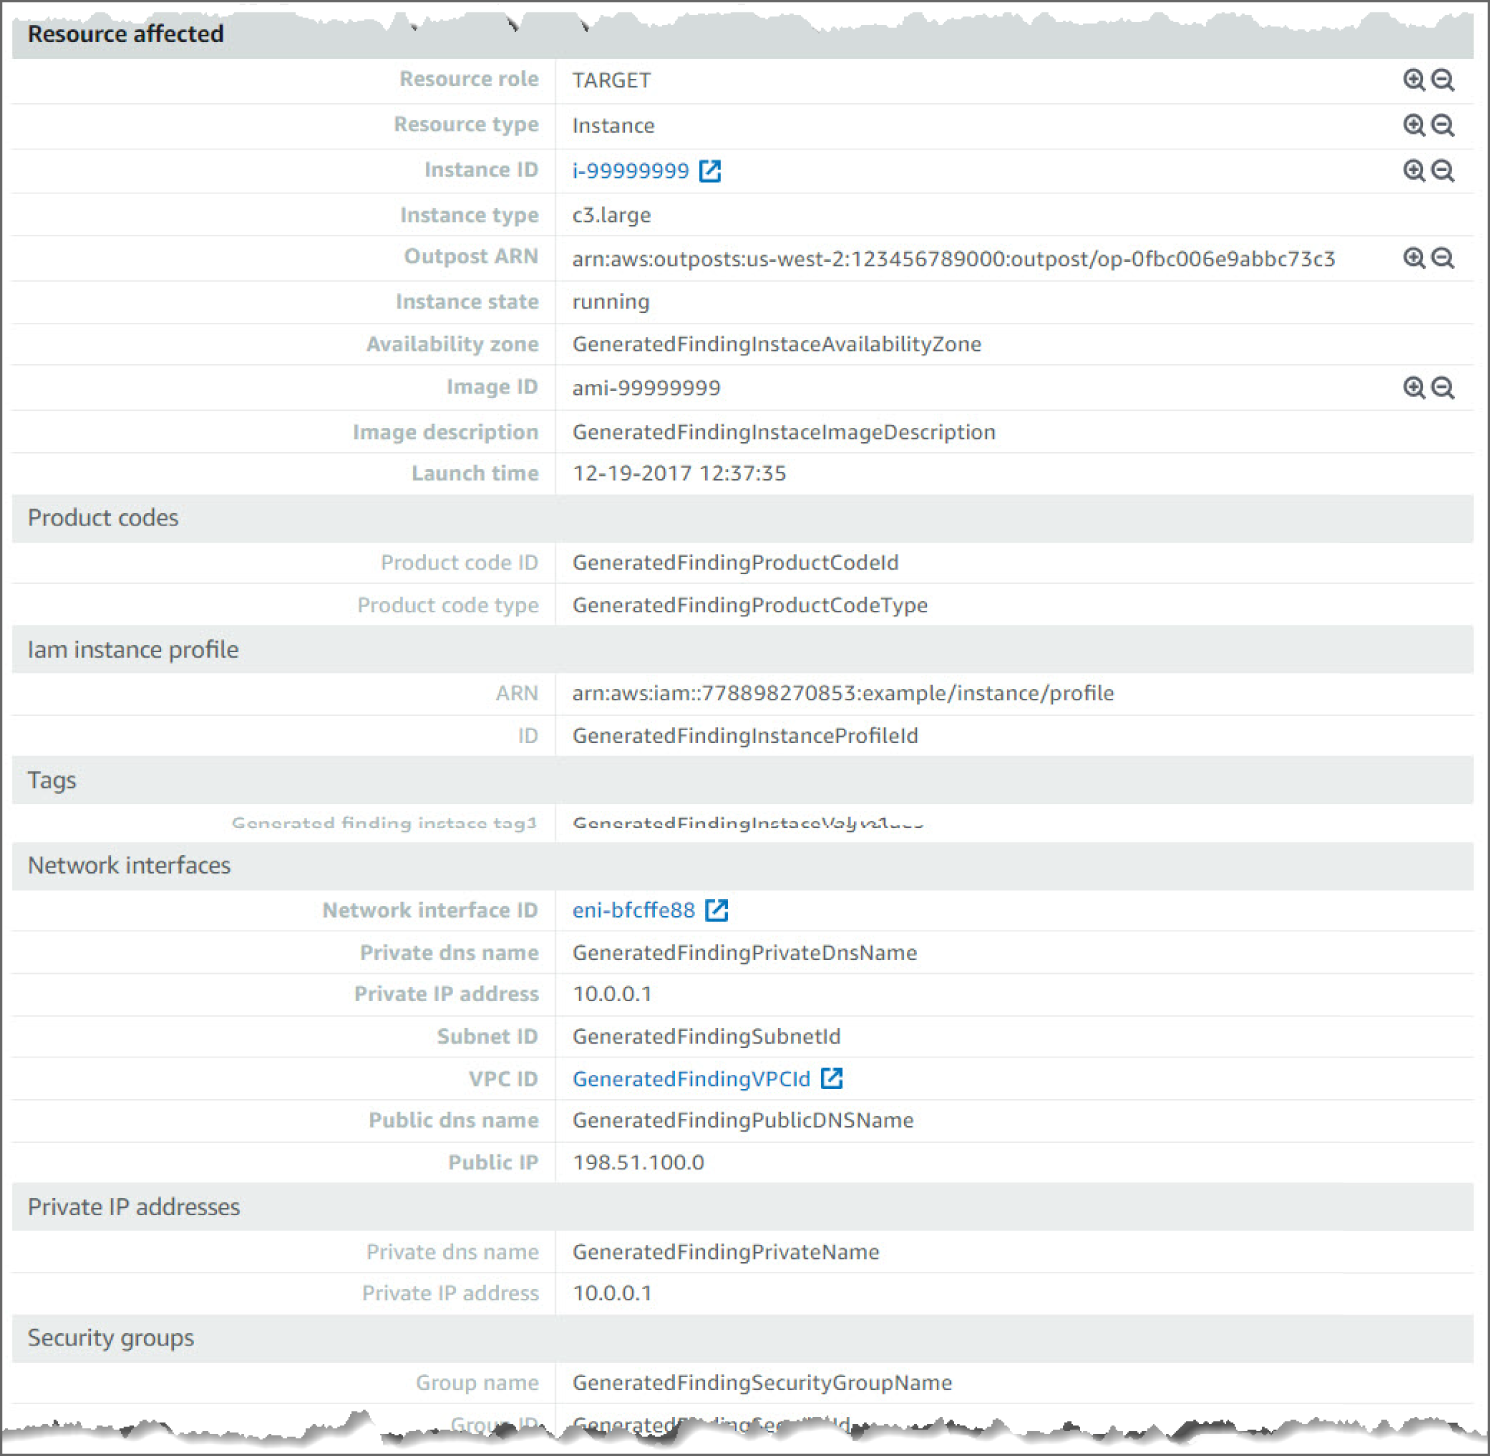
Figure 6.45: Backdoor:EC2/C&CActivity.B!DNS screen
How Do You Detect Data Exfiltration?
Once an attacker has gained initial access to a network, they will be looking for ways to extract data from a system. Exfiltration consists of techniques that adversaries may use to steal data from your network. Once they've collected data, adversaries often package it to avoid detection while removing it. This can include compression and encryption. Techniques for getting data out of a target network typically include transferring it over their command and control channel or an alternate channel and may also include putting size limits on the transmission.
Adversaries may steal data by exfiltrating it over a different protocol than that of the existing command and control channel. The data may also be sent to an alternate network location from the main command and control server.
Alternate protocols include FTP, SMTP, HTTP/S, DNS, SMB, or any other network protocol not being used as the main command and control channel. Different protocol channels could also include web services such as cloud storage. Adversaries may also opt to encrypt and/or obfuscate these alternate channels.
The Data Exfiltration can be detected by analyzing network data for uncommon data flows (e.g., a client sending significantly more data than it receives from a server). Processes utilizing the network that do not normally have network communication or have never been seen before are suspicious. Analyze packet contents to detect communications that do not follow the expected protocol behavior for the port that is being used.
The following walkthrough describes how to set up and use Amazon GuardDuty to find an anomalous API commonly used to collect data from an AWS environment.
Prerequisites
If you don't have an account, visit https://aws.amazon.com and choose Create an AWS Account. As a best practice, you should also create an AWS Identity and Access Management (IAM) user with administrator permissions and use that for all work that does not require root credentials.
Configure and enable GuardDuty and generate sample findings and explore basic operations. Refer to the “How Do You Detect Privilege Escalation” section in this chapter for details.
How Do You Detect the Exfiltration Using an Anomalous API Request?
Click Findings from the left sidebar to go to the Findings page. See Figure 6.46.
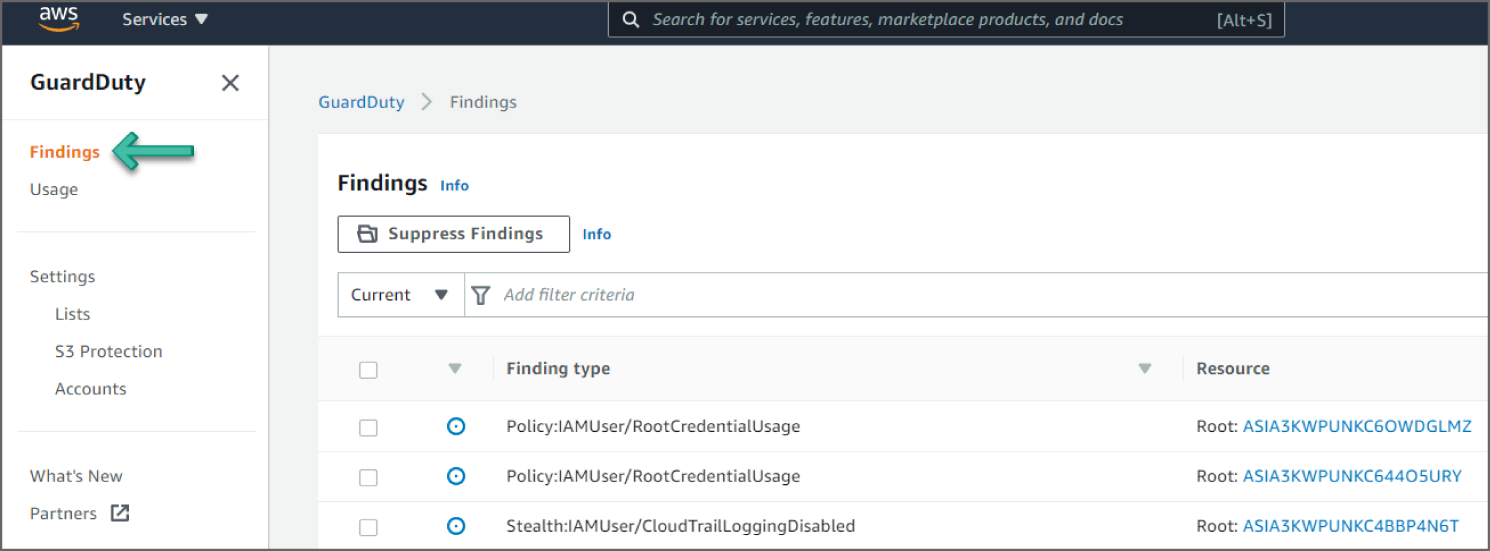
Figure 6.46: GuardDuty Findings screen
Click the Exfiltration:IAMUser/AnomalousBehavior event to see additional information provided about the finding. See Figure 6.47.
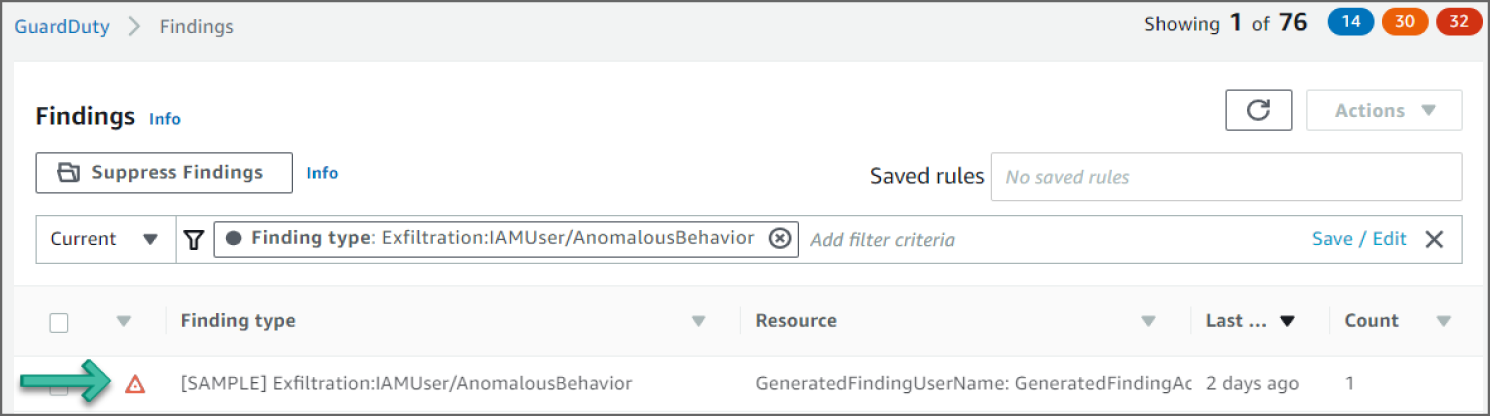
Figure 6.47: Findings screen
Reviewing the Findings
In the example shown in Figure 6.47, you see an Exfiltration:IAMUser/AnomalousBehavior finding. This finding informs you that an anomalous API request was observed in your account. This finding may include a single API or a series of related API requests made in proximity by a single CloudTrail user identity. The API observed is commonly associated with exfiltration tactics where an adversary is trying to collect data from your network using packaging and encryption to avoid detection. APIs for this finding type are CloudTrail management (control-plane) operations only and are typically related to S3, snapshots, and databases, such as PutBucketReplication, CreateSnapshot, or RestoreDBInstanceFromDBSnapshot.
This API request was identified as anomalous by GuardDuty's anomaly detection machine learning (ML) model. The ML model evaluates all API requests in your account and identifies anomalous events that are associated with techniques used by adversaries. The ML model tracks various factors of the API request, such as the user that made the request, the location the request was made from, and the specific API that was requested. Details on which factors of the API request are unusual for the user identity that invoked the request can be found in the finding details.
Looking at the information in this finding, you see the severity as HIGH, meaning it requires action immediately. You can see the region and account ID this event occurred in. See Figure 6.48.

Figure 6.48: Exfiltration:IAMUser/AnomalousBehavior screen
Moving down, in Figure 6.49, you see the Anomalous APIs that took place. The unusual behavior Account and the User Identity are also shown in the finding.

Figure 6.49: Exfiltration:IAMUser/AnomalousBehavior screen
Moving down, in Figure 6.50, you see the AWS Resource against which this activity took place.
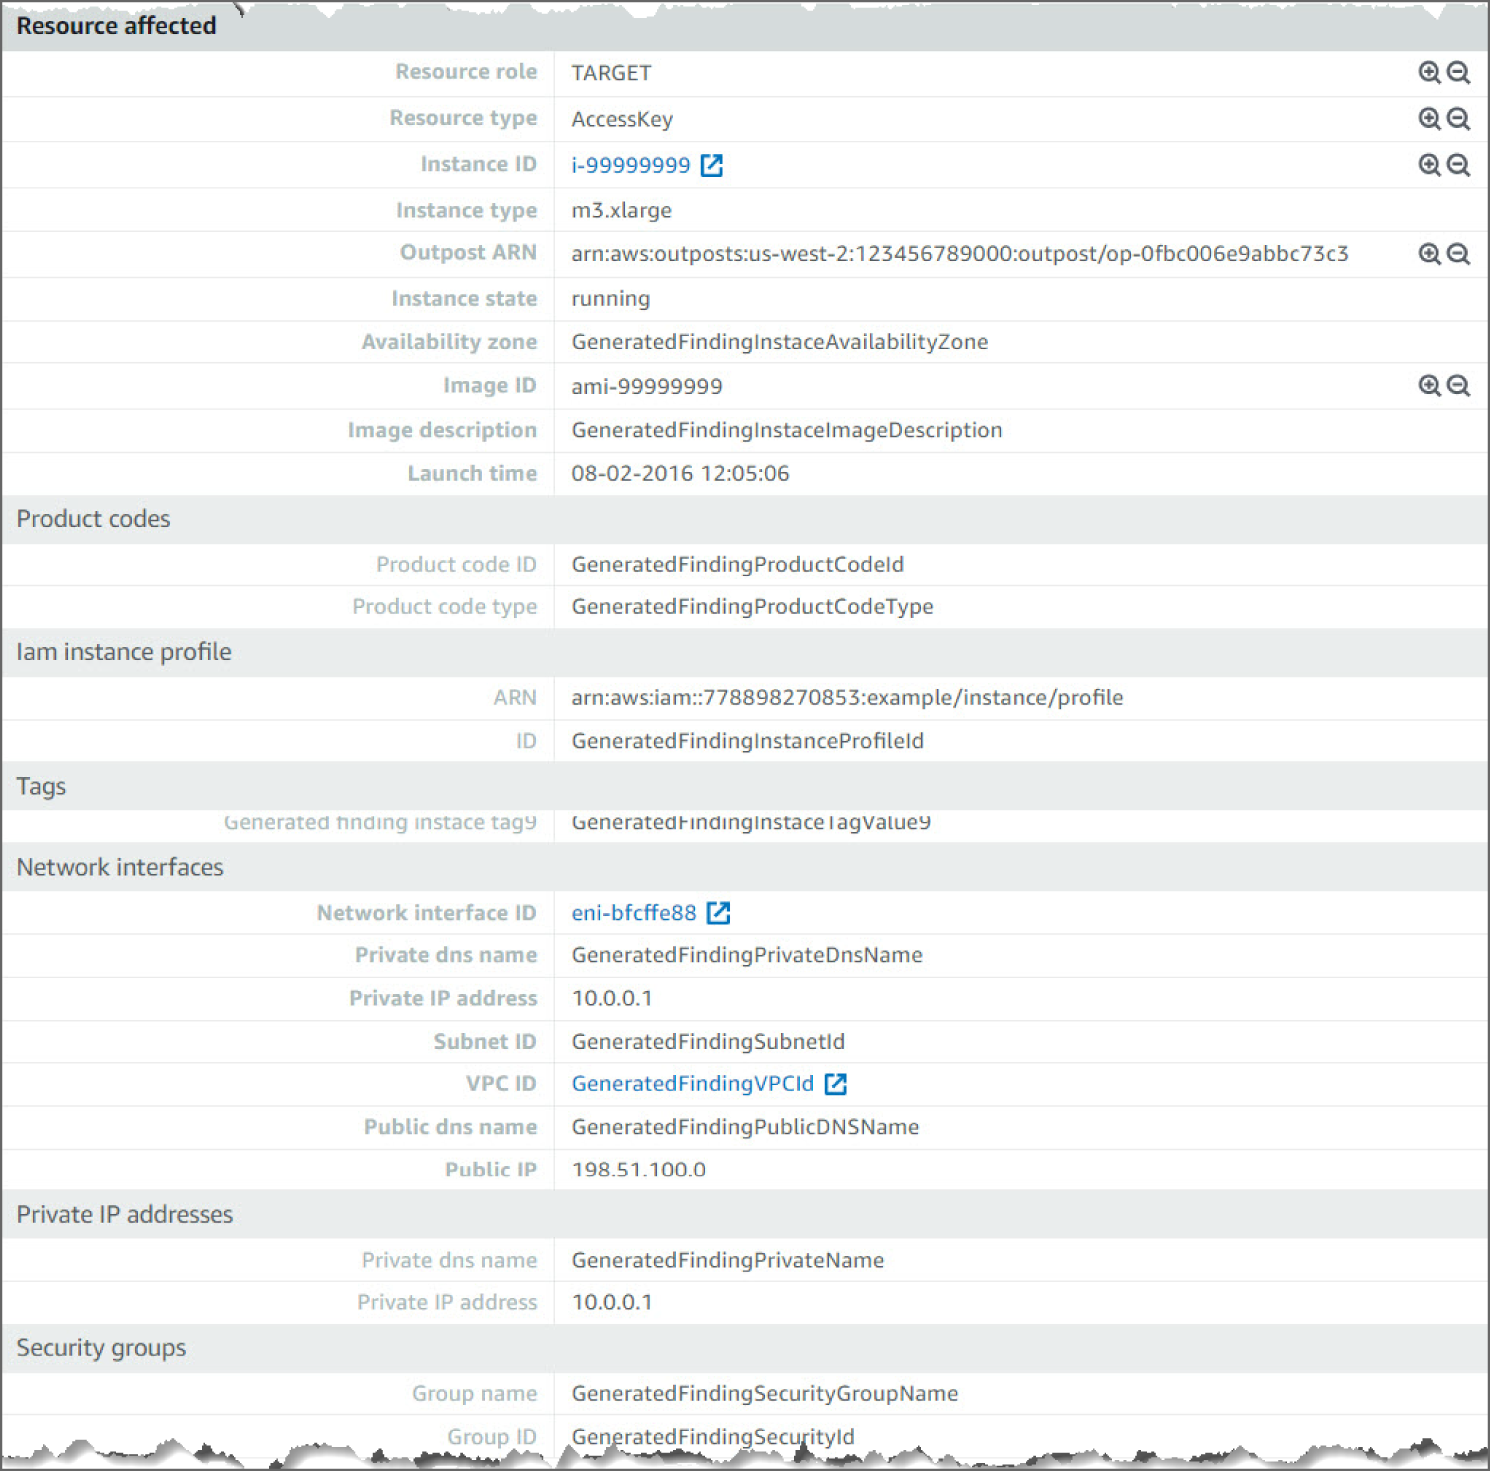
Figure 6.50: Exfiltration:IAMUser/AnomalousBehavior screen
Moving down, in Figure 6.51, you see the Action details. The details point to the Service Name and Error Code that triggered the findings. Moving down again, you can see Actor details, including the caller type, IP address, and the geo-location.
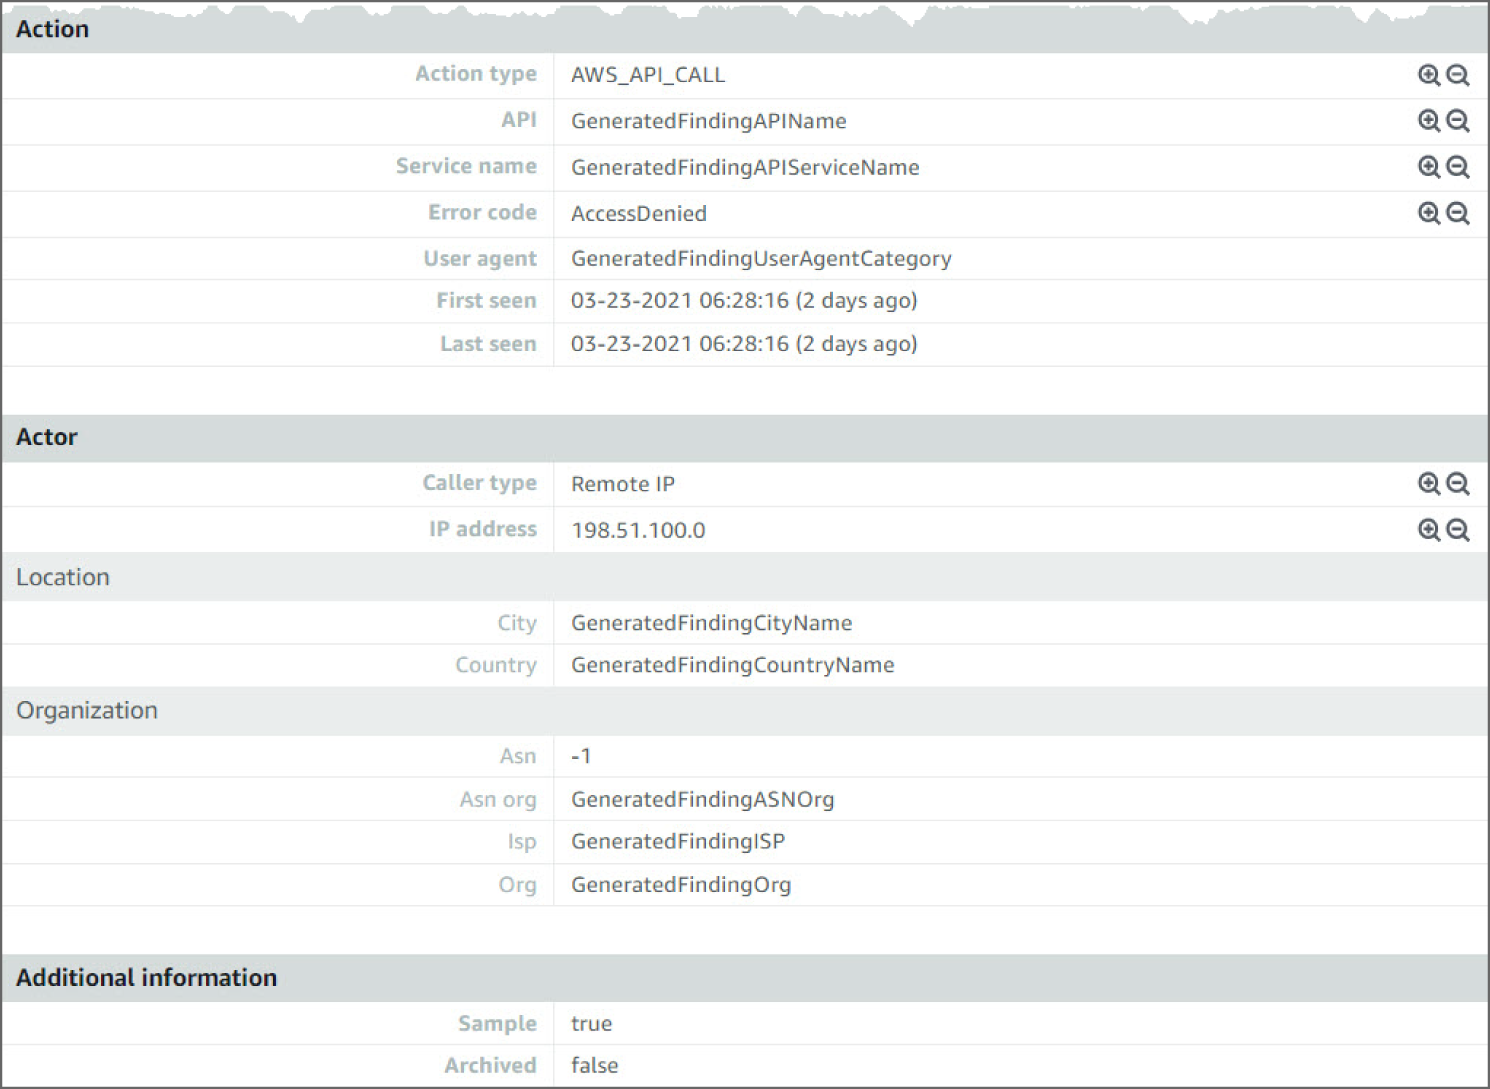
Figure 6.51: Exfiltration:IAMUser/AnomalousBehavior screen
How Do You Handle Response and Recover?
For the Response domain, if a cyber incident occurs, the effects must be managed by organizations. To comply with this requirement, the company should create a response plan, identify communication lines among the relevant parties, collect and analyze information about the case, conduct all the activities necessary to eliminate the incident, and integrate lessons learned into revised response strategies.
Organizations need to develop and implement effective activities to restore any capabilities or services that a cybersecurity event has impaired for the Recover domain. Your organization needs to have a recovery plan in place, coordinate recovery activities with outside parties, and incorporate lessons learned into your updated recovery strategy.
Foundation of Incident Response
All AWS users within an organization should have a basic understanding of security incident response processes, and security staff must deeply understand how to react to security issues. Experience and education are vital to a cloud incident response program, before you handle a security event. The foundation of a successful incident response program in the cloud is to Educate, Prepare, Simulate, and Iterate. To understand each of these aspects, consider the following descriptions:
- Educate your security operations and incident response staff about cloud technologies and how your organization intends to use them.
- Prepare your incident response team to detect and respond to incidents in the cloud, enabling detective capabilities, and ensuring appropriate access to the necessary tools and cloud services. Additionally, prepare the necessary runbooks, both manual and automated, to ensure reliable and consistent responses. Work with other teams to establish expected baseline operations, and use that knowledge to identify deviations from those normal operations.
- Simulate both expected and unexpected security events within your cloud environment to understand the effectiveness of your preparation.
- Iterate on the outcome of your simulation to improve the scale of your response posture, reduce time to value, and further reduce risk.
How Do You Create an Automated Response?
Automation is a force multiplier, which means it scales the efforts of your responders to match the speed of the organization. Moving from manual processes to automated processes enables you to spend more time increasing the security of your AWS Cloud environment.
Automating Incident Responses
To automate security engineering and operations functions, you can use a comprehensive set of APIs and tools from AWS. You can fully automate identity management, network security, data protection, and monitoring capabilities and deliver them using popular software development methods that you already have in place. When you build security automation, your system can monitor, review, and initiate a response, rather than having people monitor your security posture and manually react to events. If your incident response teams continue to respond to alerts in the same way, they risk alert fatigue. Over time, the team can become desensitized to alerts and can either make mistakes handling ordinary situations or miss unusual alerts.
Automation helps avoid alert fatigue by using functions that process the repetitive and ordinary alerts, leaving humans to handle the sensitive and unique incidents. You can improve manual processes by programmatically automating steps in the process. After you define the remediation pattern to an event, you can decompose that pattern into actionable logic, and write the code to perform the logic. Responders can then execute that code to remediate the issue. Over time, you can automate more and more steps, and ultimately automatically handle whole classes of common incidents. However, your objective should be to further reduce the time gap between detective mechanisms and responsive mechanisms. Historically, this time gap can take hours, days, or even months. An Incident Response survey by SANS in 2016 found that 21% of respondents stated their time to detection took two to seven days, and only 29% of respondents were able to remediate events within the same time frame. In the cloud, you can reduce that response time gap to seconds by building event-driven response capabilities.
Options for Automating Responses
It is important to make sure that you balance the enterprise implementation and organization structure. Figure 6.52 illustrates the differences in technical attributes for each automated response option in your AWS implementation. In the radar chart, the further the technical attribute moves from the center of the chart, the greater the strength of that technical attribute for the corresponding automation response. For example, AWS Lambda offers more speed and requires a less technical skillset. AWS Fargate offers more flexibility and requires less maintenance and a less technical skillset. Table 6.1 provides an overview of these automation options and a summary of the technical attributes of each.

Figure 6.52: Differences in technical attributes across automated response approaches
Table 6.1: Options for Automated Responses
| AWS SERVICE OR FEATURE | DESCRIPTION | ATTRIBUTES SUMMARY* |
|---|---|---|
| AWS Lambda | System using AWS Lambda only, using your organization's enterprise language. | Speed Flexibility Maintenance Skillset |
| AWS Step Functions | System using AWS Step Functions, Lambda, and SSM Agent. | Speed Flexibility Maintenance Skillset |
| Auto Remediation with AWS Config Rules | Set of AWS Config Rules and auto remediation that evaluate the environment and push it back into the approved specification. | Maintenance & Skillset Speed & Flexibility |
| SSM Agent | Set of automation rules and documents reviewing many pieces of the environments and internal systems and making corrections. | Maintenance & Skillset Speed Flexibility |
| AWS Fargate | AWS Fargate system using open source step function code and the events from Amazon CloudWatch, and other systems to drive detection and remediation. | Flexibility Speed Maintenance & Skillset |
| Amazon EC2 | A system running on a full instance, similar to the AWS Fargate option. | Flexibility Speed Maintenance Skillset |
* Attributes are listed in descending order for each service or feature. For example, AWS Lambda offers more speed and requires a less technical skillset. AWS Fargate offers more flexibility and requires less maintenance and less technical skillset.
As you consider these automation options in your AWS environment, you also need to consider centralization and scan period (events per second [EPS]). Centralization refers to a central account that drives all of the detection and remediation for an organization. This approach may seem like the best choice out-of-the-box, and it is the current best practice. However, some circumstances require that you deviate from this approach, and understanding when depends on how you handle your subordinate accounts. If you have a red team or regulatory difference in your enterprise, you may need to implement differently for that portion of the organization. In that case, your security team should set up a separate security account, similar to the Security Tools account in the Multi-Account Framework in AWS Organizations or AWS Control Tower. The following table addresses pros and cons of centralization and decentralization.
| CENTRALIZATION | DECENTRALIZATION | |
|---|---|---|
| Pros | Simple configuration management Unable to cancel or modify response | Simple architecture Faster initial setup |
| Cons | Increased complexity in architecture Onboarding offboarding accounts and resources | More resources to manage Difficulty maintaining a software baseline |
A cost comparison for these implementations may also drive your enterprise decision in determining the best option. Events per second (EPS) is the metric that you use to best estimate cost. In the end, it may be far easier and cheaper to use centralized or decentralized approaches, but it is impossible for us to review how you will evaluate that cost specifically in your account. Make sure to consider EPS when sending those events to a central account to be responded to. The more EPS, the higher the cost of sending those events to a centralized account.
Cost Comparisons in Scanning Methods
Costs are further determined by the scanning method by which an anomaly is detected and the time frame between validations. For scanning methods, you can choose between event based or periodic scan review. The following table shows the pros and cons of both approaches.
| EVENT-BASED | PERIODIC SCAN | |
|---|---|---|
| Pros | Less time from event to response Limited need to query additional API calls | Full picture at a given point in time |
| Cons | Limited state context around the resource Events triggered may be for a resource not readily available | Service limits against large accounts Can potentially run into throttling due to high volume of API calls |
In many cases, a combination of both scanning approaches is most likely the best choice in a fully mature organization. The AWS Security Hub and AWS Foundational Security Best Practices standard provide a combination of both scanning methods. Figure 6.53 provides a radar chart illustrating the cost comparison of events per second (EPS) for each of the automation approaches. For example, Amazon EC2 and AWS Fargate have the highest costs for running 0–10 EPS, whereas AWS Lambda and AWS Step Functions have the highest costs for running 76+ EPS.
![Snapshot of the cost comparison of automation options scanning methods (events per second [EPS])](https://imgdetail.ebookreading.net/2023/10/9781119804062/9781119804062__9781119804062__files__images__c06f053.png)
Figure 6.53: Cost comparison of automation options scanning methods (events per second [EPS])
Event-Driven Responses
With an event-driven response system, a detective mechanism triggers a responsive mechanism to automatically remediate the event. You can use event-driven response capabilities to reduce the time-to-value between detective mechanisms and responsive mechanisms. To create this event-driven architecture, you can use AWS Lambda, which is a serverless compute service that runs your code in response to events and automatically manages the underlying compute resources for you.
For example, assume that you have an AWS account with the AWS CloudTrail service enabled. If AWS CloudTrail is ever disabled (through the cloudtrail:StopLogging API), the response procedure is to enable the service again and investigate the user that disabled the AWS CloudTrail logging. Instead of performing these steps manually in the AWS Management Console, you can programmatically enable the logging again (through the cloudtrail:StartLogging API). If you implement this with code, your response objective is to perform this task as quickly as possible and notify the responders that the response was performed. You can decompose the logic into simple code to run in an AWS Lambda function to perform these tasks. You can then use Amazon CloudWatch Events to monitor for the specific cloudtrail:StopLogging event, and invoke the function if it occurs. When this AWS Lambda responder function is invoked by Amazon CloudWatch Events, you can pass it the details of the specific event with the information of the principal that disabled AWS CloudTrail, when it was disabled, the specific resource that was affected, and other relevant information.
You can use this information to enrich the finding from logs, and then generate a notification or alert with only the specific values that a response analyst would require. Ideally, the goal of event-driven response is for the Lambda responder function to perform the response tasks and then notify the responder that the anomaly has been successfully resolved with any pertinent contextual information. It is then up to the human responder to decide how to determine why it occurred and how future reoccurrences might be prevented.
This feedback loop drives further security improvement into your cloud environments. To achieve this objective, you must have a culture that enables your security team to work closer with your development and operations teams.
How Do You Automatically Respond to Unintended Disabling of CloudTrail Logging?
The following walkthrough describes an automated response for a simulated event that indicates potential unauthorized activity—the unintended disabling of CloudTrail logging. Outside parties might want to disable logging to prevent detection and recording of their unauthorized activity. The standard response is to immediately notify the security contact.
Amazon GuardDuty generates the finding Stealth:IAMUser/CloudTrailLoggingDisabled when CloudTrail logging is disabled, and AWS Security Hub collects findings from GuardDuty using the standardized finding format mentioned earlier. See Figure 6.54.
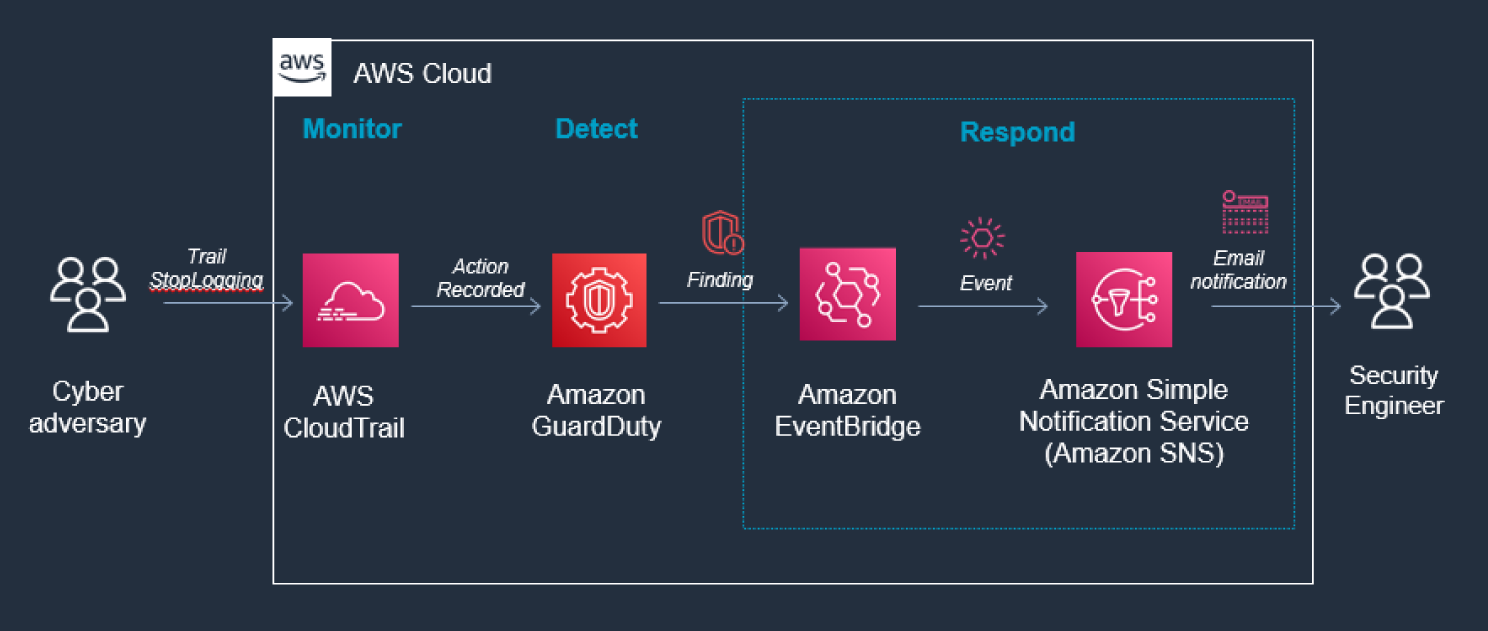
Figure 6.54: CloudTrail screen
CloudTrail logs are monitored for undesired activities. For example, if a trail is stopped, there will be a corresponding log record. GuardDuty detects this activity and retrieves additional data points about the source IP that executed the API call. Two common examples of those additional data points in GuardDuty findings include whether the API call came from an IP address on a threat list, or whether it came from a network not commonly used in your AWS account. Using EventBridge and SNS, you can configure GuardDuty to notify the security contact.
Prerequisites
To use AWS Event Bridge and other AWS services, you need an AWS account. If you don't have an account, visit https://aws.amazon.com and choose Create an AWS Account. As a best practice, you should also create an AWS Identity and Access Management (IAM) user with administrator permissions and use that for all work that does not require root credentials.
Configure and enable GuardDuty. Refer to the “How Do You Detect Privilege Escalation” section in this chapter for details.
Creating a Trail in CloudTrail
Go to the CloudTrail service in the console and then follow these steps:
- Click Create a Trail in the dashboard. See Figure 6.55.
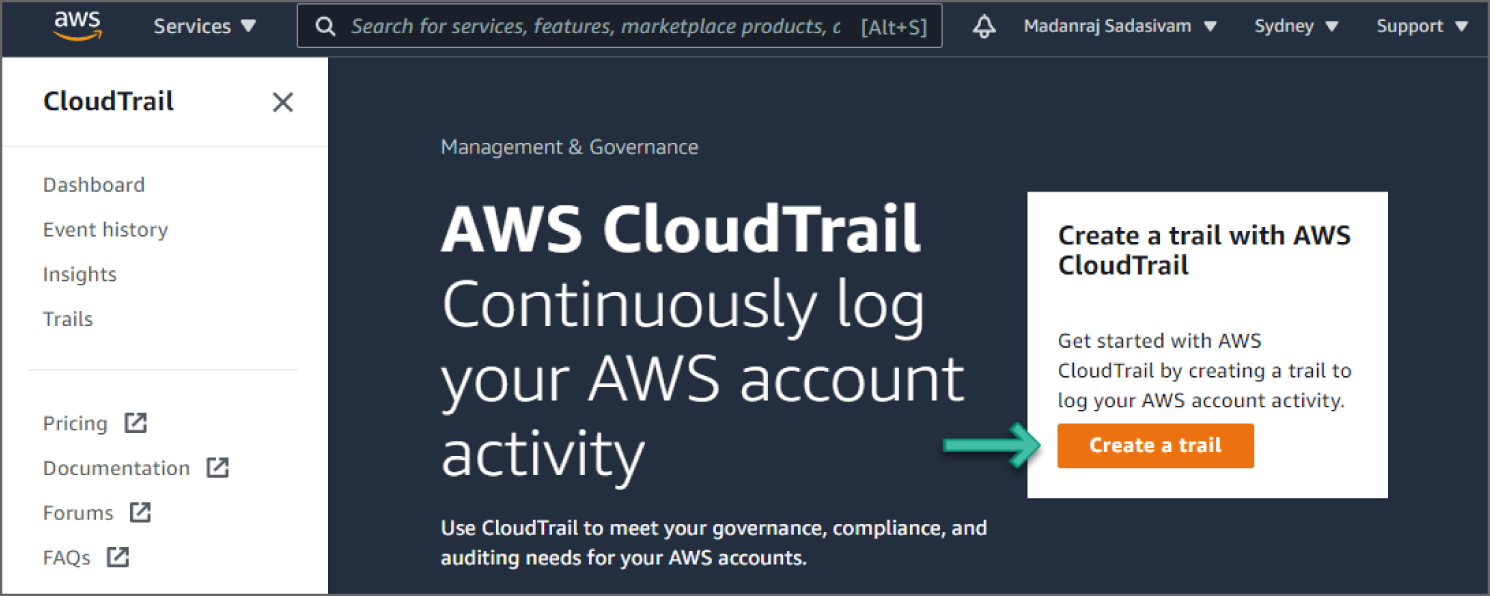
Figure 6.55: Create a Trail screen
- Set a meaningful name for the Trail and optionally choose Enable for all accounts in my organization if appropriate. See Figure 6.56.
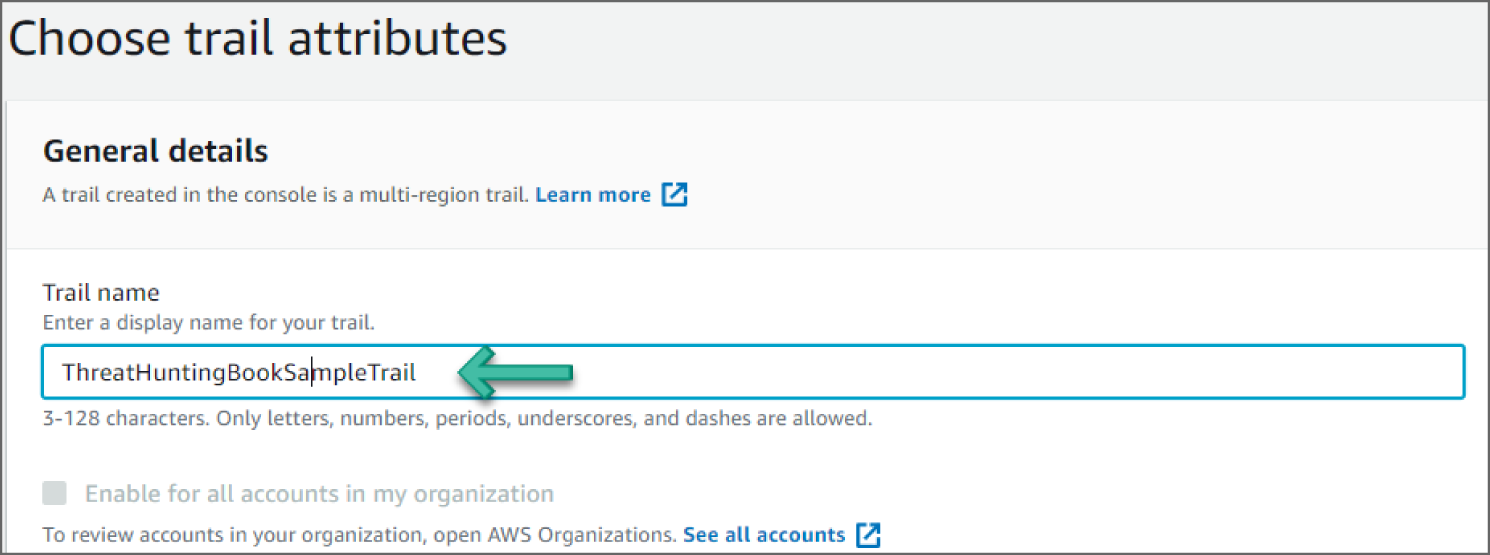
Figure 6.56: Trail Attributes screen
- Under the Storage Location, select Create New S3 Bucket. Note that the S3 bucket name is auto-generated. See Figure 6.57.
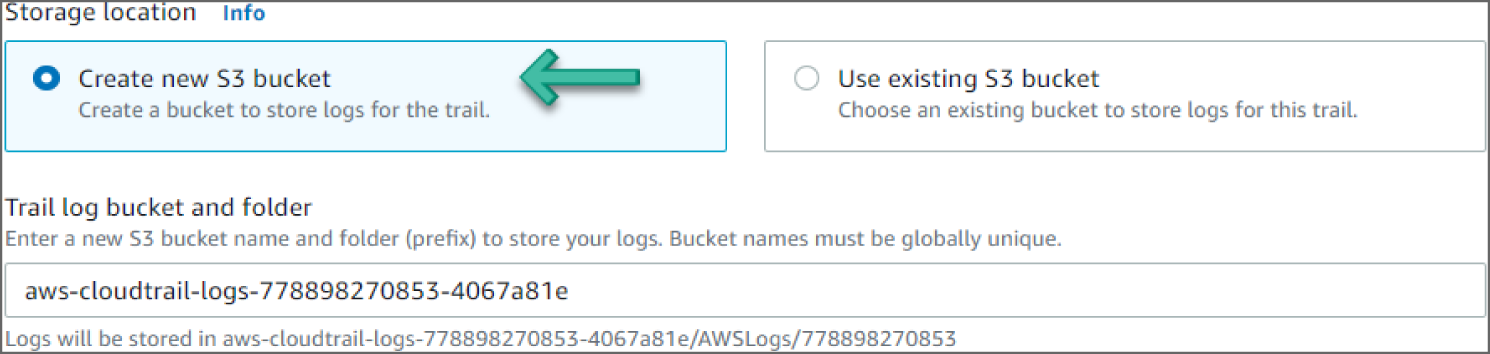
Figure 6.57: Create S3 Bucket screen
- Enable the Log File SSE-KMS Encryption.
- Under AWS KMS Customer Managed CMK, select New and provide a meaningful AWS KMS alias name. See Figure 6.58.
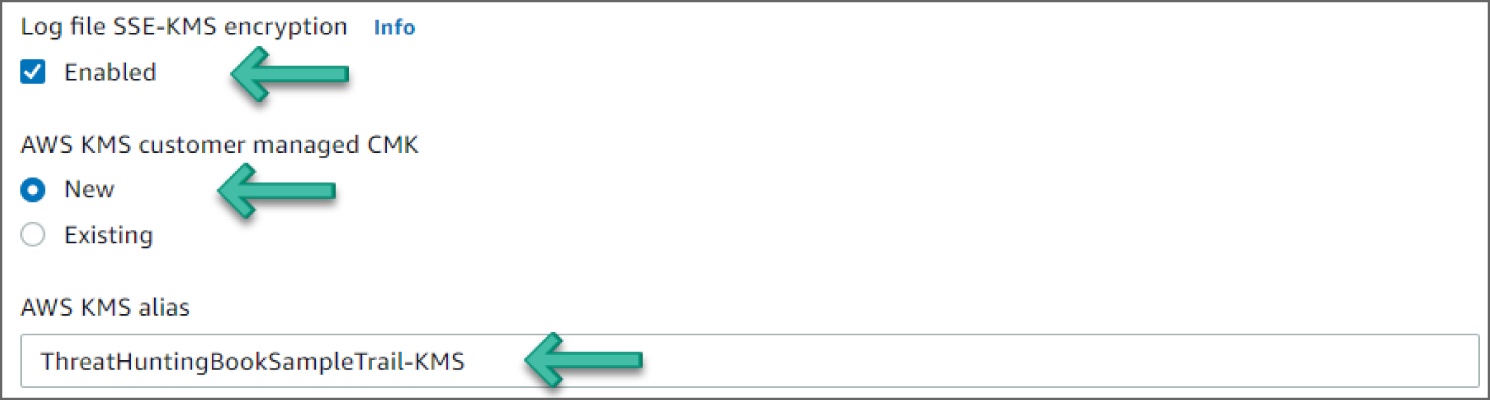
Figure 6.58: Enable Encryption screen
- Expand the Advanced option to verify the additional settings. Leave them with their default values, as shown in Figure 6.59.
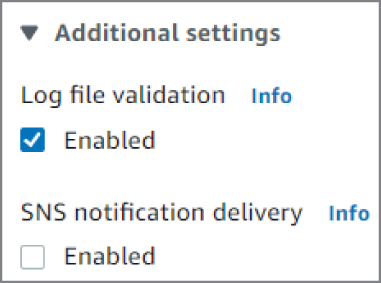
Figure 6.59: Enable Advanced Option screen
- Scroll to the bottom of the page and click Next. You should now see the Choose Log Events screen.
- Under Events, choose all event types—Management events, Data events, and Insight events. See Figure 6.60.
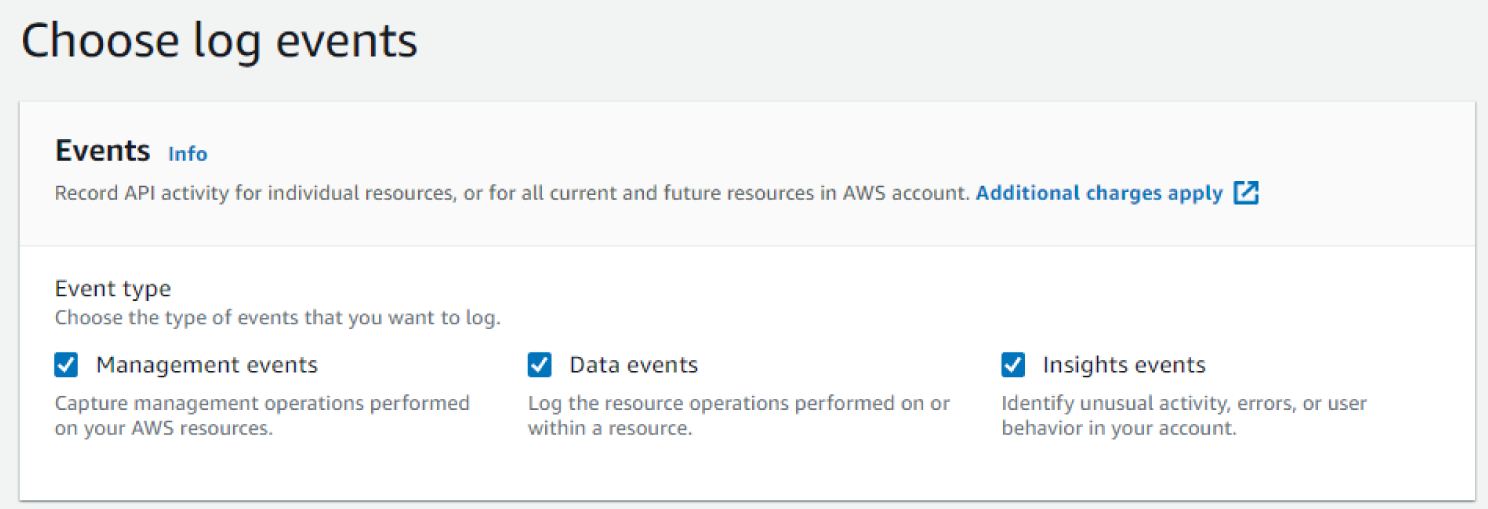
Figure 6.60: Events screen
- Accept the default options for the Management events and scroll to the bottom of the page. Click Next. You should now see the Management Events screen. See Figure 6.61.
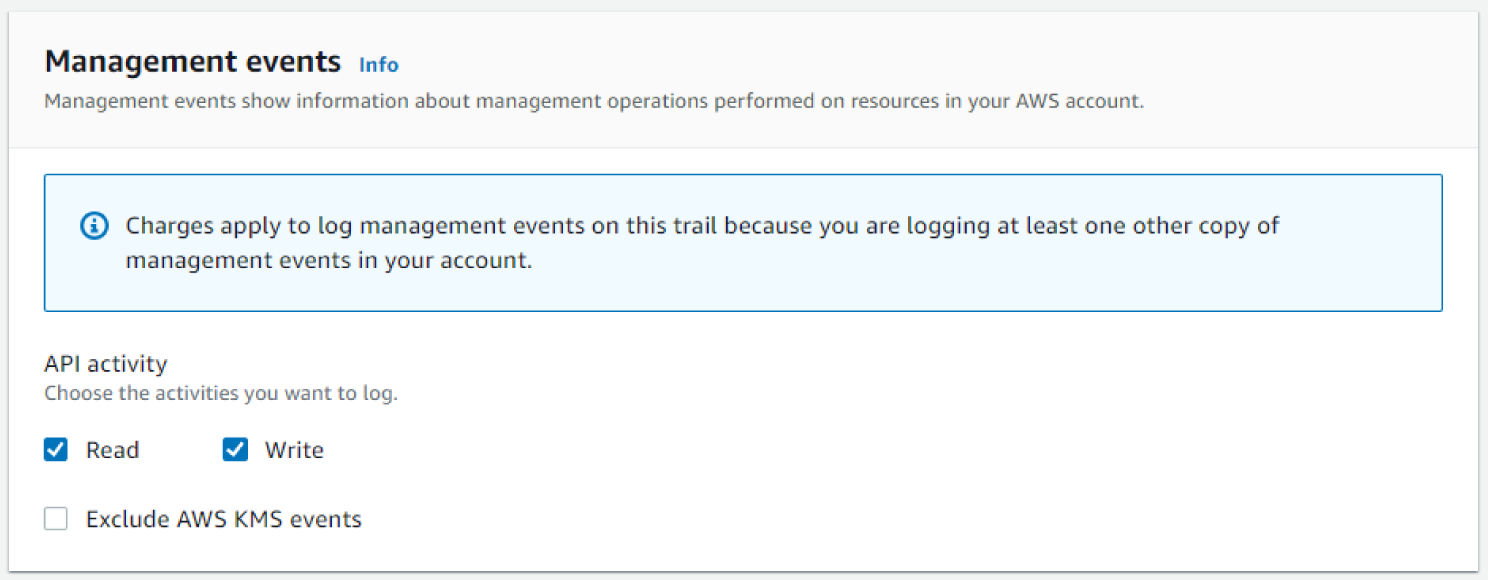
Figure 6.61: Management Events screen
- Scroll to the bottom of the page and click Create. You can click Trails from the left sidebar of the CloudTrail dashboard and verify that the trail's status is a success.
- Click the trail's name to go to the trail's details page. You can change any settings from this page. You can also stop logging for this trail using the Stop Logging button. See Figure 6.62.
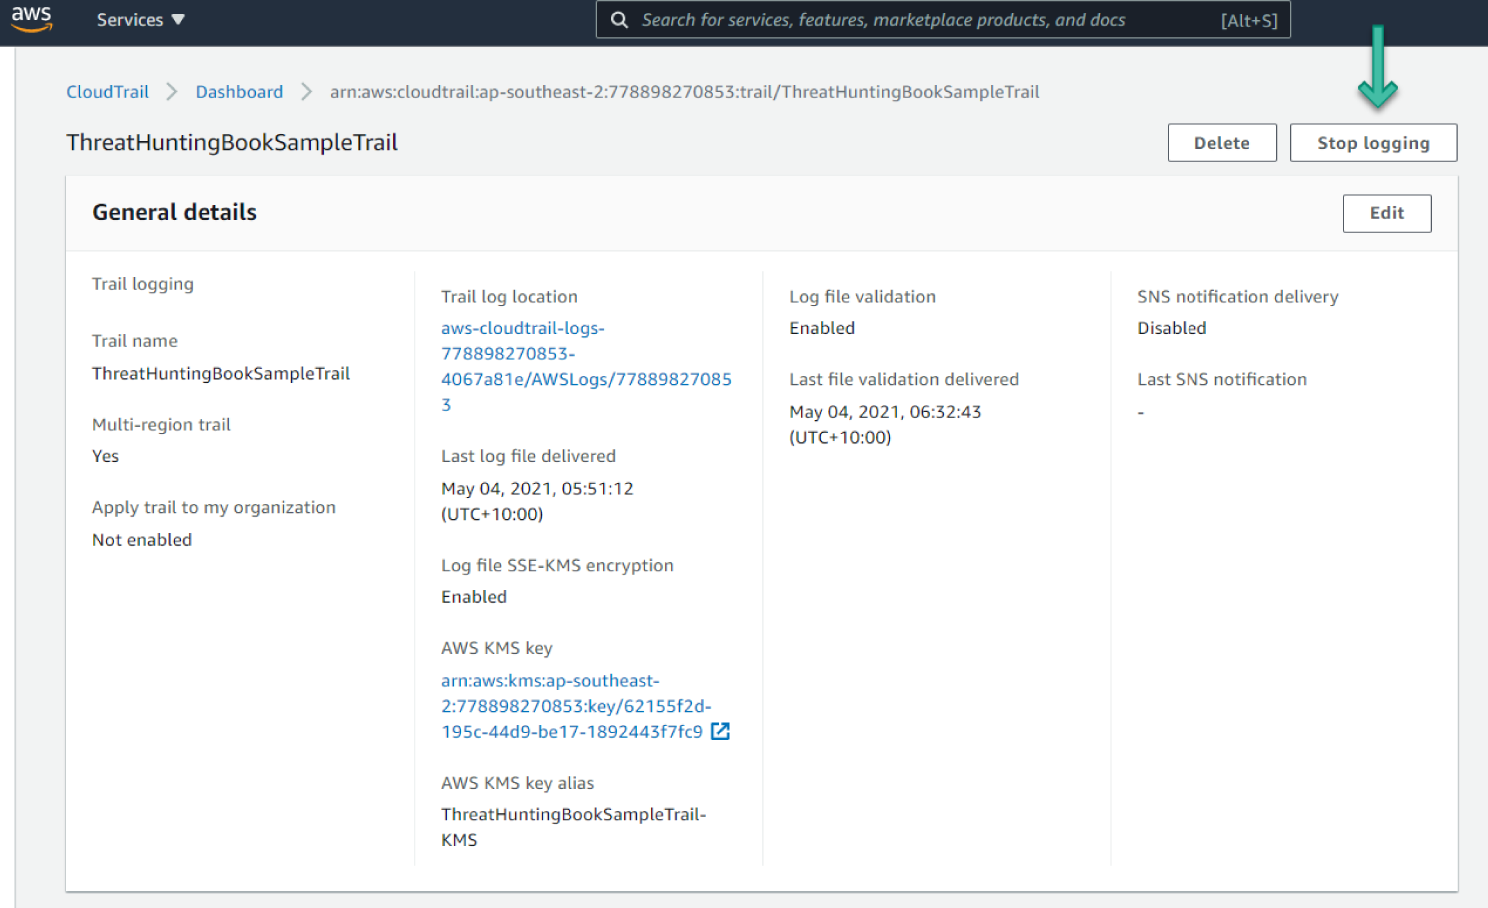
Figure 6.62: CloudTrail Details screen
Creating an SNS Topic to Send Emails
We will walk through how to create an SNS topic for sending emails. SNS is a managed publish/subscribe messaging service and can be used with many endpoints, such as email, Lambda, and more.
- Go to the Amazon Simple Notification Service in the console.
- Provide a meaningful name for the topic and click Next Step. See Figure 6.63.
- Leave the other options as they are and scroll down to the bottom of the page. Click Create Topic. See Figure 6.64.
- Go to Topic and select the Subscriptions tab.
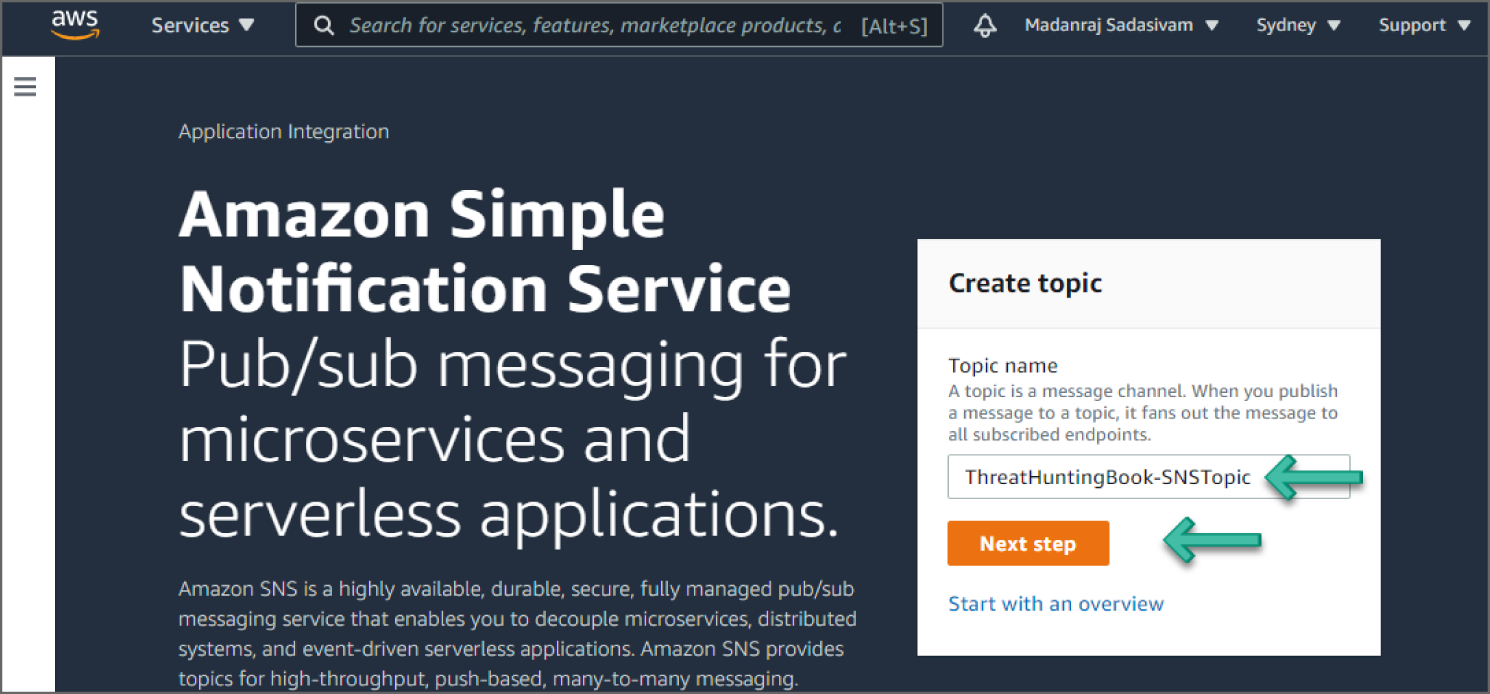
Figure 6.63: Simple Notification Service screen
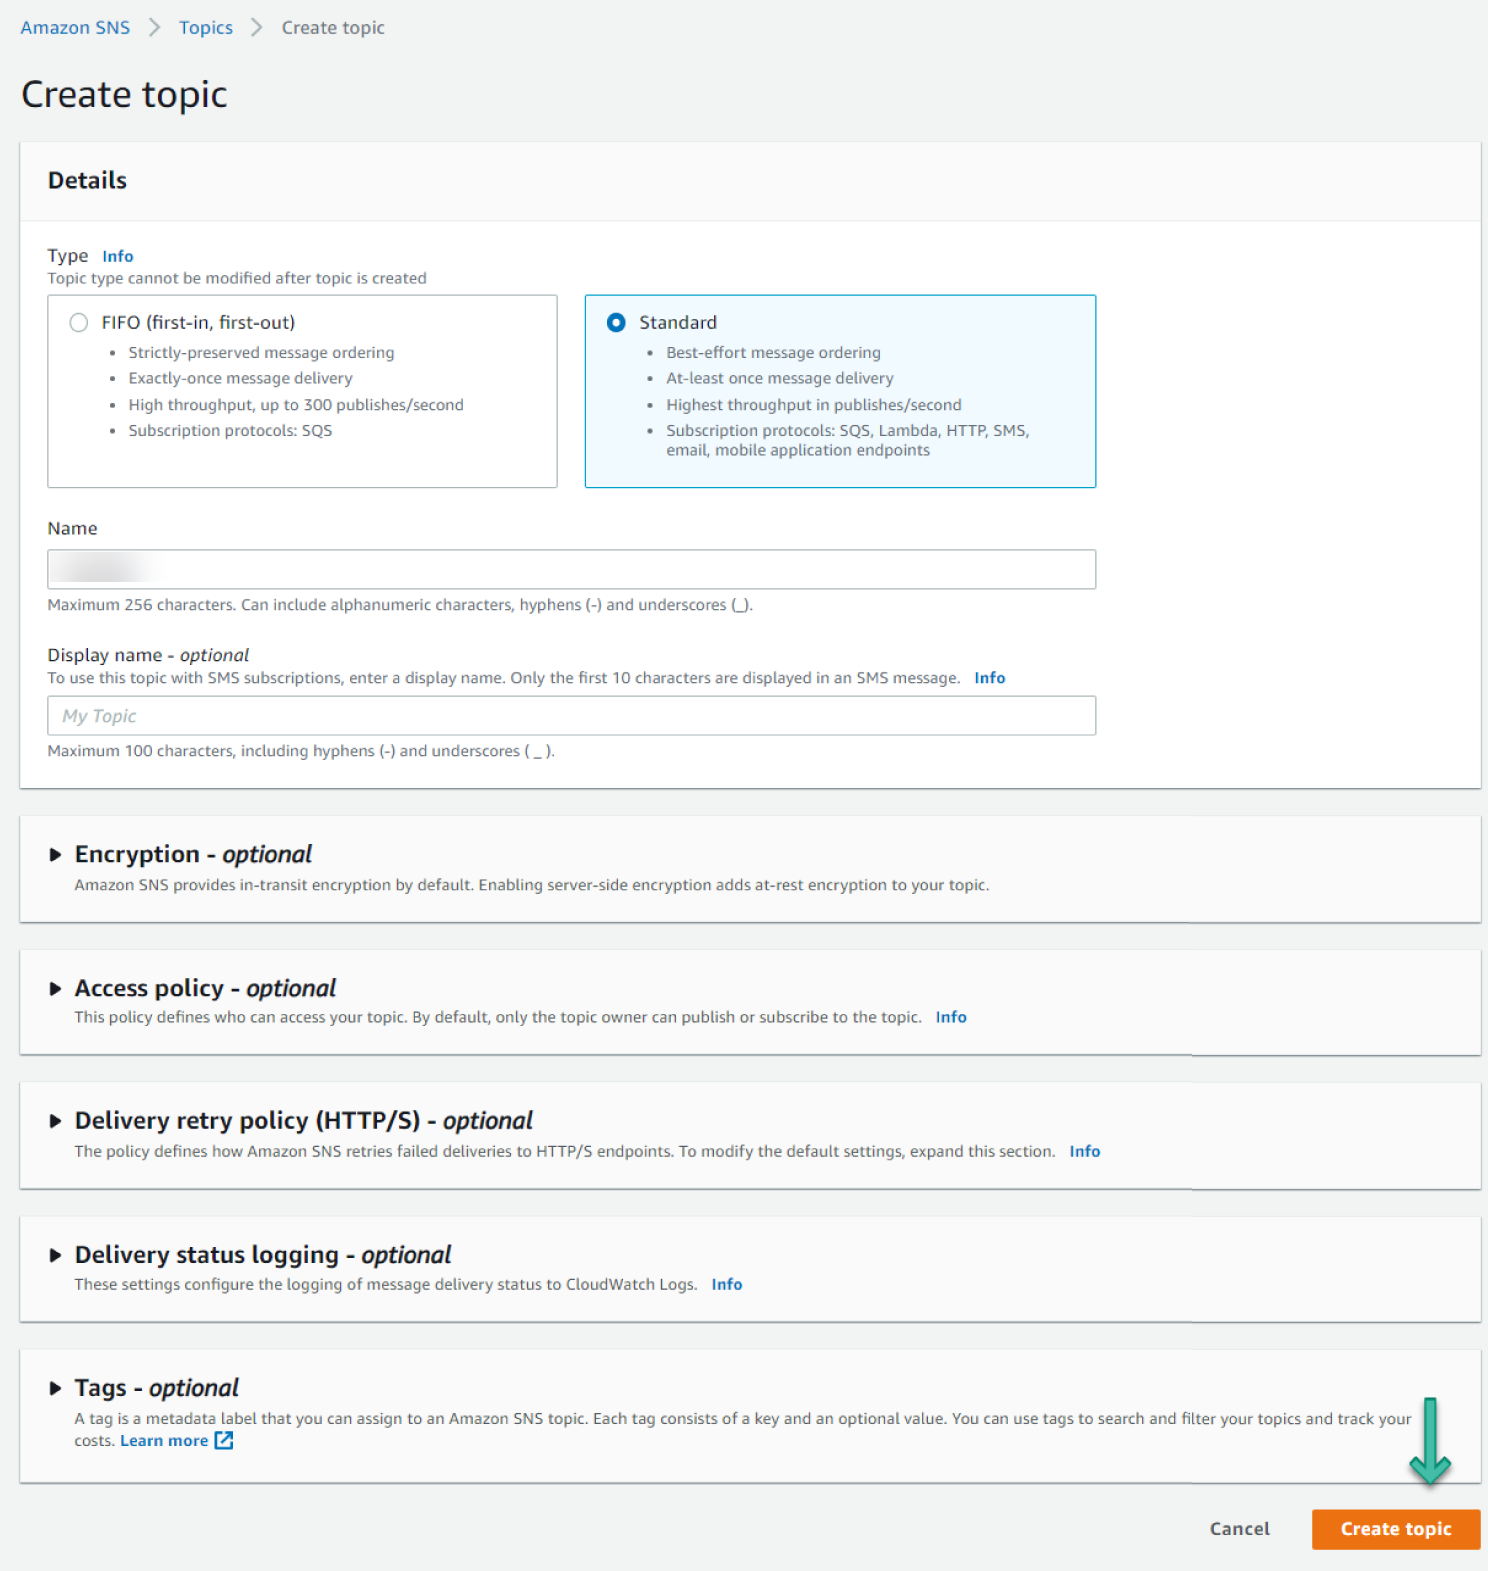
Figure 6.64: Create Topic screen
- Click Create Subscription. See Figure 6.65.
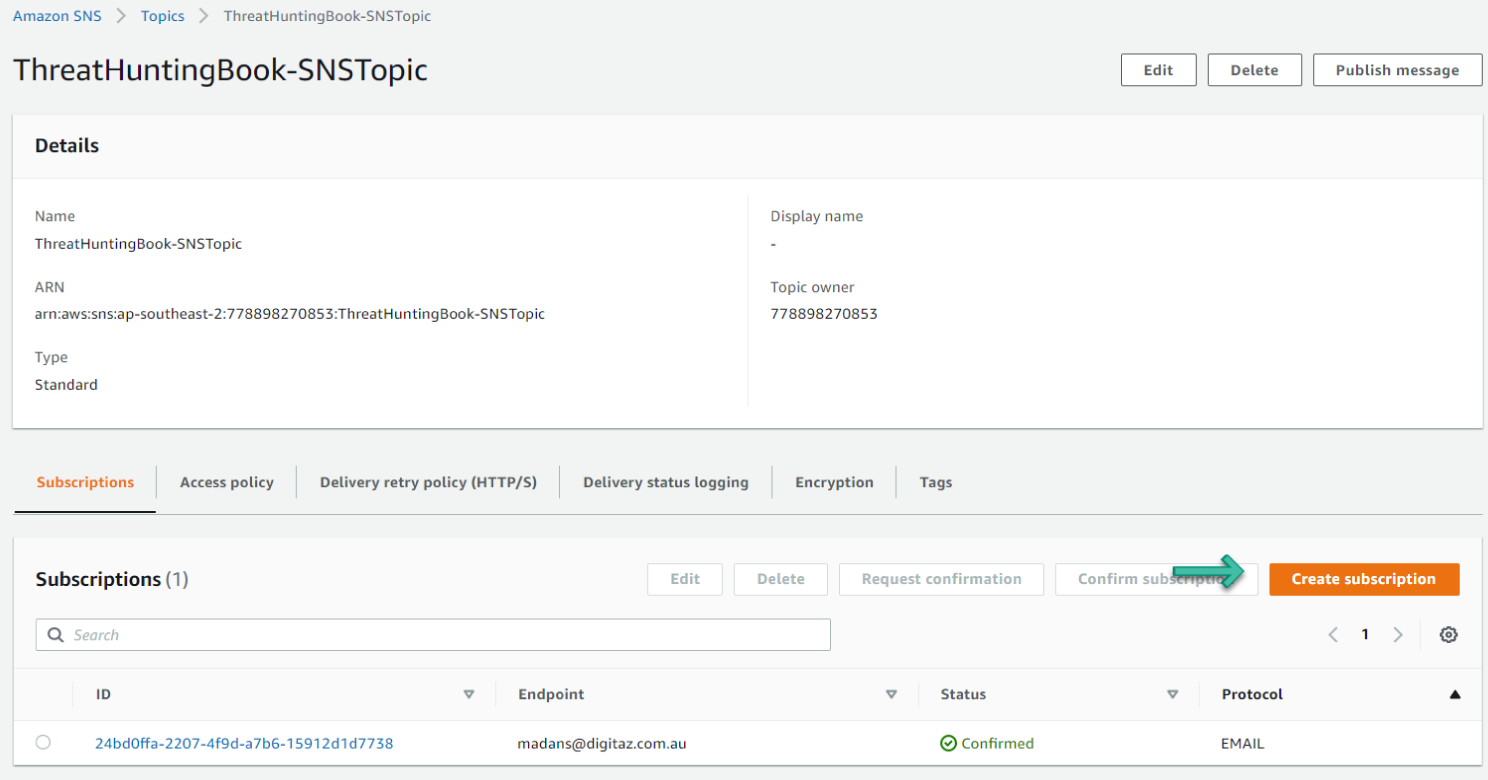
Figure 6.65: Create SNS Subscription screen
- Set the Protocol to Email and provide an email address for Endpoint. See Figure 6.66.
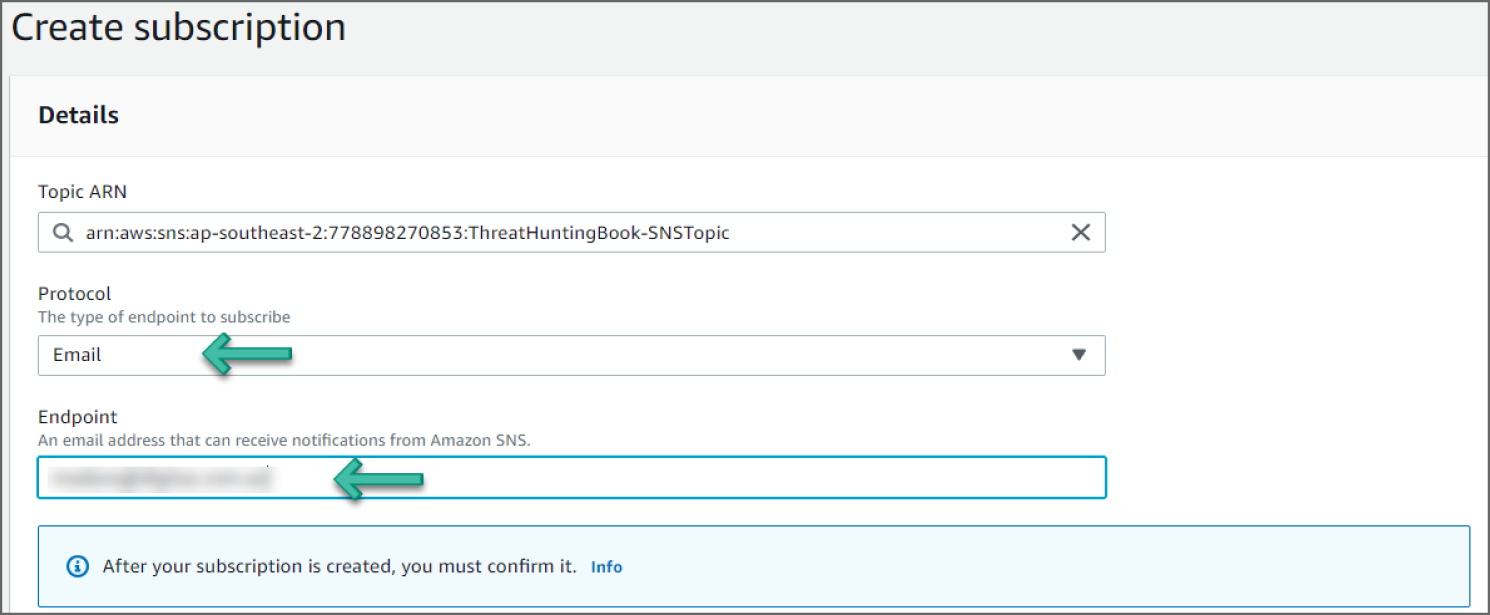
Figure 6.66: Create Subscription screen
- Scroll down and click Create Subscription. The status of the subscription will be Pending Confirmation.
- Log in to your email and click the Confirm Subscription hyperlink. You should get a success message. If you go back to the subscription in the AWS console, the status should be Confirmed.
Creating Rules in Amazon EventBridge
- Go to the EventBridge service in the console.
- Click Create rule in the dashboard. See Figure 6.67.
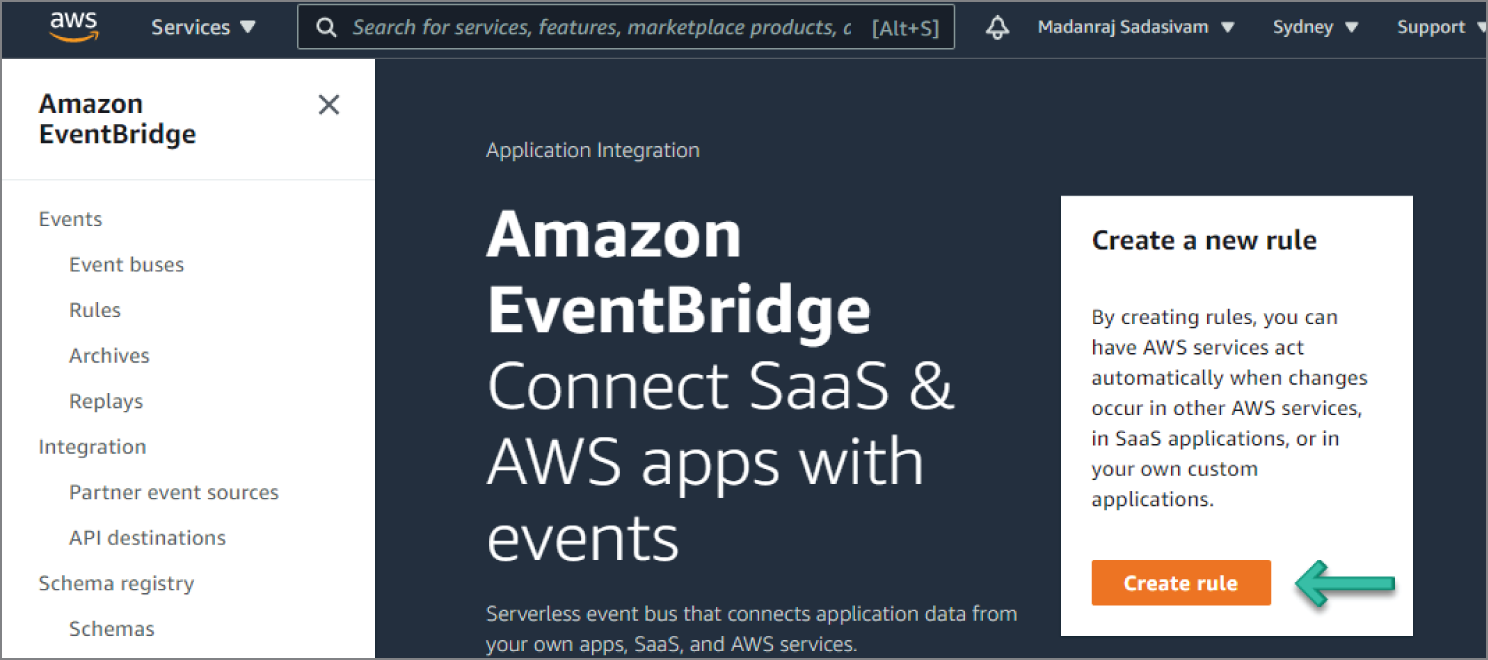
Figure 6.67: EventBridge screen
- Set a meaningful name for the rule name and optionally provide a description. See Figure 6.68.
- Under Define Pattern, select Event Pattern. This will enable options for an event matching pattern. Select Pre-defined pattern by service. Select AWS for Service provider, GuardDuty for Service name, and GuardDuty Finding for Event type, as illustrated in Figure 6.69.
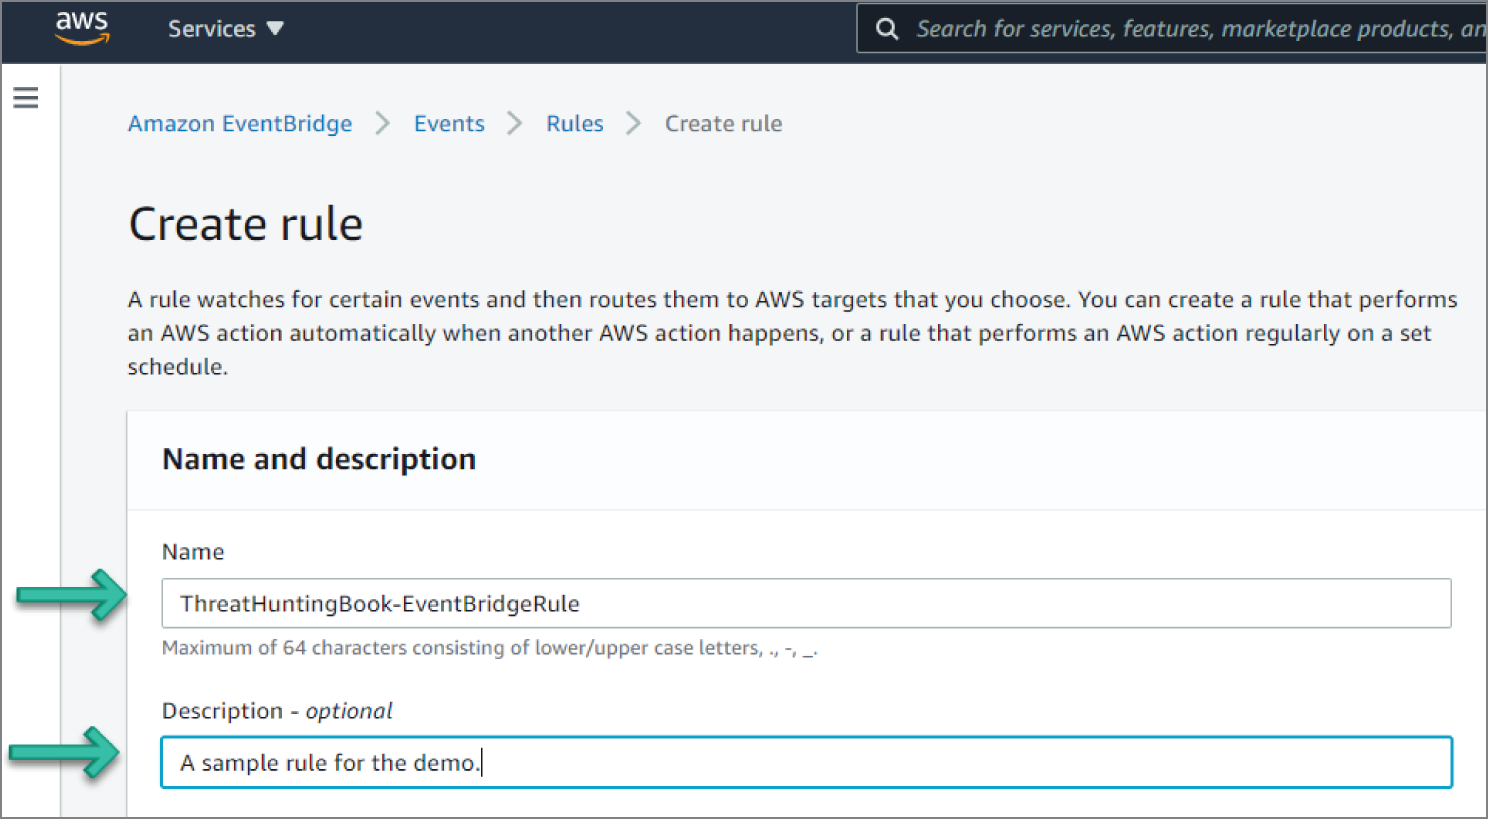
Figure 6.68: Event Create Rule screen
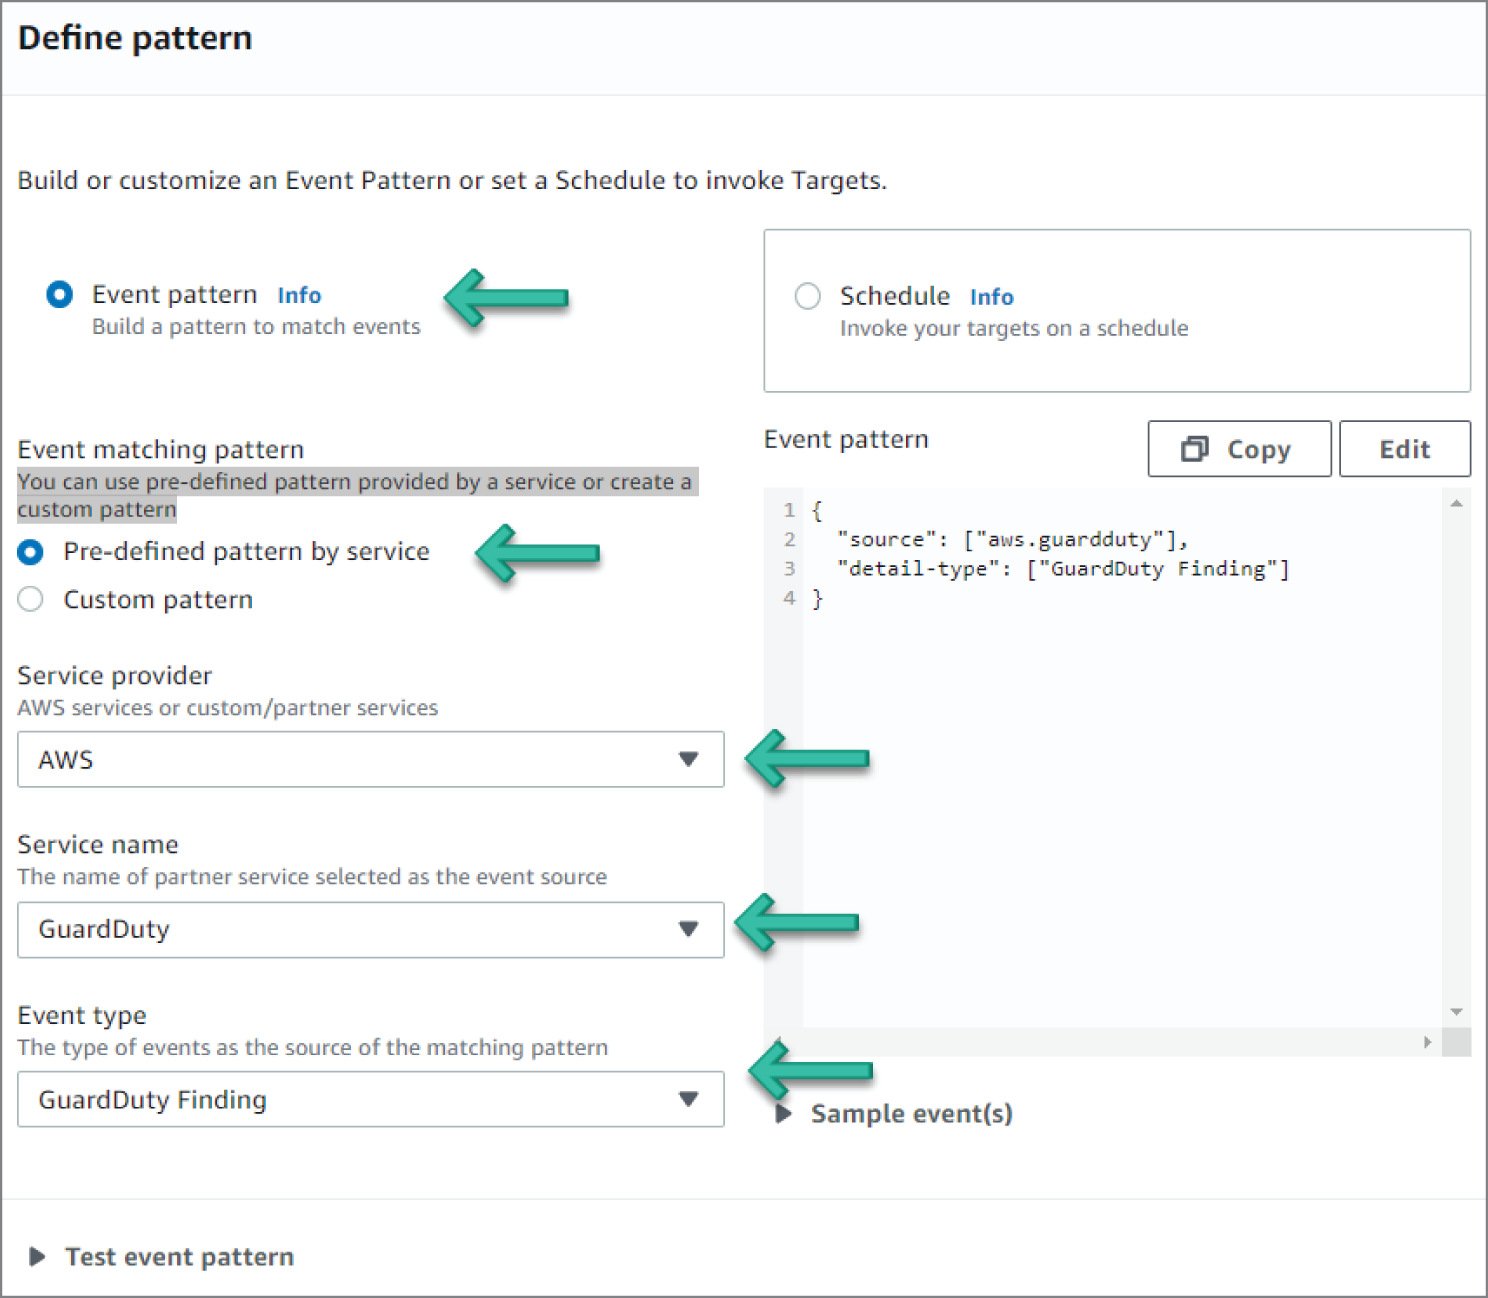
Figure 6.69: GuardDuty Settings screen
- Under Select Event Bus, select AWS Default Event Bus and Enable the Rule on the Selected Event Bus. See Figure 6.70.

Figure 6.70: Select Event Bus screen
- Under Select Targets, do the following:
- Select SNS topic from the drop-down.
- Select the SNS topic you created in the previous SNS topic section, as shown in Figure 6.71.
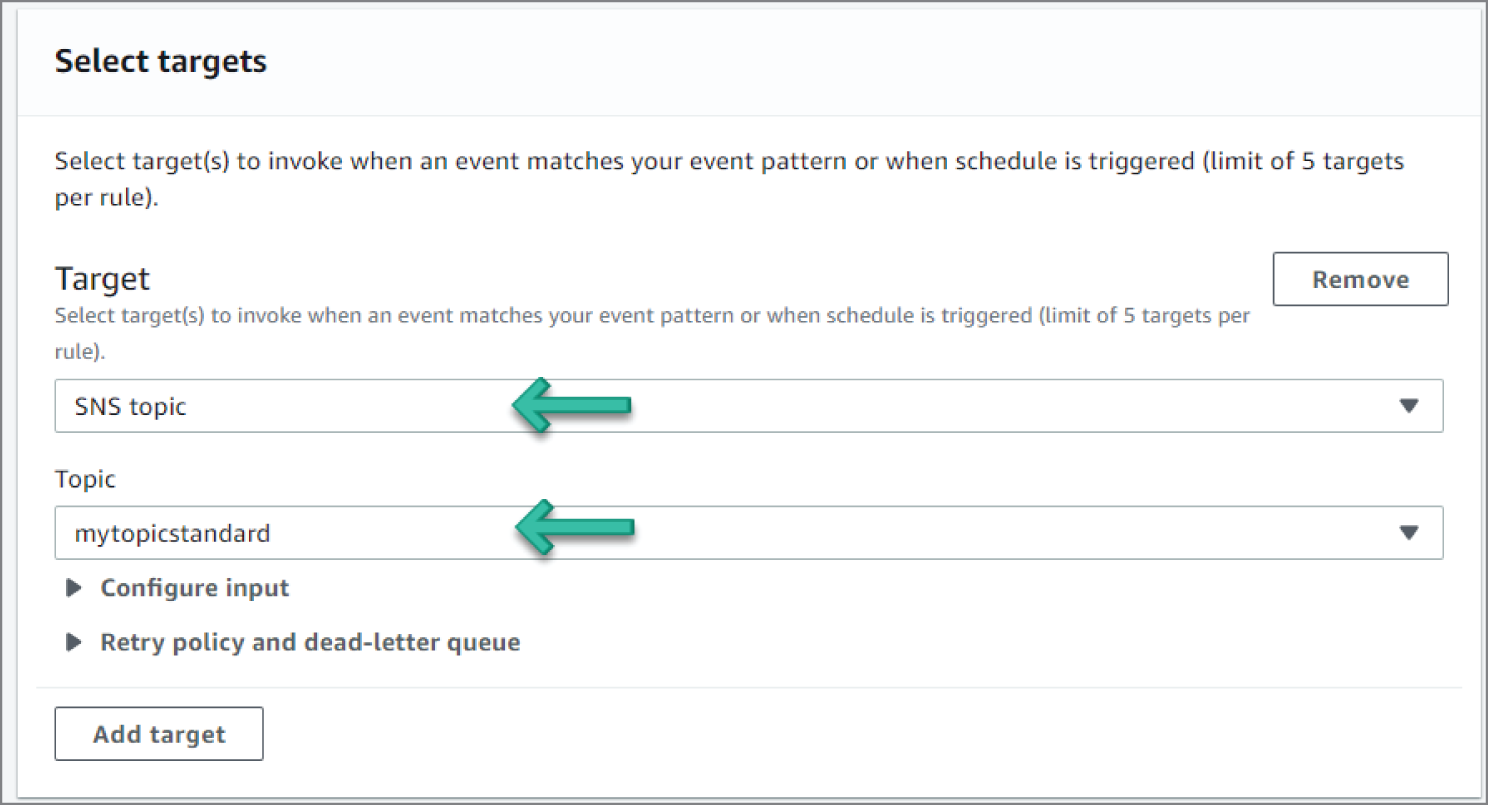
Figure 6.71: Select Targets screen
- Scroll down and click Create Rule. The rule should now appear on the Rules page. See Figure 6.72.
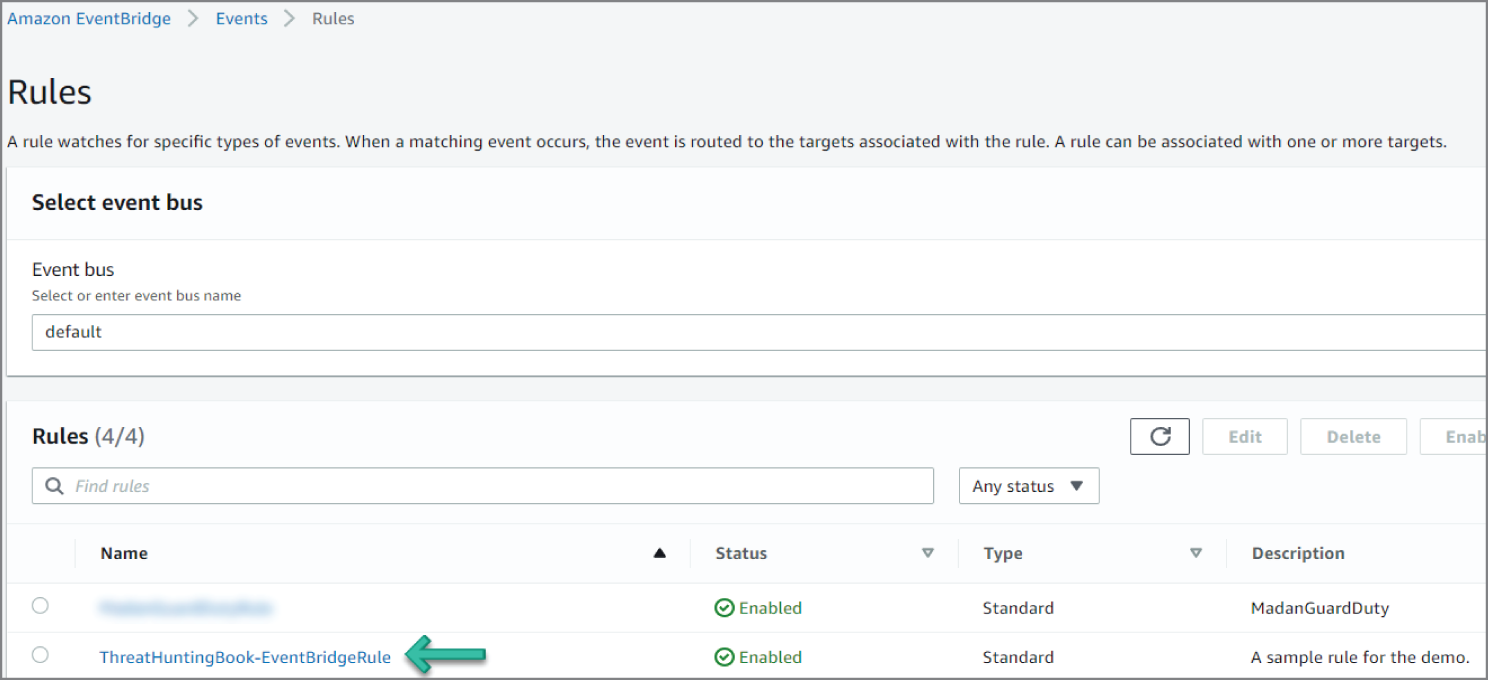
Figure 6.72: Rules screen
How Do You Orchestrate and Recover?
Once appropriate access has been provisioned and tested, your incident response team must define and prepare the related processes necessary for investigation and remediation. This stage is effort intensive, because you must sufficiently plan the appropriate response to security events within your cloud environments. Work closely with your internal cloud services teams and partners to identify the tasks required to ensure that these processes are possible. Collaborate or assign each other response activity task and ensure necessary account configurations are in place. We recommend preparing processes and prerequisite configurations in advance to give your organization the following response capabilities.
Decision Trees
Sometimes, different conditions can require different actions or steps. For example, you might take different actions based on the type of AWS account (development versus production), the tags of the resources, the AWS Config rules compliance status of those resources, or other inputs. To support you in the creation and documentation of these decisions, we recommend you draft a decision tree with your other teams and stakeholders. Similar to a flow chart, a decision tree is a tool that can be leveraged to support decision making, helping to guide you to determine the optimal actions and outcomes based on potential conditions and inputs, including probabilities.
Use Alternative Accounts
Although responding to an event in the impacted account might be required, it is ideal to investigate data outside of the affected account. Some customers have a process for creating separate, isolated AWS account environments, using templates that preconfigure the resources they must provision. These templates are deployed through a service, such as AWS CloudFormation or Terraform, which provides an easy method to create a collection of related AWS resources and provision them in an orderly and predictable fashion.
Preconfiguring these accounts using templated mechanisms helps to remove human interactions during the initial stages of an incident and ensure the environment and resources are prepared in a repeatable and predictable manner, which can be verified by an audit. In addition, this mechanism also increases the ability to maintain security and containment of data in the forensics environment. This approach requires you to work with your cloud services and architect teams to determine an appropriate AWS account process that can be used for investigations. For example, your cloud services teams could use AWS Organizations to generate new accounts and assist you in preconfiguring those accounts using a templated or scripted method. This method of segmentation is best when you need to keep a larger organization removed from a potential threat. This segmentation, of a new and largely unconnected AWS account, means that a user from the organization, labeled in multi-account documentation as the security Organizational Unit (OU), is able to move into the account, perform the needed forensics activities, and potentially hand off the account as a whole to a legal entity, if needed. This method of forensics and attribution requires significant review and planning and should match with the enterprise's GRC policies. Although this work is not easy, it is far easier to do this work prior to building a large account base.
View or Copy Data
Responders require access to logs or other evidence to analyze and must ensure that they have the ability to view or copy data. At a minimum, the IAM permission policy for the responders should provide read-only access so that they can investigate. To enable appropriate access, you might consider some pre-built AWS Managed Policies, such as SecurityAudit or ViewOnlyAccess. For example, responders might want to make a point-in-time copy of data, such as the AWS CloudTrail logs, from an Amazon S3 bucket in one account to an Amazon S3 bucket in another account. The permissions provided by the ReadOnlyAccess managed policy, for example, enable the responder to perform these actions.
Sharing Amazon EBS Snapshots
Many customers use Amazon Elastic Block Store (Amazon EBS) snapshots as part of their investigation for security events that involve their Amazon EC2 instances. Snapshots of Amazon EBS volumes are incremental backups. To perform an investigation of an Amazon EBS volume in a separate, isolated account, you must modify the permissions of the snapshot to share it with the AWS accounts that you specify. Users that you have authorized can use the snapshots you share as the basis to create their own EBS volumes, while your original snapshot remains unaffected. If your snapshot is encrypted, you must also share the custom KMS Customer Managed Key (CMK) used to encrypt the snapshot. You can apply cross-account permissions to a custom CMK either when it is created or at a later time. Snapshots are constrained to the region in which they were created, but you can share a snapshot with another region by copying the snapshot to that region.
Sharing Amazon CloudWatch Logs
Logs that are recorded within Amazon CloudWatch Logs, such as Amazon VPC flow logs, can be shared with another account (such as your centralized security account) through a CloudWatch Logs subscription. For example, the log event data can be read from a centralized Amazon Kinesis stream to perform custom processing and analysis. Custom processing is especially useful when you collect logging data from across many accounts. Ideally, create this configuration early in your cloud journey, before a security-related event occurs.
Use Immutable Storage
When copying logs and other evidence to an alternative account, make sure that the replicated data is protected. However, in addition to protecting the secondary evidence, you must protect the integrity of the data at the source. Known as immutable storage, these mechanisms protect the integrity of your data by preventing the data from being tampered with or deleted. Using the native features of Amazon S3, you can configure an Amazon S3 bucket to protect the integrity of your data, S3 Object Lock. By managing access permissions with S3 bucket policies, configuring S3 versioning, and enabling MFA Delete, you can restrict how data can be written or read. This type of configuration is useful for storing investigation logs and evidence, and is often referred to as write once, read many (WORM).
You can also protect the data by using server-side encryption with AWS Key Management Service (KMS) and verifying that only appropriate IAM principals are authorized to decrypt the data. Additionally, if you want to securely keep data in a long-term storage after the investigation is completed, consider moving the data from Amazon S3 to Amazon S3 Glacier using object lifecycle policies. Amazon S3 Glacier is a secure, durable, and extremely low-cost cloud storage service for data archiving and long-term backup. It is designed to deliver 99.999999999% durability, and provides comprehensive security designed to meet your regulatory requirements. Moreover, you can protect the data in Amazon S3 Glacier by using the Amazon S3 Glacier Vault Lock, which allows you to easily deploy and enforce compliance controls for individual Amazon S3 Glacier vaults with a vault lock policy.
You can specify security controls, such as WORM, in a vault lock policy and lock the policy from future edits. Once locked, the policy can no longer be changed. Amazon S3 Glacier enforces the controls set in the vault lock policy to help achieve your compliance objectives, such as for data retention. You can deploy a variety of compliance controls in a vault lock policy using the AWS Identity and Access Management (IAM) policy language.
Launch Resources Near the Event
For responders who are new to the cloud, it can be tempting to try to conduct cloud investigations on-premises where your existing tools are located. In our experience, AWS customers who respond to incidents using cloud technologies achieve better results—isolations can be automated, copies can be made more easily, evidence is ready for analysis sooner, and the analysis can be completed faster. The best practice is to perform investigations and forensics in the cloud, where the data is, rather than attempting to transfer the data to a datacenter before you investigate. You can use the secure compute and storage capabilities of the cloud practically anywhere in the world to perform the secure response operations. Many customers choose to pre-build a separate AWS account that is ready to perform an investigation, though there might be cases where you choose to operate your analysis in the same AWS account. If your organization is expected to retain records for compliance and legal reasons, it might be prudent to maintain separate accounts for long-term storage and legal activities.
It is also a best practice to perform the investigation in the same AWS Region where the event occurred, rather than replicating the data to another AWS Region. We recommend this practice primarily because of the additional time required to transfer the data between regions. For each AWS Region you choose to operate in, make sure that both your incident response process and the responders abide by the relevant data privacy laws. If you do need to move data between AWS Regions, consider the legal implications of moving data between jurisdictions. It is generally a best practice to keep the data within the same national jurisdiction. If you believe a security event is impacting your security, identity, or communication systems, you might need to seek alternative mechanisms and access to investigate and remediate the impact. AWS offers you the ability to quickly launch new infrastructure that can be used for secure, alternate work environments.
For example, while you investigate the potential severity of the situation, you might want to create a new AWS account with the secure tools for your legal counsel, public relations, and security teams to communicate and continue working. Services such as AWS WorkSpaces (for virtual desktops), AWS WorkMail (for email), and AWS Chime (for communication) can provide your response teams, leadership, and other participants with the capabilities and connectivity they need to communicate, investigate, and remediate an issue.
Isolate Resources
In the course of your investigation, you might need to isolate resources as part of your response to a security anomaly. The intention behind isolating resources is to limit the potential impact, prevent further propagation of affected resources, limit the unintended exposure of data, and prevent further unauthorized access. As with any response, other business, regulatory, legal, or other considerations can apply. Make sure to weigh your intended actions against expected and unexpected consequences. If your cloud teams use resource tags, these tags can help you identify the criticality of the resource or the owner to contact.
Launch Forensic Workstations
Some of your incident response activities might include analyzing disk images, file systems, RAM dumps, or other artifacts that are involved in an incident. Many customers build a customized forensic workstation that they can use to mount copies of any affected data volumes (known as EBS snapshots). To do so, follow these basic steps:
- Choose a base Amazon Machine Image (AMI) (such as Linux or Windows) that can be used as a forensic workstation.
- Launch an Amazon EC2 instance from that base AMI.
- Harden the operating system, remove unnecessary software packages, and configure relevant auditing and logging mechanisms.
- Install your preferred suite of open source or private toolkits, as well as any vendor software and packages you need.
- Stop the Amazon EC2 instance and create a new AMI from the stopped instance.
- Create a weekly or monthly process to update and rebuild the AMI with the latest software patches.
After the forensic system is provisioned using an AMI, your incident response team can use this template to create a new AMI to launch a new forensic workstation for each investigation. The process for launching the AMI as an Amazon EC2 instance can be preconfigured to simplify the deployment process. For example, you can create a template of the forensic infrastructure resources you need within a text file and deploy it into your AWS account utilizing AWS CloudFormation. When your resources are available to be deployed quickly from a template, your well-trained forensic experts are able to use new forensic workstations for each investigation, instead of reusing infrastructure. With this process, you can make sure that there is no cross-contamination from other forensic examinations.
Instance Types and Locations
Amazon EC2 provides a wide selection of instance types that are optimized for different use cases. Instance types comprise varying combinations of CPU, memory, storage, and networking capacity, and give you the flexibility to choose the appropriate mix of resources for your applications. Each instance type includes one or more instance sizes, which enables you to scale your resources to the requirements of your target workload. For incident response instances, follow your company's GRC policies for location and segmentation from the network that runs production instances. AWS enhanced networking uses single root I/O virtualization (SR-IOV) to provide high-performance networking capabilities on supported instance types. SR-IOV is a method of device virtualization that provides higher I/O performance and lower CPU utilization when compared to traditional virtualized network interfaces. Enhanced networking provides higher bandwidth, higher packet per second (PPS) performance, and consistently lower inter-instance latencies. There is no additional charge for using enhanced networking.
How Do You Automatically Recover from Unintended Disabling of CloudTrail Logging?
Figure 6.73 and the following walkthrough describe an automated remediation for a simulated event that indicates potential unauthorized activity—the unintended disabling of CloudTrail logging. Outside parties might want to disable logging to prevent detection and recording of their unauthorized activity. The standard response is to immediately notify the security contact.
Amazon GuardDuty generates the finding Stealth:IAMUser/CloudTrailLoggingDisabled when CloudTrail logging is disabled, and AWS Security Hub collects findings from GuardDuty using the standardized finding format mentioned earlier.
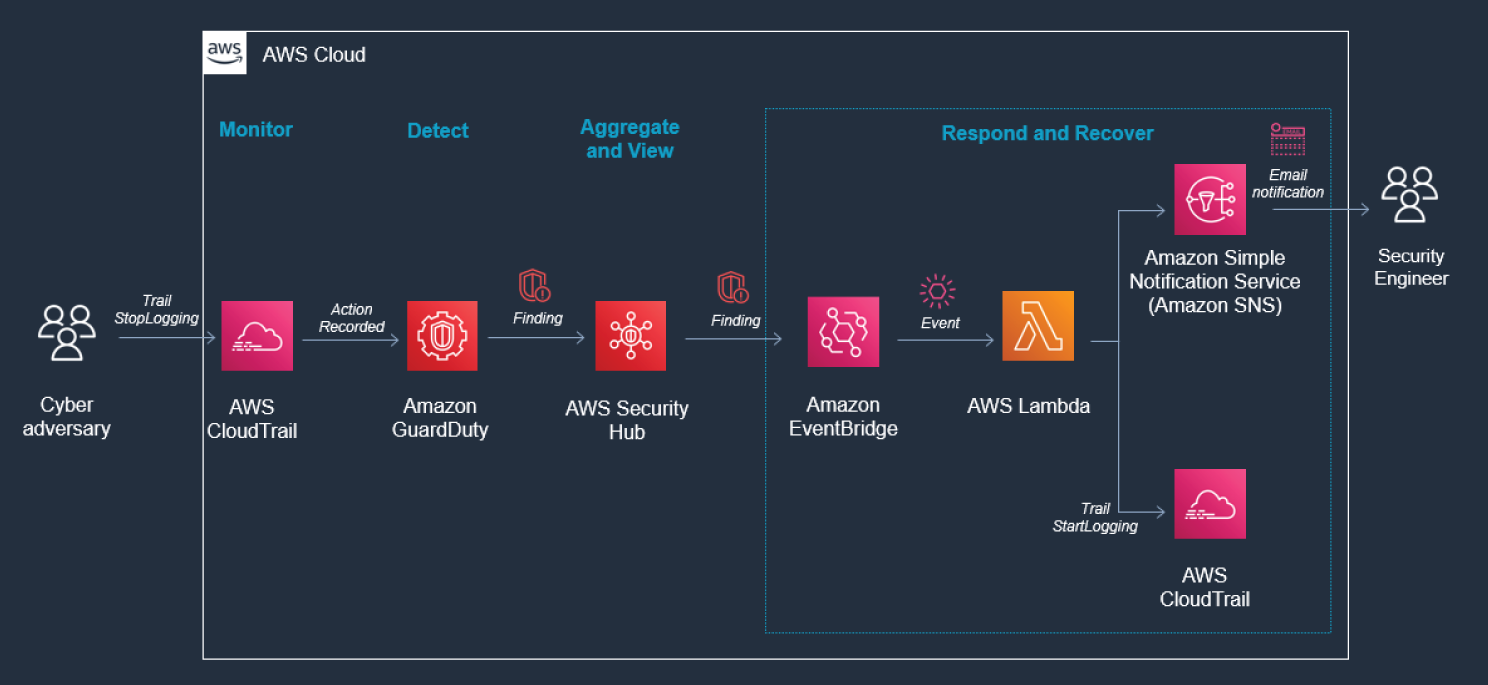
Figure 6.73: GuardDuty screen
CloudTrail logs are monitored for undesired activities. For example, if a trail is stopped, there will be a corresponding log record. GuardDuty detects this activity and retrieves additional data points about the source IP that executed the API call. Two common examples of those additional data points in GuardDuty findings include whether the API call came from an IP address on a threat list, or whether it came from a network not commonly used in your AWS account. The finding is imported into AWS Security Hub, where it's aggregated with other findings for analyst viewing. Using EventBridge and SNS, you can configure AWS Security Hub to notify the security engineer.
Prerequisites
To use AWS Security Hub, you need an AWS account. If you don't have an account, visit https://aws.amazon.com and choose Create an AWS Account.
As a best practice, you should also create an AWS Identity and Access Management (IAM) user with administrator permissions and use that for all work that does not require root credentials.
Configure and enable GuardDuty. Refer to the section entitled “How Do You Detect Privilege Escalation” earlier in this chapter for further details.
Create a trail in CloudTrail and an SNS topic to send emails. Refer to the section entitled “How Do You Create an Automated Response?” in this chapter for details.
Aggregate and View Security Status in AWS Security Hub
In the following walkthrough you will learn to set up and use AWS Security Hub. Security Hub makes use of findings from services such as Config, GuardDuty, Macie, and Inspector to provide a central view from which to manage security alerts and automate compliance checks.
- Go to the Security Hub service in the console. If you are using Security Hub for the first time, you should see a Getting started landing page with a Go to Security Hub button.
- Click Go to Security Hub. You should see the Welcome to AWS Security Hub page with the Enable Security Hub option, and a list of services with Service Linked Roles (SLRs) for conducting compliance checks and permissions for importing findings.
- Click Enable Security Hub. You should see a screen with sections for Summary, Compliance standards, and Insights. The Summary section has tabs for Insights and Latest findings from AWS integrations. It may take some time for the findings to get updated. See Figure 6.74.
- Click Findings from the left sidebar to go to the Findings page, where you can see the list of findings across service integrations. You can filter the list based on various criteria, such as the service that exported the finding or the severity of the finding. See Figure 6.75.
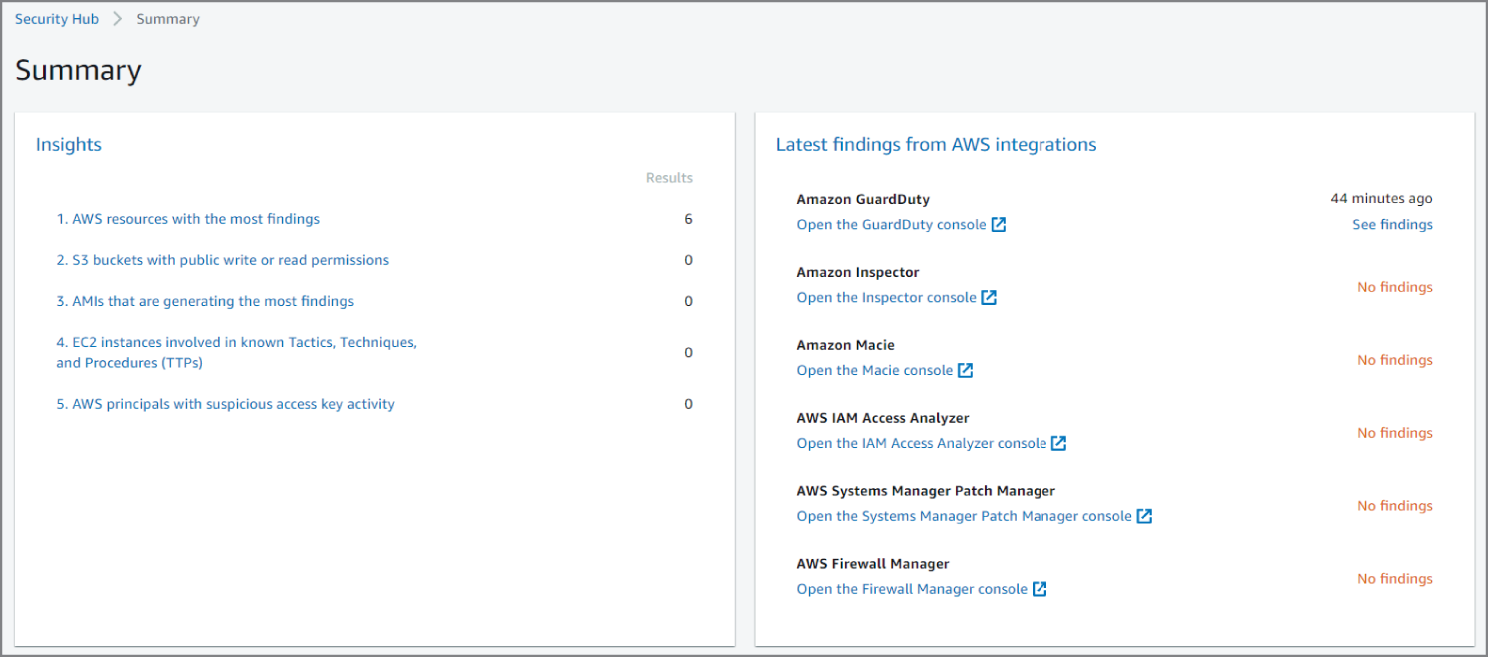
Figure 6.74: Summary screen
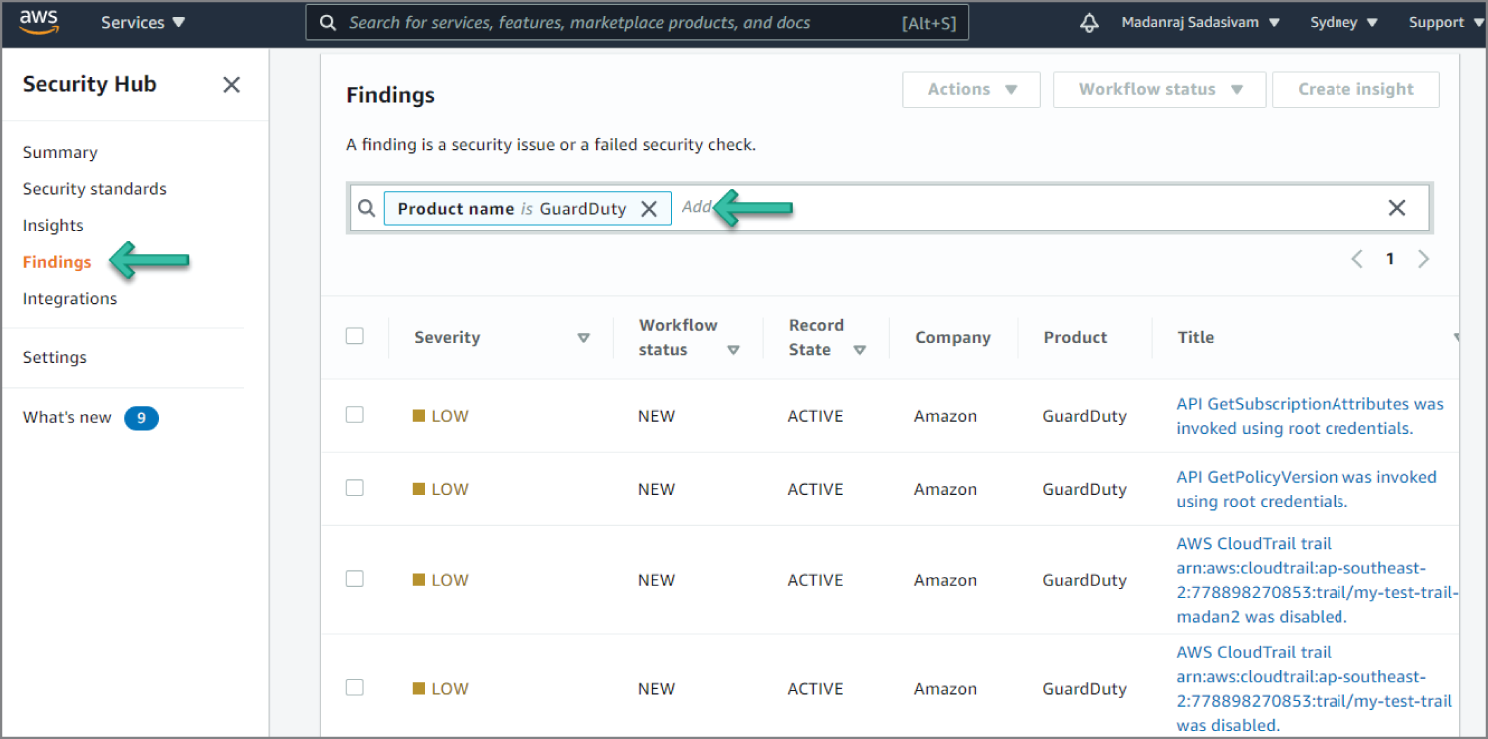
Figure 6.75: Findings screen
Reviewing the Findings
In the example shown in Figure 6.76, you see a Stealth:IAMUser/CloudTrailLoggingDisabled finding. This finding informs you that a CloudTrail trail within your AWS environment was disabled. This can be an attacker's attempt to disable logging to cover their tracks by eliminating any trace of their activity while gaining access to your AWS resources for malicious purposes. This finding can be triggered by a successful deletion or update of a trail. This finding can also be triggered by a successful deletion of an S3 bucket that stores the logs from a trail that is associated with GuardDuty.
Looking at the information in this finding, you see the severity as LOW, meaning it's something to check but not especially concerning. Now if you see many of these events back to back, there is room for concern, as it could mean a potential bad actor. You can see the account ID this event occurred in and the AWS Resource against which this activity took place. Moving down, you see the Types and Related Findings. Moving down again, you can see AWS resource that was targeted by the trigger activity.
Moving down again, you see the option to investigate in Amazon Detective.
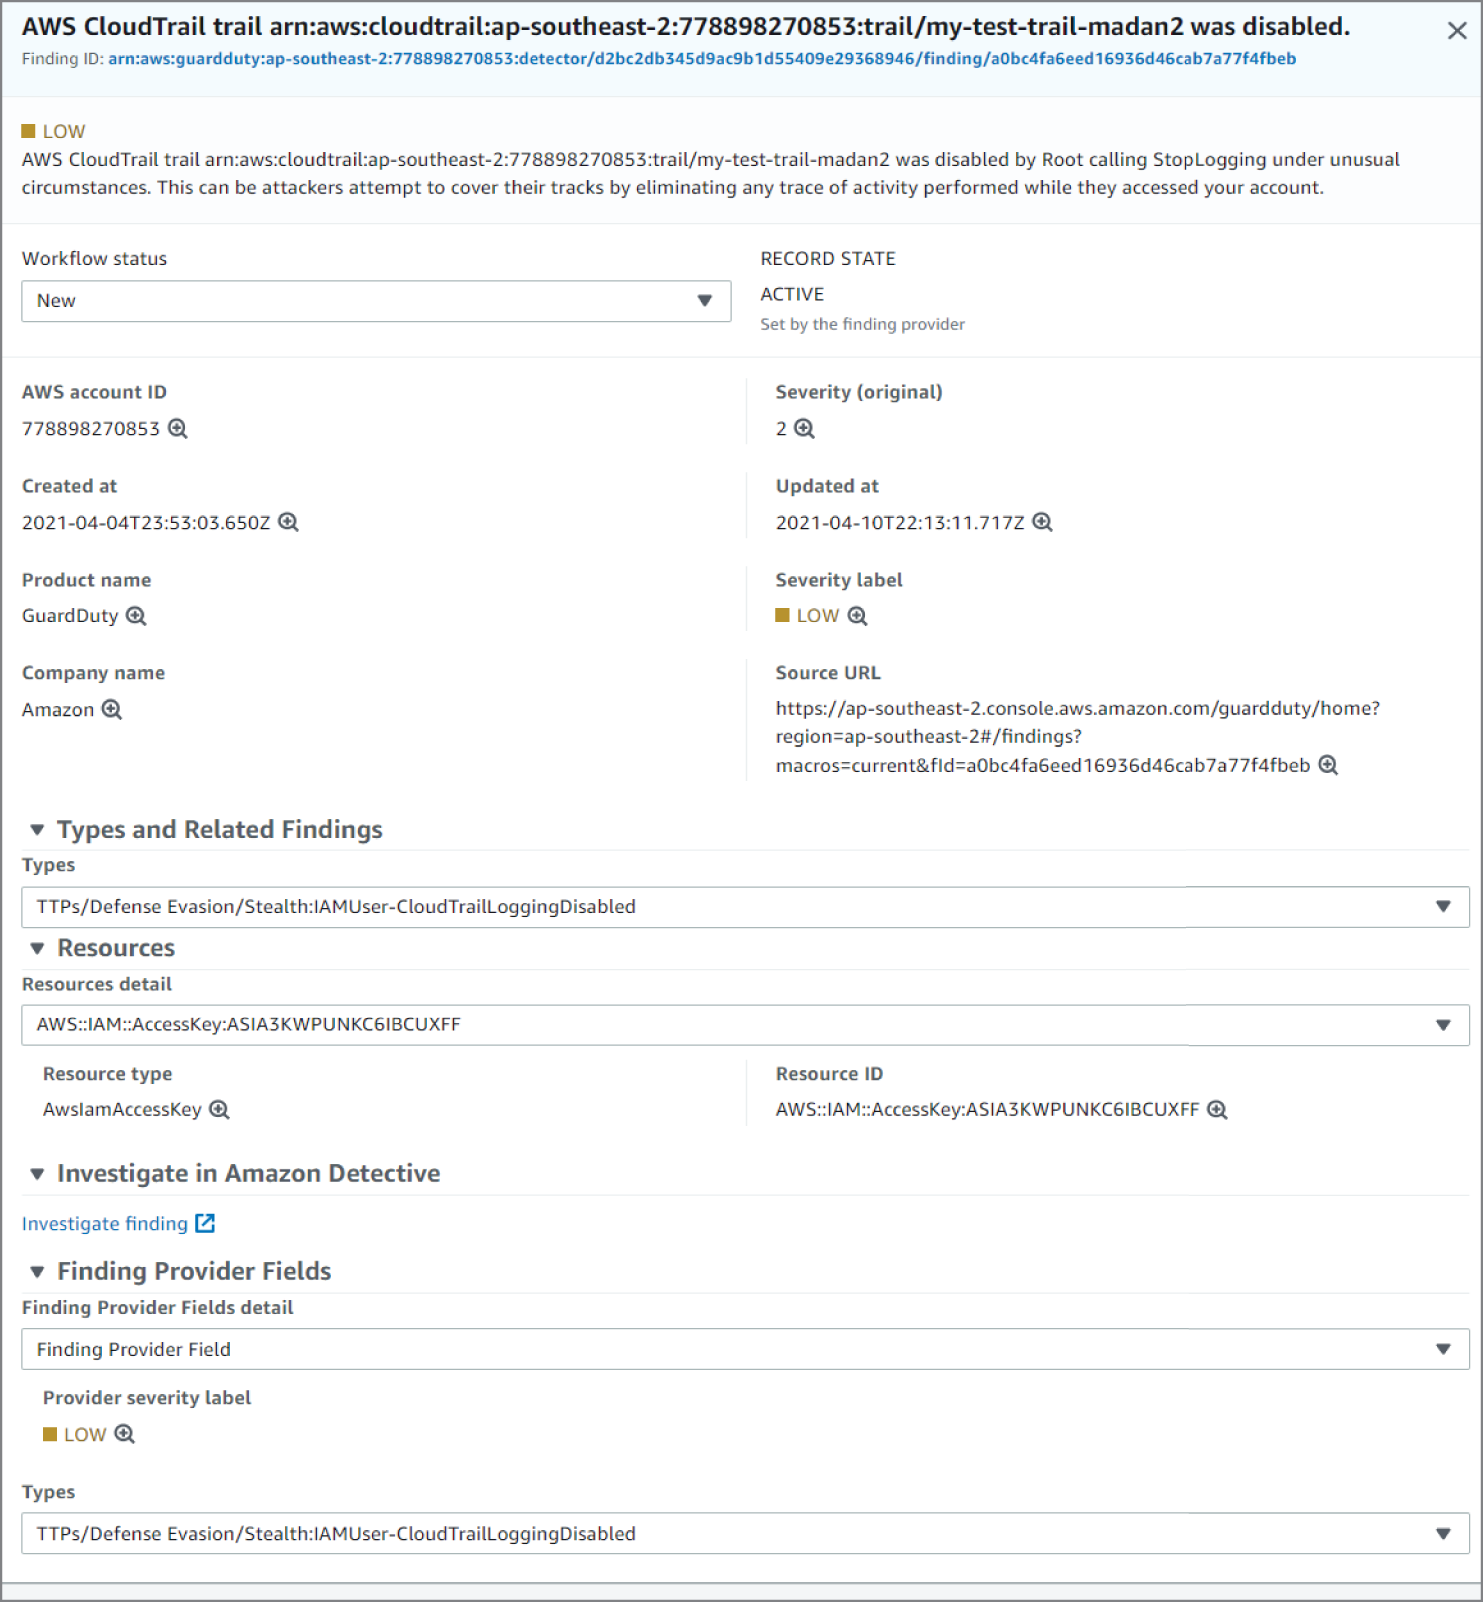
Figure 6.76: CloudTrailLoggingDisabled screen
Create Lambda Function to Orchestrate and Recover
- Go to the Lambda service in the console and click Create Function. See Figure 6.77.
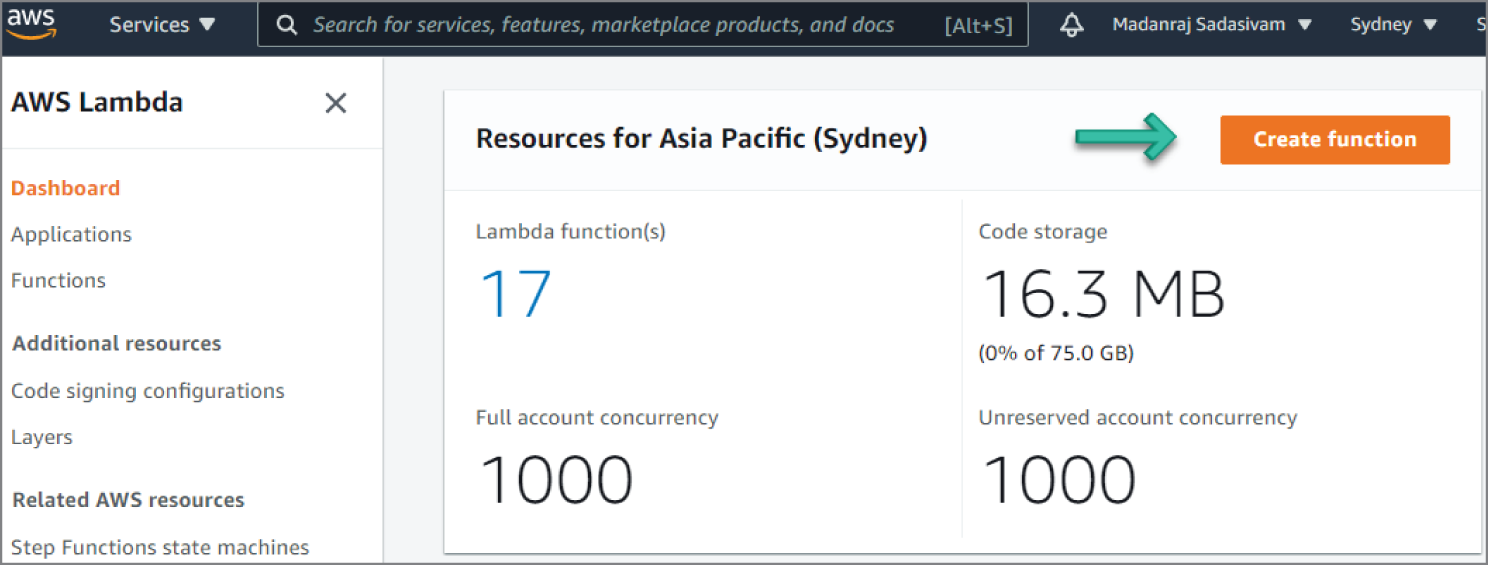
Figure 6.77: Lambda screen
- Enter a meaningful function name and choose the Python 3.7 runtime. See Figure 6.78.
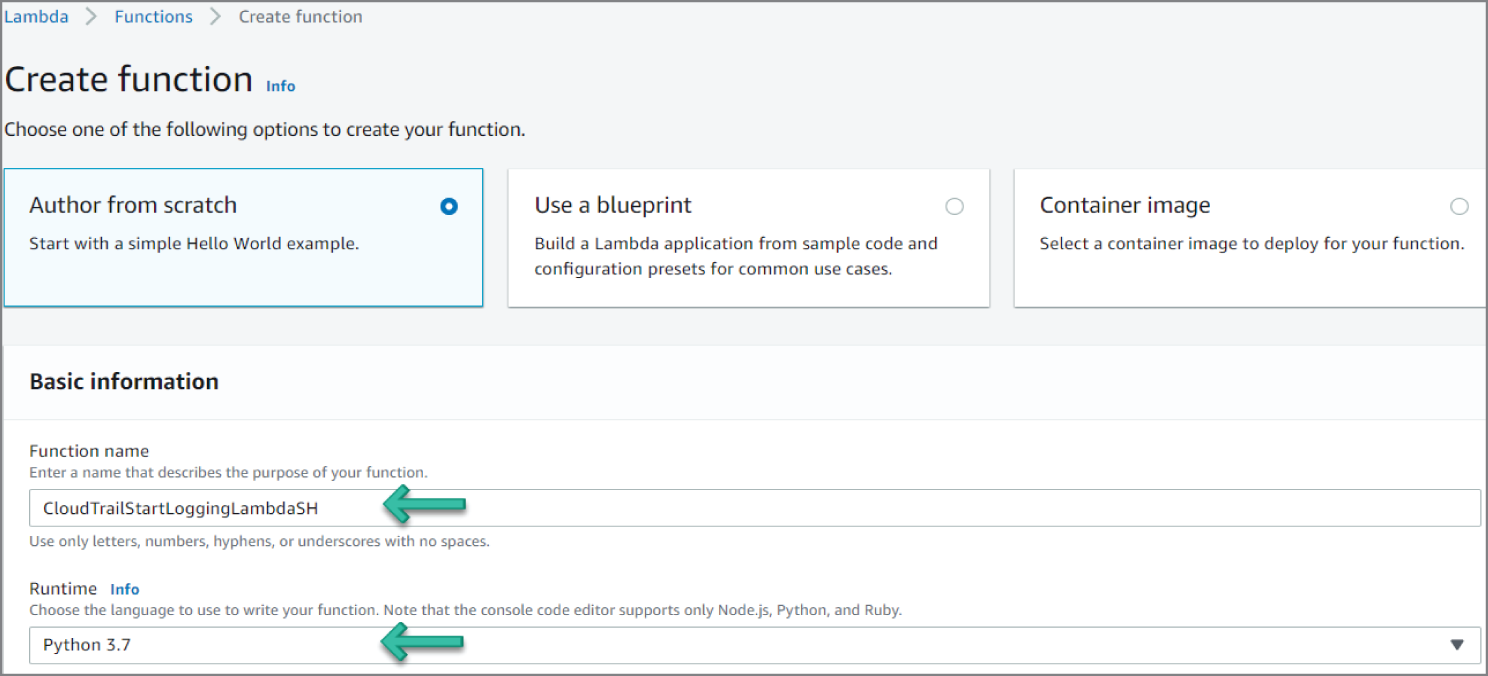
Figure 6.78: Create Function screen
- Scroll down, accept the defaults for Permissions, and then click Create Function.
- In the Lambda console, paste the following code in the Function code and select Deploy:
import boto3import loggingimport osimport botocore.sessionfrom botocore.exceptions import ClientErrorsession = botocore.session.get_session()logger=logging.getLogger(__name__)logger.setLevel(logging.INFO)snsARN = os.environ['SNSTOPIC']def get_cloudtrail_status(trailname):client = boto3.client('cloudtrail')response = client.get_trail_status(Name=trailname)if response['ResponseMetadata']['HTTPStatusCode'] == 200:response = response['IsLogging']logger.info("Status of CloudTrail logging for %s - %s" % (trailname, response))else:logger.error("Error gettingCloudTrail logging status for %s - %s" % (trailname, response))return responsedef enable_cloudtrail(trailname):client = boto3.client('cloudtrail')response = client.start_logging(Name=trailname)if response['ResponseMetadata']['HTTPStatusCode'] == 200:logger.info("Response on enable CloudTrail logging for %s - %s" % (trailname, response))else:logger.error("Error enabling CloudTrail logging for %s - %s" % (trailname, response))return responsedef notify_admin(topic, description):snsclient = boto3.client('sns')response = snsclient.publish(TargetArn = topic,Message = "CloudTrail logging state change detected. Event description: "%s" " %description,Subject = 'CloudTrail Logging Alert')if response['ResponseMetadata']['HTTPStatusCode'] == 200:logger.info("SNS notification sent successfully - %s" %response)else:logger.error("Error sending SNS notification - %s" %response)return response# Lambda entry pointdef handler(event, context):logger.setLevel(logging.INFO)logger.info("Starting automatic CloudTrail remediation response")trailARN = event['detail']['findings'][0]['ProductFields']['action/awsApiCallAction/affectedResources/AWS::CloudTrail::Trail']description = event['detail']['findings'][0]['Description']region = event['detail']['findings'][0]['Resources'][0]['Region']logger.debug("Event is-- %s" %event)logger.debug("trailARN is--- %s" %trailARN)logger.debug("snsARN is-- %s" %snsARN)try:response = enable_cloudtrail(trailARN)status = get_cloudtrail_status(trailARN)if response['ResponseMetadata']['HTTPStatusCode'] == 200:message = "CloudTrail logging status for trail - " + trailARN + ": " + str(status) + " " + str(description) + " " +"Review additional information in Security Hub - https://console.aws.amazon.com/securityhub/home?region=" + region + "#/findings"notify_admin(snsARN, message)logger.info("Completed automatic CloudTrail remediation response for %s - %s" % (trailARN, response))else:logger.error("Something went wrong - %s, %s" % (trailARN, event))except ClientError as e:message = "%s %s" % (e, event)logger.error("%s, %s" % (e, event))notify_admin(snsARN, message)
- From the Add Trigger screen, select the EventBridge and then select the existing rule that was created in the previous section. See Figure 6.79.
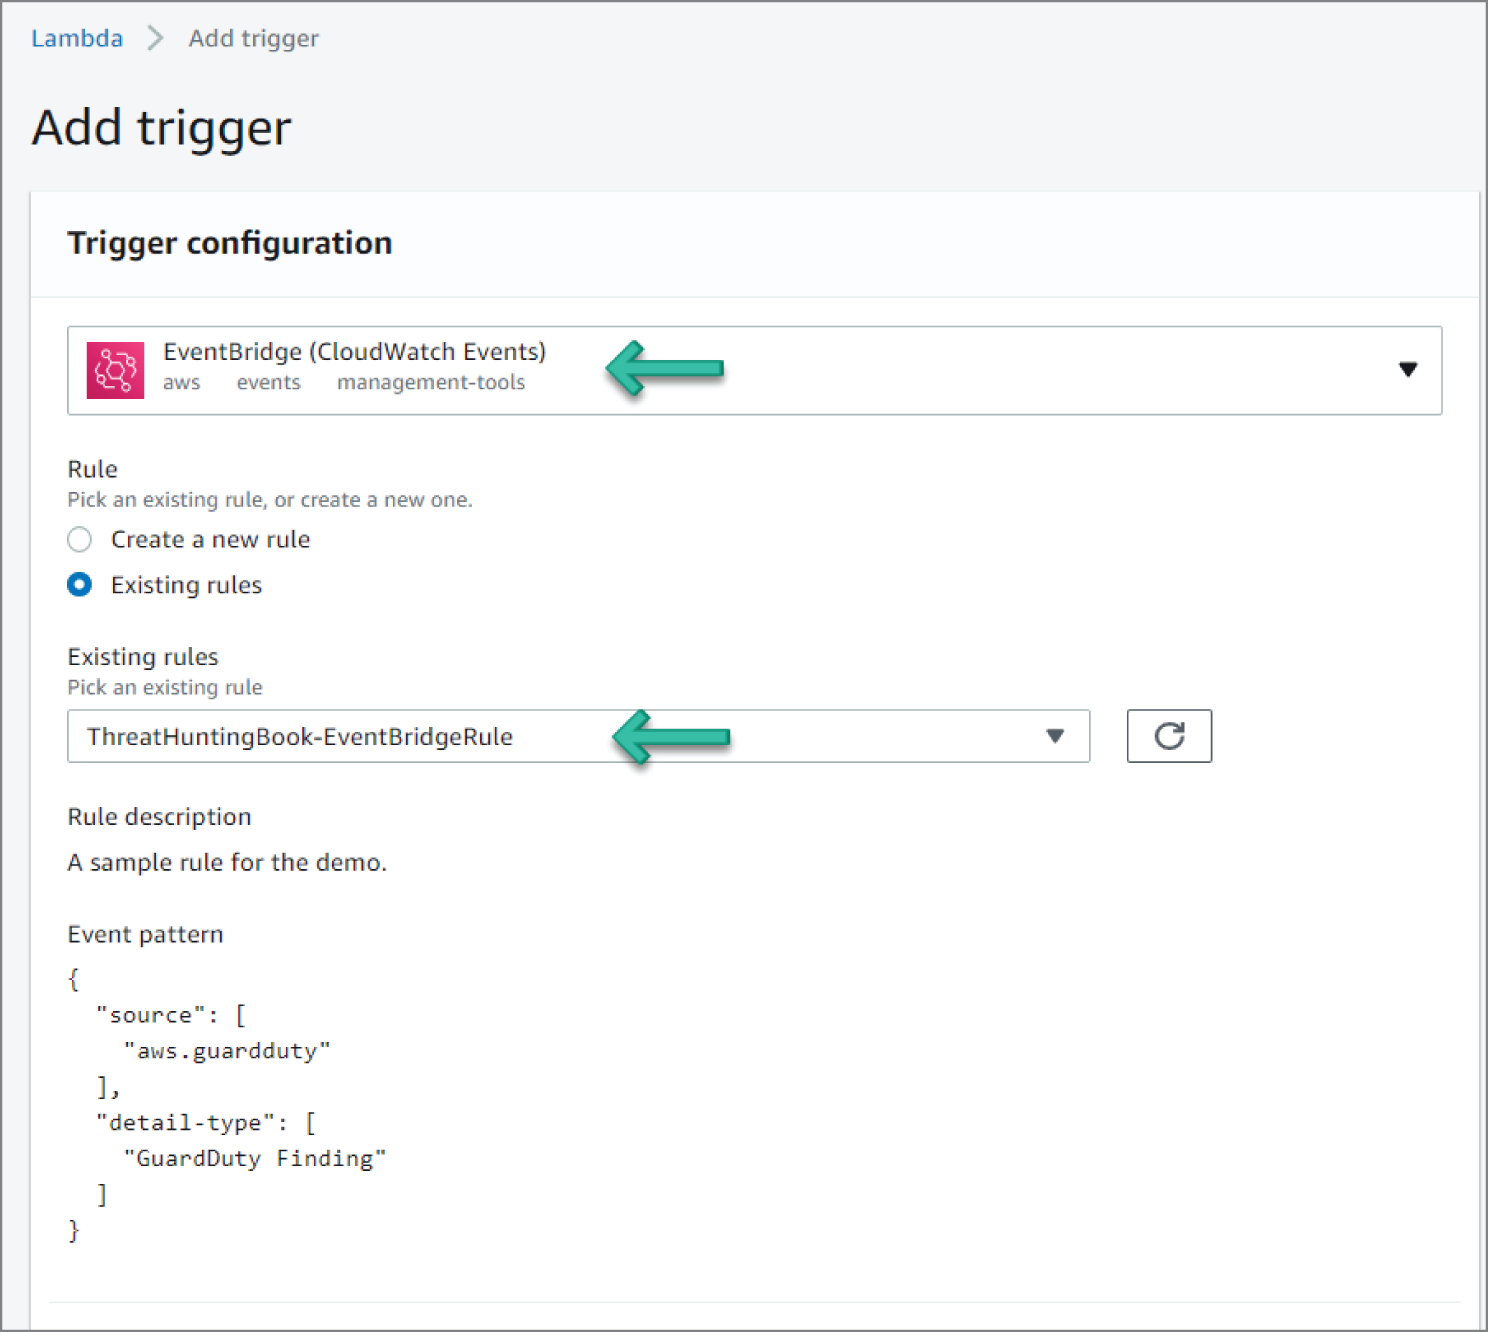
Figure 6.79: Add Trigger screen
- Go back to EventBridge Rule to confirm that the new target of Lambda is added.
How Are Machine Learning and Artificial Intelligence Used?
Amazon GuardDuty introduces a new machine learning domain reputation model that can categorize previously unseen domains as highly likely to be malicious or benign based on their behavioral characteristics. GuardDuty uses this new capability to alert customers when an EC2 instance in their AWS environment is communicating with a domain identified as malicious and to improve the accuracy of existing domain-based threat detections.
The machine learning domain reputation model analyzes domain requests based on behavioral characteristics, such as popularity, history, and whether they are associated with known malicious or cryptocurrency-related domains and IPs. There are now four new domain reputation finding types in the continuously growing threat detection library that are on by default for all Amazon GuardDuty customers:
- Impact:EC2/MaliciousDomainRequest.Reputation
- Impact:EC2/AbusedDomainRequest.Reputation
- Impact:EC2/SuspiciousDomainRequest.Reputation
- Impact:EC2/BitcoinDomainRequest.Reputation
Available globally, Amazon GuardDuty continuously monitors for malicious or unauthorized behavior to help protect your AWS resources, including your AWS accounts, access keys, and EC2 instances. GuardDuty identifies unusual or unauthorized activity, like cryptocurrency mining, access to data stored in S3 from unusual locations, or infrastructure deployments in a region that has never been used. Powered by threat intelligence, machine learning, and anomaly detection techniques to detect threats, GuardDuty is continuously evolving to help you protect your AWS environment.
Summary
- AWS leverages the five pillar Well-Architected Framework architecture and Shared Security Model concepts extensively. AWS also addresses the industry standard shared responsibility model in detail to clearly articulate customer responsibilities, AWS responsibilities, and shared responsibilities between the customers and AWS.
- Monitoring, logging, and alerting is utilized by a number of services such as CloudTrail, CloudWatch Logs, VPC Flow logs, GuardDuty, and Security Hub.
- There are multiple AWS services to facilitate credential access, lateral movement, command and control, and data exfiltration.
- Privilege escalation is primarily addressed by the AWS GuardDuty service and its configuration settings.
- GuardDuty also addresses lateral movement scenarios and how to prevent malicious activity.
- EC2 configuration and GuardDuty address command and control TTP prevention activities.
- Data exfiltration is addressed by the GuardDuty configuration settings.
- AWS provides mechanisms for automatic response and recovery.
- Machine learning and artificial intelligence are used to combat threats using the AWS ecosystem. This is achieved by key services such as GuardDuty.
References
- AWS Well-Architected Framework Whitepaper (
https://aws.amazon.com/architecture/well-architected/?wa-lens-whitepapers.sort-by=item.additionalFields.sortDate&wa-lens-whitepapers.sort-order=desc) - AWS Shared Responsibility Model (
https://aws.amazon.com/compliance/shared-responsibility-model/) - AWS Security Incident Response Guide (
https://d1.awsstatic.com/whitepapers/aws_security_incident_response.pdf) - Amazon GuardDuty introduces machine learning domain reputation model to expand threat detection and improve accuracy (
https://aws.amazon.com/about-aws/whats-new/2021/01/amazon-guardduty-introduces-machine-learning-domain-reputation-model/)