Chapter 2. Digital Transformation
The amount of data being created is simply exploding. As we move deeper into the era of digital transformation, there are many more sources of data of many different types. The majority of the data—more than 90 percent—is unstructured (e.g, email, text documents, images, audio, and video). These data types are a poor fit for relational databases and traditional storage methods. There is tremendous value in the data, but taking advantage of all of it for business insight is challenging at both the technical and semantic level.
Technical Challenges
From a technical perspective, to make use of the data, we must collect, transfer, store, and process it. The sheer volume of data presents significant challenges. Unprocessed data is useless, so compute requirements are growing in direct response to the data growth. Thus, more powerful servers (or, as it turns out, more servers working in parallel) are needed.
New data management software frameworks have been developed (Hadoop, NoSQL) that can process massive amounts of data in parallel across a large cluster of servers. These frameworks have storage services built in; for example, replication, self-healing, rebalancing, and scaling out by adding servers. Traditional systems have to rely on underlying storage arrays to provide these services. Tighter integration of storage services with the data management layer provides a lot of flexibility. For example, you can increase or decrease the number or replicas, tune the timing to start healing (in case of a disk or server failure) and even tune the level of consistency based on the application’s requirements.
From the infrastructure perspective, highly optimized platforms have been developed, made up of clusters of servers with dense internal storage interconnected using a high-speed network. These are designed to scale out and have sophisticated management and administration capabilities significantly easing the burden of managing hundreds or thousands of servers.
Looking ahead, the amount of data being generated at the edge of the network by connected devices is growing dramatically. This poses new challenges and introduces the concept of the edge- or local-context and enterprise- (data center/cloud) or global-context. In Chapter 3, we will discuss edge-to-enterprise analytics in detail.
As the increasing reliance on information technology becomes more pervasive, the underlying technologies (compute, storage, and network at the edge and enterprise) will improve in line with Moore’s Law, Amdahl’s Law and their derivatives, and my own Nambiar’s Law. The technologies available will become universal, so analytics capabilities (i.e., how well you know your business, your customers, and your partners—and how quickly you understand them) will become the core of your business. In other words, you will become data-driven—and by extension, analytics-driven.
Data Challenges
It is a nontrivial exercise to turn data into information, in large part because of what’s become known as the five “V’s” of big data: volume, variety, velocity, veracity, and value, as illustrated in Figure 2-1.
Let’s look at each of these in a bit more detail.
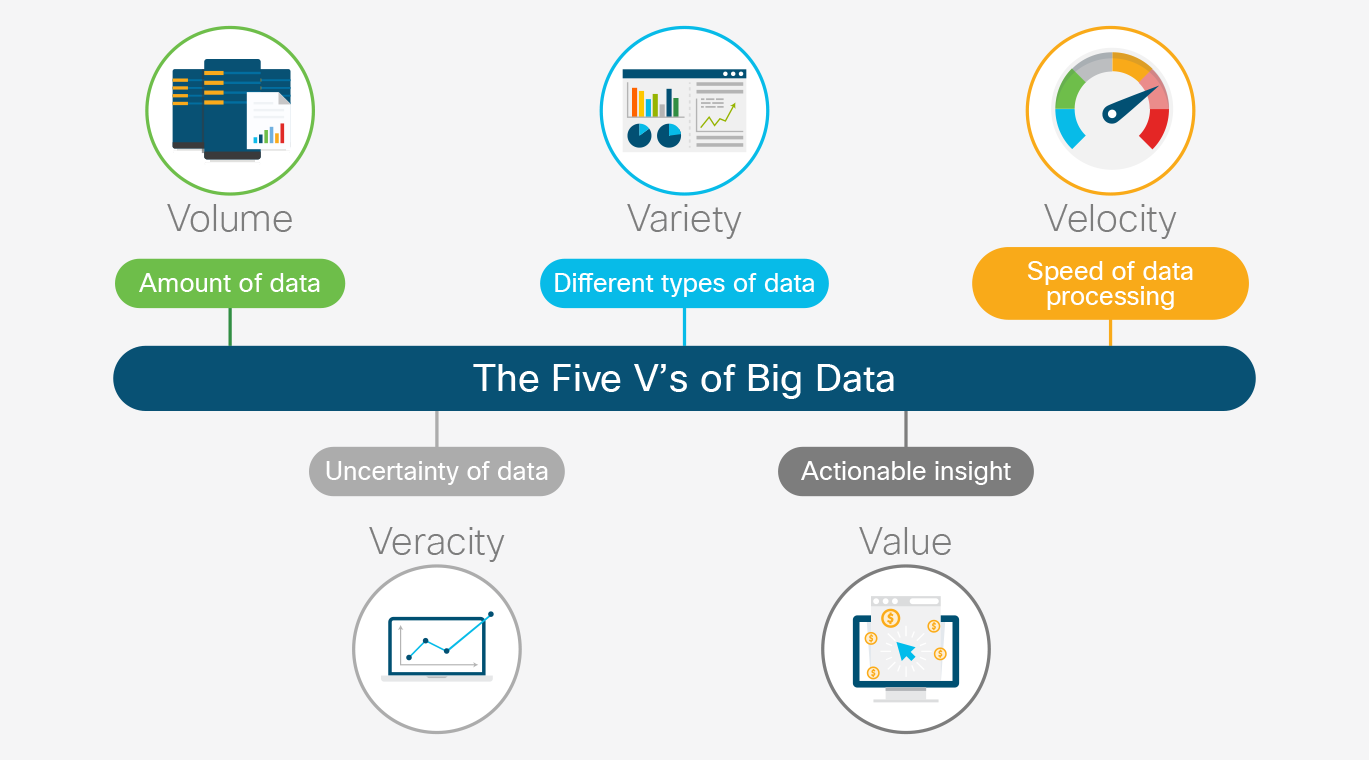
Figure 2-1. The five V’s of big data
Volume
The volume of data has grown so much that traditional relational database management software running on monolithic servers is incapable of processing it.
Variety
The variety of data has increased. Structured data has been the norm, but is no longer. Unstructured data requires new approaches to collect, store, and process it into something useful.
Our ability to process unstructured data changes the way we approach data analysis and application development. Previously, you would define your data structures and build an application to operate on the data. The lifetime of these kinds of applications was often measured in years.
Now, data is collected in its original fidelity and explored for meaningful patterns. Applications are built to take advantage of these patterns, and then rebuilt when new patterns emerge. The lifetime of the applications is much shorter: months to days.
Velocity
Velocity is the measure of how fast the data is coming in. It has to be processed, often in real time, and stored in huge volume.
Veracity
Veracity of data refers to how much you can trust it. Traditional structured data goes through a validation process during which it’s cleaned up, validated, and joined with related data. This requires that you already know a lot about the data before processing it. This approach does not work with unstructured data (as discussed in “variety”).
Value
Deriving value from the data is non-trivial, especially in light of the challenges presented by the other V’s discussed above. Much of the progress made in compute, storage, and networking, and in distributed data processing frameworks is aimed at addressing these challenges with the goal of converting data into actionable insight.
Three “I’s” of Big Data
Another way to look at the data challenge is with the three “I’s” of big data (see Figure 2-2): investment, innovation, and improvisation. Investment in collecting, analyzing, and using data is mandatory if your enterprise wants to avoid extinction, as previously discussed. Innovation is what you’re able to do, making use of previously unexplored data to provide new products and new services, and create better customer experiences. Improvisation is the ability to explore the data, find new meaning, and turn it into actionable insight in a continuous cycle.
Realizing that the data itself is as important as how it can be processed, one way to approach understanding what is happening now and what will happen in the future is to look at the different ways in which we can process and analyze the data.
In the next section, we discuss the four different types of analysis, what they are and how they’re used, ranging from the simplest to the most sophisticated. We then review the different kinds of analytical systems that we can implement to produce the required analyses.
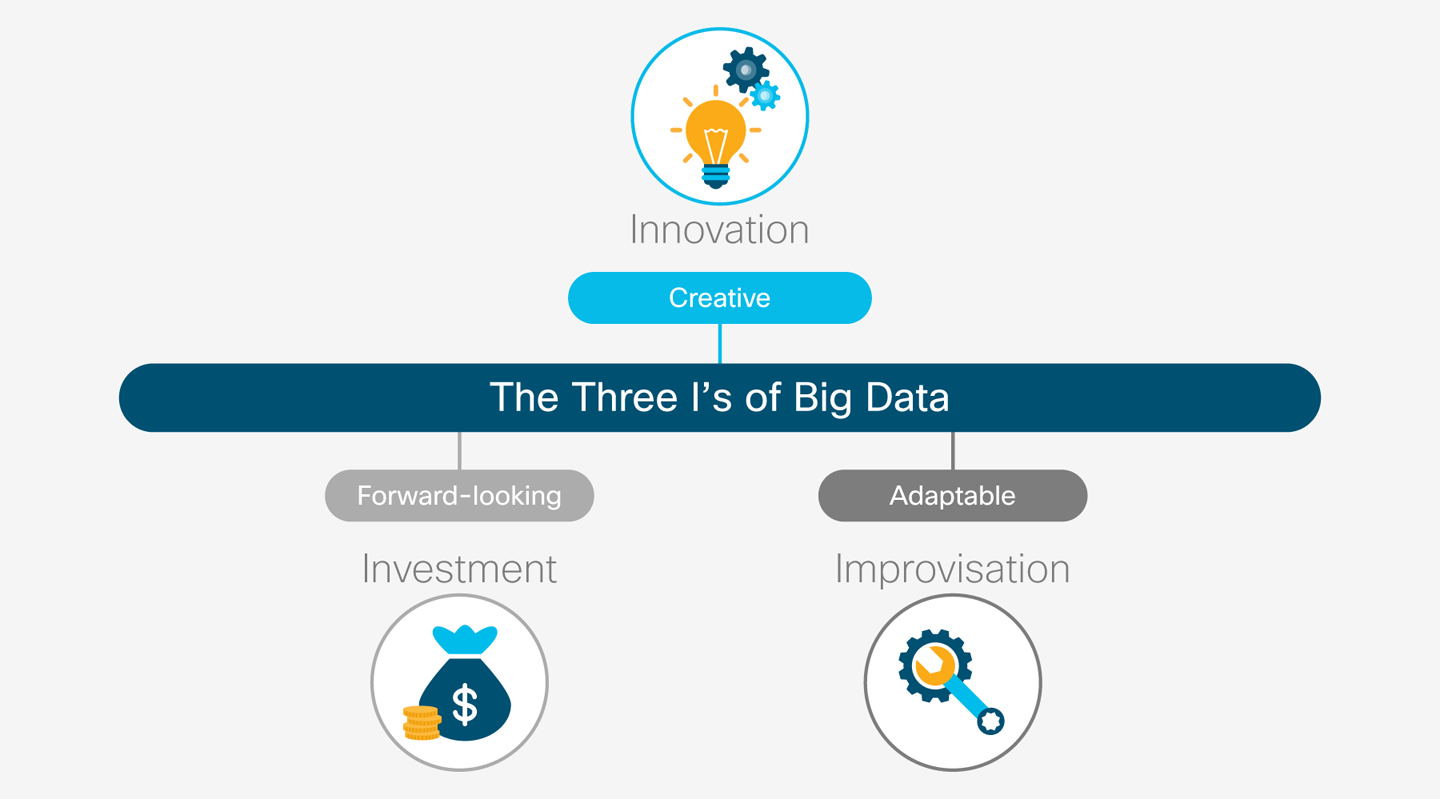
Figure 2-2. The three I’s of big data
Types of Analytics
Let’s take a look at the different kinds of analysis that are possible as well as the different types of systems that we can use to produce the analyses.
There are four types of analyses, ranging from relatively basic descriptions of what has happened to very sophisticated guidance on what actions to take (see Figure 2-3). Let’s look more closely at them.
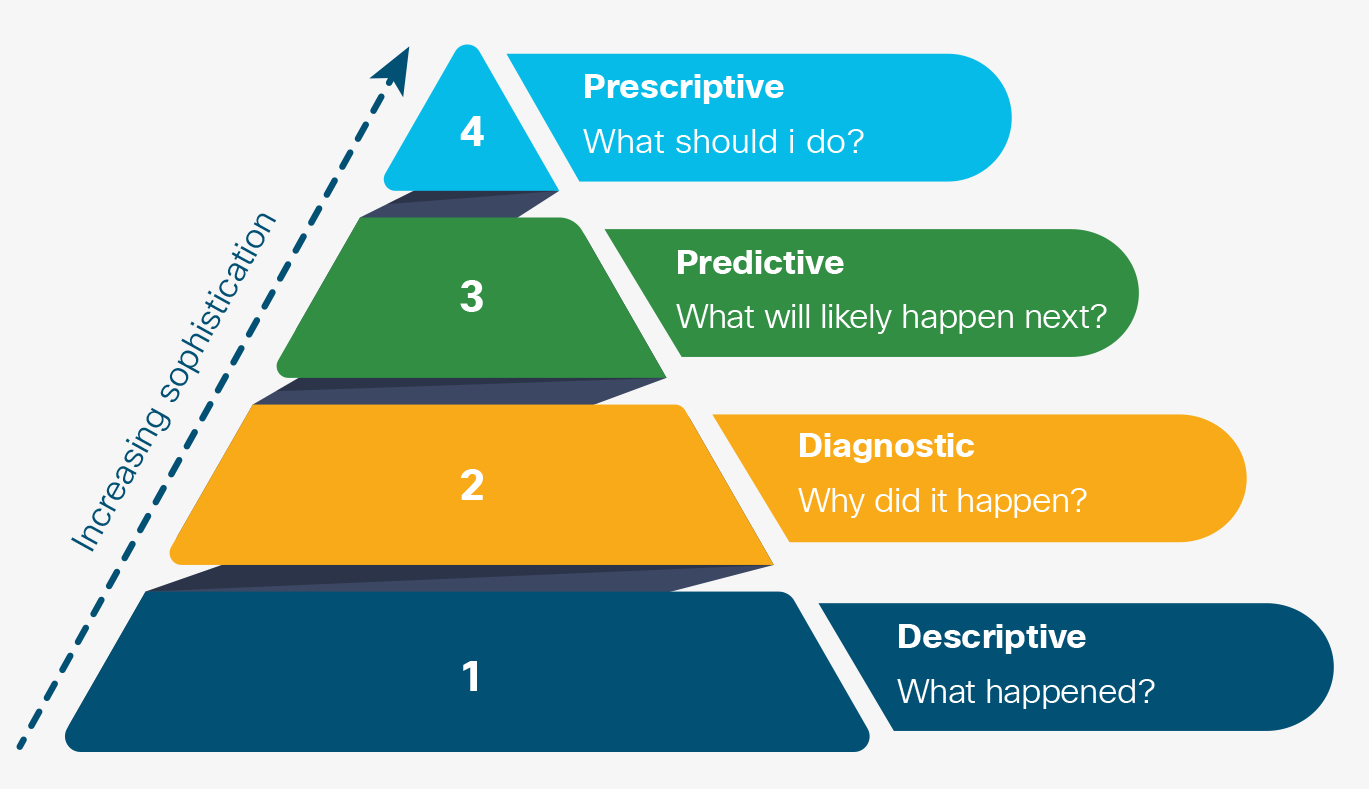
Figure 2-3. Types of analysis
Descriptive Analytics: What Happened?
Descriptive analytics summarizes past raw data putting it into a form usable by humans. Its emphasis is on helping the user understand what has already happened; for example, summarizing all sales data for all products in all regions. This analysis can be quite useful, allowing the user to view the data in many different ways.
Note that the term “past” can be misleading. What happened one minute, or even one second ago is in the past. Thus, real-time streaming data is often used in descriptive analytics. A common form for the analysis is the data displayed in a dashboard that updates as new data arrives.
Diagnostic Analytics: Why Did It Happen?
Diagnostic analytics are used for root-cause analysis to understand why something happened. For example: why sales were low in a particular region last month (the weather); or why sales for a particular product were low (high returns due to quality issues, or competitor pricing); or why a product is out of stock (supply chain issues or an unexpected spike in demand).
Knowing what happened from descriptive analytics and why it happened from diagnostic analytics enables management to make informed decisions about what course of action to take.
Predictive Analytics: What Will Likely Happen Next?
Predictive analytics goes one step further. By analyzing patterns and trends in past data, analysts can make predictions about what could happen in the future, using this information to set goals and make plans. Predictive analytics applies a variety of statistical algorithms to past data, often correlating it with past outcomes in an attempt to forecast what will happen next. Examples of common uses include the following:
What-if analysis
Data mining
Root cause analysis
Forecasting
Monte Carlo simulation
Prescriptive Analytics: What Should I Do?
Prescriptive analytics is the next logical step after predictive analysis. Prescriptive analytics is a combination of data, mathematical models and various business rules that are used to run simulations—often called scenario analysis—using various sets of assumptions.
By varying the assumptions and applying a variety of optimization techniques prescriptive analysis suggests what actions are likely to maximize a given business outcome. In other words, prescriptive analysis explores several possible actions helping to identify what actions produce the best result.
Types of Analytical Systems
The previous section described the different types of analysis, but not the kinds of systems needed to produce them. There are many different types of analytical systems available for use and which one you use is based largely on the kind of data with which you’re working. These analytical systems have overlaps and in many cases coexist and complement one another. They are by no means plug-and-play; rather, they require complex data-level and process-level integrations. Figure 2-4 presents the different types of systems.
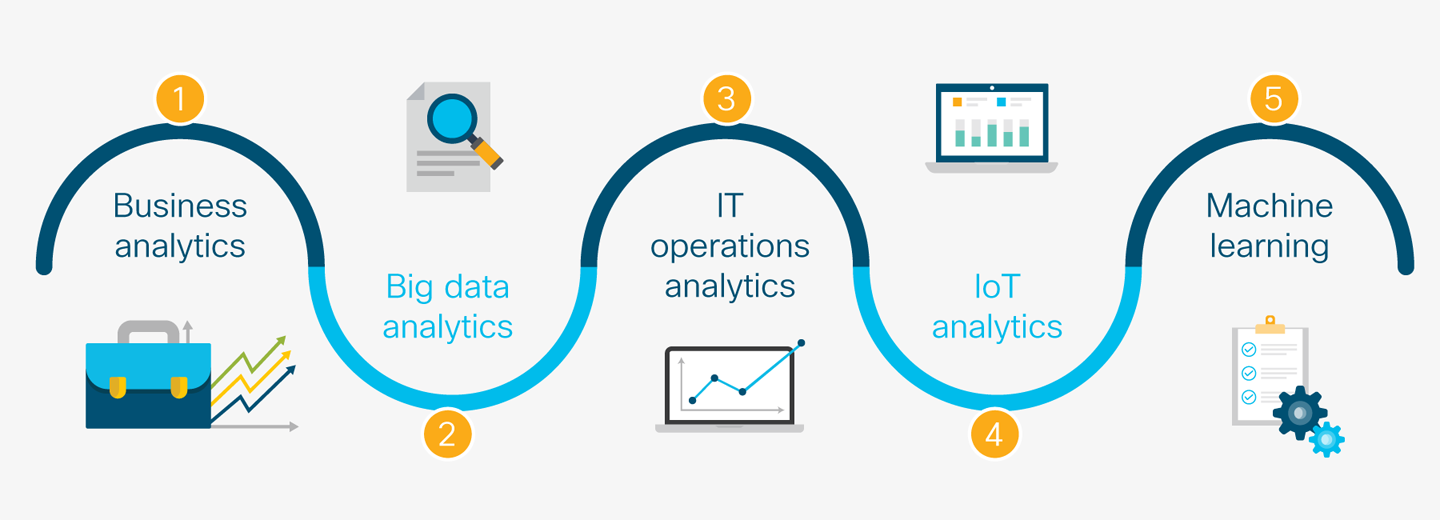
Figure 2-4. Types of analytical systems
Business Analytics
Business analytics brings together data from disparate sources to provide a more complete picture of what has happened or is happening now in the business.
Traditional data warehousing and business intelligence tools fall into this category. They excel when the data is structured and the relationships between the data are well understood.
Big Data Analytics
Big data analytics has emerged in the past decade and is characterized by the 5 V’s described in the previous section—very large volumes of data from many different data sources of differing data types, often moving very quickly. These systems can handle very large volumes of data (terabytes to petabytes) and excel at processing unstructured data. It makes possible things that traditional data warehousing and business intelligence (BI) systems are incapable of doing.
Examples include search engine companies indexing web pages; credit card processors detecting fraud; online advertisers targeting ads to specific demographics; and sentiment analysis of news and social media to understand customer perception of the business.
IT Operations Analytics
Information technology operations analytics are a specialized subset of big data analytics. They are specifically designed to analyze log data generated by applications and machines. Examples include identifying security threats and breaches in network log data; analyzing clickstream data to understand customer behavior on a website; or a security information and event management (SIEM) system, a 360-degree, holistic view of all aspects of an enterprise’s information security.
Internet of Things Analytics
Earlier, we discussed the explosion of data at the edge of the network caused by the increase in the number of connected devices. This Internet of Things (IoT) requires new analytical tools. IoT analytics falls into two main categories. The first is performing analysis at the edge of the network, at or near the devices generating the data. This is necessary when the response from the analysis is required quickly; for example, adjusting equipment to operate more efficiently, or shutting down a tool as a protective measure; and when it is impractical to send the data back to the enterprise datacenter, either because there is too much data, or the available bandwidth is limited.
The second category of analysis is performed at the enterprise-level, typically in the enterprise datacenter, on all of the data from all devices in aggregate. By looking at all data from all devices, analysts and engineers create a more complete picture and gain a deeper understanding of what is happening. When it comes to then using that data for model building, it’s simple: more data equals better models. These models are pushed to the edge making the analytics at the edge more efficient.
Examples include creating new models to be used in edge analysis; analyzing the output of all sensors or data in aggregate in order to optimize the edge device; and defining parameters to be used in proactive or predictive maintenance. We will discuss this in detail in Chapter 3.
Machine Learning
Only very recently has machine learning come to the fore as a practical analytical tool. This is because of recent developments in both specialized hardware and new software algorithms. The hardware enables the machine learning system to operate fast enough to be useful (e.g, more cores, GPUs, FPGAs). The software techniques have dramatically improved the speed with which the systems can be taught (e.g., CUDA, TensorFlow).
Machine learning and its impact on analytical systems is beyond the scope of this book, but there is a key point to keep in mind as the technology progresses and becomes more accessible: traditional, statistics-based analysis requires a human expert to define and then test the relationship between cause and effect.
Machine learning works in the opposite direction. It begins with the effect and teaches the system to automatically find what factors contribute to the outcome. The factors involved might be very complex, far more so than a human can handle, including hundreds of factors and their interactions with one another. Done correctly, we can create highly accurate predictive models. Even more, these models can automatically adjust over time as new data comes in creating an increasingly refined, ever-improving model.