
First Fridays: Monthly Job Reports
Each month, typically the first Friday, the U.S. Bureau of Labor Statistics (BLS) releases its Employment Situation Report. More commonly known as the “monthly jobs report,” the BLS release is probably the single most telling indicator on the state of the U.S. economy. It is our most meaningful economic diagnostic tool, fundamental to determining whether current expectations and economic forecasts are on track.
The monthly Employment Situation Report contains a great deal of data, but the two figures that command the most attention and move markets are the number of jobs added to the economy and the current top-line unemployment rate.
The “Noisy” Metric
The U.S. economy is characterized in one very important way by an enormous churn in the labor market. The net number of jobs created on a monthly basis is an important indicator of contemporaneous economic conditions. In terms of monthly data releases, it is hard to find one more important than the Employment Situation Report; it is the cornerstone of high frequency data regarding the economy, and the number of jobs created is central to that.
Still, new jobs numbers are “noisy.” Any single month’s numbers can be much ado about little—and the numbers get revised, although given the size of the labor market churn, revisions are comparatively small. Job creation numbers should be viewed through a longer lens (See Figure 23.1).
Prior to COVID-19 and the associated plummeting employment numbers, the U.S. economy had been adding on average a couple hundred thousand jobs monthly, growing a little faster than the labor market overall and pulling down the top-line unemployment rate. The disturbance in the labor market from COVID-19 was unprecedented, unlike any other in our lifetime (See Figure 23.2). The shock in the early part of 2020 was so large that illustrating concepts with historical data is difficult when the COVID-19 time period is included.

Figure 23.1 Number of U.S. jobs added or subtracted monthly for the 30 years ending December 2019
Source: U.S. Bureau of Labor Statistics
Release: Employment Situation
Units: Thousands of Persons, Seasonally Adjusted
Frequency: Monthly
All Employees: Total Nonfarm, commonly known as Total Nonfarm Payroll, is a measure of the number of U.S. workers in the economy excluding proprietors, private household employees, unpaid volunteers, farm employees, and the unincorporated self-employed. The measure accounts for approximately 80 percent of the workers who contribute to GDP. The chart shows the number of U.S. jobs added or subtracted every month for the 30 years ending December 2019
U.S. Bureau of Labor Statistics,
All Employees, Total Nonfarm [PAYEMS],
retrieved from FRED,
Federal Reserve Bank of St. Louis;
https://fred.stlouisfed.org/series/PAYEMS,
October 31, 2020.
The worst month in the Great Recession saw about 800,000 jobs disappear. In one month early in the recovery, the United States added about a half-million jobs, and thereafter bounced along adding jobs at that near-two hundred thousand average. As of the end of 2019, we were functionally at full employment, but still managing to hire at a good pace.

Figure 23.2 COVID-19 vs. the Great Recession
Figure 23.2 repeats Figure 23.1 with the addition of the months of 2020 through September. Everything illustrated by the first slide has turned into what is essentially a flat line close to zero. The Great Recession is one of the few places where the line deviates from zero, but it doesn’t look all that awful—and it was the worst recession since the Great Depression. The job losses in April 2020 dwarf anything that had happened in the previous 30 years (and more), making even the years of the Great Recession look stable, though we know they weren’t.
Source: U.S. Bureau of Labor Statistics
Release: Employment Situation
Units: Thousands of Persons, Seasonally Adjusted
Frequency: Monthly
U.S. Bureau of Labor Statistics,
All Employees, Total Nonfarm [PAYEMS],
retrieved from FRED, Federal Reserve Bank of St. Louis;
https://fred.stlouisfed.org/series/PAYEMS,
October 31, 2020.
In fact, the labor market, while quite dramatic, is far from the only economic data series that was severely disrupted by COVID-19. It will complicate discussions regarding economic history for decades to come.
The “Tricky” Metric
Unemployment rates are key economic indicators, but using them can be tricky, mainly because there are more than the one most commonly reported rate. The BLS monthly reports include six different measures of unemployment, not so cleverly titled U1 through U6. The rate that gets the most attention is U3, the definition of which students of Economics 101 memorized as “the share of the labor force that has been looking for work recently but can’t find it.” To calculate U3, you divide the number of people who have actively sought work within the past four weeks but did not find it by the total number of people available to work (most of whom are going to be currently employed). At the outset of pandemic, early in 2020, that figure had worked its way down to 3.5 percent, essentially full employment as defined by economists. (A rule of thumb is that a rate of less than 5 percent signals a very healthy labor market, functionally at full employment.)
Those monthly figures, in particular the updated U3 unemployment rate, move the financial markets because they capture both labor demand and labor supply, the combination of which best illustrates activity in the economy. When businesses are aggressively hiring and the unemployment rate is low it’s a sign the economy is doing well. At the same time, the labor supply reflects consumer preferences regarding jobs and income; the labor force will expand or contract based on consumers’ current financial conditions and expectations of the future. At some point everything has to manifest itself in one of those two components; everything that happens in the economy touches the labor market and the unemployment rate measures both sides.
There will always be people looking for work because of a mismatch in the labor market that prevents everyone from having a job. They can be considered victims of frictional unemployment, where workers are in the wrong place or have the wrong skills, which is inevitable as jobs and the skills required to do them are constantly changing. So the U3 rate alone is insufficient as a true employment metric, even if it is the best measurement of the lot.
U6 is the broadest measure of labor under-utilization. Also released in the monthly Employment Situation Report, it includes an element of labor market dynamics that has become progressively more important in recent years. U6 counts everything that is in U3 headline rate plus two additional components: discouraged workers and people who are “parttime workers for economic reasons.” If you are unemployed and get discouraged and stop looking for work for four weeks or longer but would take a job if one became available, you’re not counted in U3 because you aren’t actively engaged in a search for a job. Typically the number of discouraged workers varies with the business cycle. During a recession with high unemployment, we see more discouraged workers who assume, probably correctly, their job search efforts will go unrewarded.
A common complaint about the Employment Situation Report is that it doesn’t capture a large segment of the labor market; it does, just not in the headline U3. Discouraged workers are captured in BLS surveys and included in U6. U6 is reported in the same monthly BLS press release; it’s just not usually featured in media reporting.
The number of “part-time for economic reason” workers increased in the early part of the twenty-first century, soared during the Great Recession, and remained elevated, at least until the COVID-19 disruption (See Figure 23.3).

Figure 23.3 The number of “part-time for economic reasons” workers soared during the Great Recession and have remained high
Source: U.S. Bureau of Labor Statistics
Release: Weekly and Hourly Earnings from the Current Population Survey
Units: Thousands of Persons, Not Seasonally Adjusted
Frequency: Quarterly
Wage and salary workers are workers who receive wages, salaries, commissions, tips, payment in kind, or piece rates. The group includes employees in both the private and public sectors but, for the purposes of the earnings series, it excludes all self-employed persons, both those with incorporated businesses and those with unincorporated businesses. For more information see https:// bls.gov/cps/earnings.htmThe series comes from the ‘Current Population Survey (Household Survey)’The source code is: LEU0264466800
U.S. Bureau of Labor Statistics,
Employed part time: Wage and salary workers: 16 years and over [LEU0264466800Q], retrieved from FRED,
Federal Reserve Bank of St. Louis;
https://fred.stlouisfed.org/series/LEU0264466800Q,
October 31, 2020.
The people who fill part-time jobs fall into two classes: those who prefer part-time work, known as “part-time for non-economic reasons,” and those who would take full-time employment if they could get it, identified as “part-time for economic reasons.” Gen Xers and millennials in particular are driving the noneconomic part-time segment of the labor force higher, but neither of the part-time worker groups is counted in U3. The “part-time for economic reasons” are included in U6 because they receive wages on a regular basis, even though they would like to be more actively engaged in the labor market. While they aren’t technically unemployed, they are underutilized. People working “part-time for non-economic reasons” are considered content in their current state, and are not counted in U6 as underutilized.
A Widening Gap
Traditionally most unemployment rates move in the same direction. If you were reporting on unemployment, the U3 top-line rate would be sufficient. You didn’t really need to look at the others because all their movements told essentially the same story. But the Great Recession blew up the relationship between U3 and U6.
In the latter part of post–Great Recession expansion, with U3 at historic lows, wages weren’t growing rapidly, which we would expect at full employment because companies have to offer better wages to get people into the workforce. One explanation: the gap between U3 and U6. Neither discouraged workers nor part-time workers wanting full-time work demand higher wages to provide added labor. Discouraged workers want a job and part-time workers want more hours, and both are willing to hire on at prevailing wages. Wages started edging up toward the end of the post–Great Recession expansion as the gap between the two measures was starting to close. Then it blew up again with the arrival of COVID-19 (See Figure 23.4).
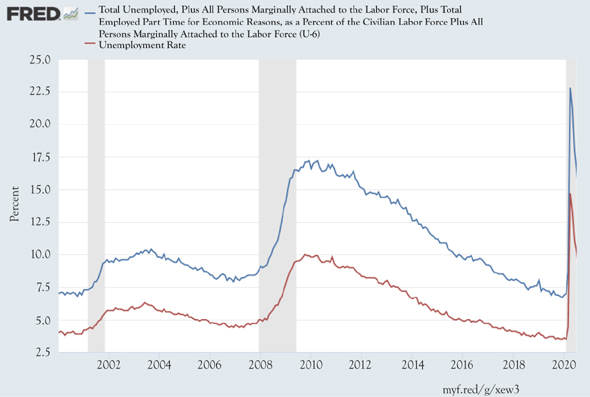
Figure 23.4 With the Great Recession, the gap between U6 (top) and U3 (bottom) unemployment rates widened, then narrowed, then widened again with the arrival of the COVID-19 pandemic.
Source: U.S. Bureau of Labor Statistics
Release: Employment Situation
Units: Percent, Seasonally Adjusted
Frequency: Monthly
The series comes from the ‘Current Population Survey (Household Survey)’ The source code is: LNS13327709
U.S. Bureau of Labor Statistics, Total Unemployed, Plus All Persons Marginally Attached to the Labor Force, Plus Total Employed Part Time for Economic Reasons, as a Percent of the Civilian Labor Force Plus All Persons Marginally Attached to the Labor Force (U-6) [U6RATE],
Retrieved from FRED,
Federal Reserve Bank of St. Louis;
https://fred.stlouisfed.org/series/U6RATE,
October 31, 2020.
Takeaways
• The Employment Situation Report, more commonly known as the “monthly jobs report,” is the single most telling indicator on the state of the U.S. economy.
• The two report figures that command the most attention and move markets are the number of jobs added to the economy and the current top-line unemployment rate.
• New jobs numbers are “noisy.” Job creation numbers should be viewed through a longer lens.
• U6 is a broader measure of labor under-utilization than U3. U6 counts everything that is in U3 plus two additional components: discouraged workers and “part-time for economic reasons” workers.
• Part-time for economic reasons workers widened the gap between U3 and U6 during the Great Recession.
• The gap was closing at the end of the post–Great Recession expansion but blew up again with the arrival of COVID-19.
Equilibrium
The monthly Employment Situation Report deserves, and gets, a great deal of attention because labor is central to virtually all economic activity. Changes in the number of people employed reflect changes in income that have implications for future spending and economic conditions. The monthly reports also reflect the condition of firms that will adjust employment to reflect current and near-term expected economic conditions. The unemployment rate moves as a function of both labor supply and labor demand, each of which individually reflects deeply fundamental conditions in the economy, and together contain an enormous amount of information that can be used to forecast the economic future.