
Chapter 13
Probability Assessment
13.1 Nonrepeatable Events
It has been shown in Chapter 7 how you may assess your probabilities in many cases using classical ideas of equiprobable outcomes or, more often, by employing frequency concepts. Historically, these have been the most important methods of assessment and have led to the most valuable applications. However, there remain circumstances where neither of these ideas is relevant and resort has to be made to other methods of assessment; to other methods of measuring your uncertainty. For example, if you live in a democracy, the event that the political party you support will win the next election is uncertain, yet no equiprobable cases or frequency data exist. It is clearly unsound to argue that because over the past century your party has been successful only 22% of the time, your probability of success now is around 0.22, for elections are not usually judged exchangeable. No really sound and tested methods exist for events such as elections and as a result, this chapter is perhaps the most unsatisfactory in the book. What is really needed is a cooperative attack on the problem by statisticians and psychologists. Unfortunately, the statisticians have been so entranced by results using frequency, and the psychologists have concentrated on valuable descriptive results, that a thorough treatment of the normative view has not been forthcoming. What follows is, hopefully, not without value but falls short of a sound analysis of the problem of assessing your probability for a nonrepeatable event.
The treatment makes extensive use of calculations using the three basic rules of probability. Readers who are apprehensive of their own mathematical abilities might like to be reminded that those rules only correspond to properties of proportions of different balls in an urn (§5.4) so that, if they wish, they can rephrase all the calculations that follow in terms of an urn with 100 balls, some of which, corresponding to the event A below, are red, the rest, A c, white, while some are plain corresponding to B and others spotted for B c. With a little practice, probabilities are easier to use, but the image of the urn is often found simpler for the inexperienced. An alternative strategy would be to write computer programs corresponding to the rules and use them. But initially it is better to experience the calculations for yourself rather than indulge in the mystique of a black box, however useful that may ultimately turn out to be.
Suppose you are contemplating a nonrepeatable, uncertain event, which we will refer to as A. You wish to assess your probability p (A) for the event on some knowledge base that will be supposed fixed and omitted from both the discussion and the notation. Because readers are interested in different things and, even within a topic, have divergent views, it is difficult to produce an example that will appeal to all. The suggestion is that you take one of the examples encountered in Chapter 1 to help you think about the development that follows. Perhaps the simplest is Example 1, the event A of “rain tomorrow”, with “rain on the day after tomorrow” as the event B introduced later. With one event being contemplated, the only logical constraints on your probability are convexity, that it lies between 0 and 1, both extremes being excluded by Cromwell, and that your probability for the complement A c is 1 − p (A). In practice, you can almost always do better than that because some events are highly improbable, such as a nuclear accident at a named power plant next year, whence p (A) is near 0. Others are almost certain and have p (A) near to 1. In both these cases, the difficult question is how near the extremes are. Other events are highly balanced, as might be the election, and therefore p (A) is nearer ½. Generally, people who are prepared to cooperate and regard the assessment as worth thinking about are willing to provide an interval of values that seem reasonable for them. Suppose that you feel your probability p (A) for the event A lies between 0.5 and 0.7 but are reluctant to be more precise than that. This is not to say that smaller or larger values are ruled out, but that you feel them rather unreasonable. It is this willingness to state an interval of values that has led to the concept of upper and lower probabilities in §3.5, an avenue not explored here, preferring the simplicity of the single value, if that can be assessed, for reasons already given.
13.2 Two Events
With a single event, this seems about as far as you can go and the attainment of a precise value, such as 0.6, let alone 0.6124, is beyond reach. You can think about your probability of the event being false, but this is so naturally 1 − p (A) that this scarcely helps. However, if a second related event, B, is introduced, the two other rules of probability, addition and multiplication, come into play and since, with convexity already used, you have all the basic rules upon which all others depend, there is a real opportunity for progress, essentially because coherence can be exploited in full. As has been seen in §4.2, with two events, A and B, there are three probabilities to be assessed, p (A) already mentioned and two others that express your appreciation of the relationships between the events in the form of your probabilities for B, both when A is true and when it is false. These are ![]() and
and ![]() that, together with p (A), completely express your uncertainty about the pair of events. Each of these probabilities can take any value between 0 and 1, irrespective of the values assumed by the other two. Again, in practice, people seem to be able to give intervals within which their probabilities lie. In the table, which will frequently be referred to in what follows, an example has been taken in which you feel
that, together with p (A), completely express your uncertainty about the pair of events. Each of these probabilities can take any value between 0 and 1, irrespective of the values assumed by the other two. Again, in practice, people seem to be able to give intervals within which their probabilities lie. In the table, which will frequently be referred to in what follows, an example has been taken in which you feel ![]() lies between 0.2 and 0.3, while
lies between 0.2 and 0.3, while ![]() lies between 0.6 and 0.8. These values appear in the top, left-hand corner of the table and imply that the truth of A leads you to doubt the truth of B in comparison with your opinion when A is false, A c is true. In the language of §4.4, you think the two events are negatively associated.
lies between 0.6 and 0.8. These values appear in the top, left-hand corner of the table and imply that the truth of A leads you to doubt the truth of B in comparison with your opinion when A is false, A c is true. In the language of §4.4, you think the two events are negatively associated.
As an aside, it would be possible for you to proceed differently and to contemplate four events derived from the two original ones, namely,
![]()
the last, for example, meaning that A and B are both false. This partition would lead to four assessments, which must necessarily add to 1, so to only three being free for you to assess, as with the method in the last paragraph. However, the partition is generally not as satisfactory as the method we go on to use because it only exploits the addition rule, in adding to 1, whereas ours uses the multiplication rule as well. Nevertheless, the choice is yours; you may be happier using the partition and be prepared to sacrifice numerical precision for psychological comfort, which is far from absurd. Moreover, from the partition values, you can calculate the conditional probabilities using the multiplication rule.
Returning to the position where you have made rough assessments for p (A), ![]() and
and ![]() , we recall from §4.2 that it would be possible for you to contemplate the events and their probabilities in the reverse order, starting with p (B) and then passing to the dependence of A on B through
, we recall from §4.2 that it would be possible for you to contemplate the events and their probabilities in the reverse order, starting with p (B) and then passing to the dependence of A on B through ![]() and
and ![]() , these values being determined from the first three by the addition and multiplication rules, so that no new assessment is called for. To see how this works, take the midpoints of the three interval assessments already made and consider what these intermediate values imply for your probabilities when the events are taken in the reverse order. Recall, from the table, that the three intermediate values are
, these values being determined from the first three by the addition and multiplication rules, so that no new assessment is called for. To see how this works, take the midpoints of the three interval assessments already made and consider what these intermediate values imply for your probabilities when the events are taken in the reverse order. Recall, from the table, that the three intermediate values are
![]()
listed as (13.1) in the table.
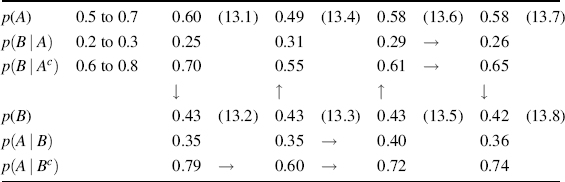
The rule of the extension of the conversation in §5.6, here from B to include A, enables p (B) to be found,

Bayes rule (§6.3) enables your view of the dependence of A on B to be found.
![]()
p (B) coming from the calculation just made. Similarly,
![]()
where the result, that your probability for the complement of an event is one minus your probability for the event, has been used twice. We repeat: if your probabilities had been
then necessarily
and you have no choice in the matter; this is coherence using the full force of the rules of probability. These implications, with the numbering of the equations, are shown in the table following the arrows.
You may legitimately protest that you did not state values originally but gave only ranges. True, and it would be possible to calculate intervals, using the rules of probability, for the new assessments, but this gets a little complicated and tedious, so let us just stay with the intermediate values (13.1) and their implications (13.2), not entirely forgetting the intervals. With these implications available, you can think whether they seem sensible to you. Alternatively, you could, before doing the calculations above that lead to (13.2), assess reasonable ranges for the probabilities in (13.2). Again, we will omit these complications and ask you to consider the values in (13.2) produced by straight calculations from (13.1).
In the hypothetical example, suppose that you consider the value for ![]() at 0.79 to be excessively high, feeling that 0.60 is more sensible, but that the other two probabilities in (13.2) are reasonable. Then with
at 0.79 to be excessively high, feeling that 0.60 is more sensible, but that the other two probabilities in (13.2) are reasonable. Then with
you may reverse the process used above, with Bayes rule and the extension of the conversation, to obtain the implication
in lieu of (13.1). The calculations are left to the reader and the results are displayed in the table following the arrow. Now these implications are disturbing, for each of the values in (13.4) lie outside your original intervals, the first two only slightly but the last more seriously. It therefore looks as though the shift of ![]() from 0.79 in (13.2) to 0.60 in (13.3) is too extreme and requires amendment. Looking at (13.2) again, suppose you feel that the dependence of A on B that they express is too extreme, your probability of A changing from 0.35 to 0.79 according as B is true or false. Perhaps you were correct to lower the latter but that the same effect might be better achieved by raising the former and lowering the latter rather less, leading to
from 0.79 in (13.2) to 0.60 in (13.3) is too extreme and requires amendment. Looking at (13.2) again, suppose you feel that the dependence of A on B that they express is too extreme, your probability of A changing from 0.35 to 0.79 according as B is true or false. Perhaps you were correct to lower the latter but that the same effect might be better achieved by raising the former and lowering the latter rather less, leading to
in place of (13.3).
Now you can apply Bayes rule and the extension to calculate the new implications for your original probabilities with the results
shown in the table. Again comparing these with your original intervals, you notice that all the values in (13.6) lie within them, which is an improvement on (13.5), but that both the conditional probabilities are at or near the ends of their respective intervals, which suggests bringing them in a little to
leaving p (A) unaltered. Bayes and the extension imply
all of which are shown in the table.
13.3 Coherence
If we stand back from the numerical details and consider what has been done in the last section, it can be seen that, starting from a triplet of probabilities (13.1), each of which can freely assume any value in the unit interval, the implications for another triplet (13.2) have been calculated using coherence. This new triplet can be amended according to your views and the calculations reversed, with the events interchanged, leading back to new values for the original triplet. If that amendment does not work, another one can be tried and its implications tested. This process of going backward and forward between the two triplets of probabilities will hopefully lead to a complete sextet that adequately expresses your uncertainties about the two events, as we suppose (13.7) and (13.8) to do in the example. The key idea is to use coherence to the full by employing all three of the basic rules of probability, achieving this coherence by a series of adjustments to values that, although coherent, do not adequately express your uncertainties. Essentially, you look at the solution from two viewpoints, of A followed by B, and then B followed by A, until both views look sound to you. This section is concluded with a few miscellaneous remarks on the procedure.
The method just described uses two related events, A and B, but it can be improved by including a third event C. Contemplating them in the order A, B, and then C, the assessments with the first two proceed as above but the addition of C leads to four additional probabilities
![]()
each of which can freely assume any value in the unit interval. This requires seven assessments in all, three original and four new ones. There are six possible orders in which the three events can be contemplated, namely,
![]()
leading to passages backward and forward between them and vastly increased possibilities for exploiting coherence. This extension is naturally much more complicated but, with the help of computer programs that use Bayes rule and the extension of the conversation, is not unrealistic.
This method for probability assessment is analogous to that used for the measurement of distances, at least before the use of satellites, in that several measurements were made, surplus to the minimal requirements, and then fitted together by coherence. For distances, coherence is provided by the rules of Euclidean geometry, replacing the rules of probability that we used. With two events, six probabilities were used instead of the minimal three. Coherence, ordinarily expressed through rules described in the language of mathematics, is basic to any logical treatment of a topic, so that our use is in no way extraordinary.
There are situations where the procedure outlined above is difficult to pursue because some uncertainties are hard for you to think about. For example, suppose event A precedes event B in time, when ![]() and
and ![]() are both natural, expressing uncertainty about the present, B, given what happened with A in the past, whereas
are both natural, expressing uncertainty about the present, B, given what happened with A in the past, whereas ![]() and
and ![]() are rather unnatural, requiring you to contemplate the past, given present possibilities. The method is still available but may be less powerful because the intervals you ascribe to the unnatural probabilities may be rather wide. Notice however that there are occasions when the unnatural values are the important ones, as when A is being guilty of a crime and B is evidence consequent upon the criminal act. The court is required to assess the probability of guilt, given the evidence,
are rather unnatural, requiring you to contemplate the past, given present possibilities. The method is still available but may be less powerful because the intervals you ascribe to the unnatural probabilities may be rather wide. Notice however that there are occasions when the unnatural values are the important ones, as when A is being guilty of a crime and B is evidence consequent upon the criminal act. The court is required to assess the probability of guilt, given the evidence, ![]() or
or ![]() in the notation of §6.6.
in the notation of §6.6.
The coherent procedure can be simplified by the use of independence, though it is rather easy to misuse this elusive concept. For example, in considering three events, it might be reasonable to assume that A and C are, for you, independent, given B, so that ![]() reduces to
reduces to ![]() and others similarly, thereby reducing the number of probabilities to be assessed. The danger lies in confusing your independence of A and C, given B, with their independence, given only your knowledge base (see §8.8). There is one situation where independence has been used with great success in contemplating events that occur in time or space. Here we discuss only the temporal case. Let A 1, A 2,…be similar events that occur on successive days, thus Ai might be rain on day i. Then the natural, and ordinarily important, uncertainties concern rain today, given rainfall experience in the past, for example,
and others similarly, thereby reducing the number of probabilities to be assessed. The danger lies in confusing your independence of A and C, given B, with their independence, given only your knowledge base (see §8.8). There is one situation where independence has been used with great success in contemplating events that occur in time or space. Here we discuss only the temporal case. Let A 1, A 2,…be similar events that occur on successive days, thus Ai might be rain on day i. Then the natural, and ordinarily important, uncertainties concern rain today, given rainfall experience in the past, for example, ![]() , your probability for rain on day 5, Thursday, given that it also rained on days 4 and 1, Wednesday and Sunday, but not on days 3 and 2, Tuesday and Monday. An extreme possibility is to assume that the past experience from Sunday to Wednesday does not affect your uncertainty about Thursday, when we have the familiar independence and the Bernoulli series of §7.4 if, in addition, p (A i ) is the same for all values of i. A more reasonable assumption might be that today's rain depends only on yesterday's experience and not on earlier days, so that, in particular, the above probability becomes
, your probability for rain on day 5, Thursday, given that it also rained on days 4 and 1, Wednesday and Sunday, but not on days 3 and 2, Tuesday and Monday. An extreme possibility is to assume that the past experience from Sunday to Wednesday does not affect your uncertainty about Thursday, when we have the familiar independence and the Bernoulli series of §7.4 if, in addition, p (A i ) is the same for all values of i. A more reasonable assumption might be that today's rain depends only on yesterday's experience and not on earlier days, so that, in particular, the above probability becomes ![]() . The general form of this assumption is to suppose that, given yesterday's experience, here A 4, today's A 5 is independent of all the past,
. The general form of this assumption is to suppose that, given yesterday's experience, here A 4, today's A 5 is independent of all the past, ![]() , and even further back. Such a sequence of events is said to have the Markov property. Independence is an important, simplifying assumption that should be used with care. The Markov form has been most successful, producing a vast literature. It is a popular generalization of exchangeability because, by using various tricks, so many phenomena can be judged to have the Markov property.
, and even further back. Such a sequence of events is said to have the Markov property. Independence is an important, simplifying assumption that should be used with care. The Markov form has been most successful, producing a vast literature. It is a popular generalization of exchangeability because, by using various tricks, so many phenomena can be judged to have the Markov property.
Mention of the scientists' use of small and large worlds was made in §11.7. Similar considerations apply here in the use of coherence to aid your assessment of your probabilities. Essentially, the thesis expounded in this chapter is that your small world can be too small and, by enlarging it, you can better determine your uncertainties. Confining your attention to a single event, and its complement, may be inadequate so that your world is far too small to take advantage of the power of coherence. By adding a second, related event, you can use the full force of coherence in the larger world in the manner described in §13.2. Even this may not be enough and a third event may need to be included before your uncertainties can be adequately described in the yet larger world with three events. A striking example of this was encountered with Simpson's paradox in §8.2 where the relationship between disease and treatment could only be understood by including a third factor, sex. There is an unfortunate tendency these days for discussion to take place in too small a world with a possible distortion of the situation. As these words are being written, there is a discussion being conducted about crime, its nature, its prevention, and its punishment. Yet there is one factor commonly omitted, namely, poverty and the role it plays in the types of crime under consideration. Another factor that is possibly relevant is drug taking. There comes a point where the enlargement of your small world has to stop because the analysis becomes impossibly complicated. Scientists have often been most successful in finding worlds that are sufficiently small to be understood, often using sophisticated mathematics, but are adequate to make useful predictions about future data. Economists have perhaps been less successful. The achievement of a balance between the simplicity of small worlds, the complexity of large ones, and the reality of our world is a delicate one. The essence of the approach here is that you should not make your world too small when discussing uncertainty.
13.4 Probabilistic Reasoning
In Chapter 2 it was emphasized that the approach adopted in this book would be based on reason. This is perhaps contrary to the practice in most writing where, to use the language of §2.5, the result is more descriptive than normative. Now that uncertainty has been studied and probability developed as the reasoned way to study the phenomenon, we can go back and look at the implications that the development has on the reasoning process itself. Though the earlier discussion may have deplored the lack of reasoning in everyday life, there are occasions where it is used with advantage. Here is a simple example.
Economists might reason that, were the government to increase taxation, people would have less money in their pockets and so would reduce their spending; traders would suffer and a recession would result. This is surely a reasoned argument, though some may claim that the reasoning is at fault, but there is one thing wrong with the reasoning process itself in that it does not allow for uncertainty. In other words, the methodology is defective irrespective of any flaws in the economic reasoning. It is simply not true that the increase in taxes will result in a recession; the most that could be said is that it is highly probable that increased taxation will result in a recession. In the style developed in this book, the probability of a recession, given increased taxes, is large. Notice incidentally, the condition here is a “do” operation, rather than “see” (§4.7). Our contention is that reasoning itself, with the emphasis on truth and implication, can be improved by incorporating uncertainty, in the form of probability, into the process. As has been mentioned in §5.4, logic deals with two states only, truth and falsity, often represented by the values 1 and 0, respectively, so that A = 1 means that the event A is true. On the other hand, probability incorporates the whole unit interval from 0 to 1, the two end points corresponding to the narrower demands of ordinary logic. Essentially, the calculus of probability is a significant generalization of logical reasoning. To support this claim, an example of probabilistic reasoning now follows but, in presenting it, it must be pointed out that the emphasis is on the probability aspect, not on the economics that it attempts to describe. The probabilities that appear are mine; I am the “you” of the treatment. A statistician's task is to help the expert, here an economist, articulate their uncertainties and really “you” should be an economist. The style of the analysis is sound; the numerical values may be inappropriate.
13.5 Trickle Down
A thesis, put forward in the years when Britain had a government led by Mrs. Thatcher, and more recently by other right-wing politicians, was that if the rich were to pay less tax, the top rate of tax being lowered from about 80% to around 40%, the consequent increase in their net salaries would encourage greater efficiency on the part of the rich, thereby increasing productivity, and ultimately the poor would share in the prosperity. In other words, more money for the rich would also mean more for the poor. It was termed the “trickle-down effect”. Although said with some assurance by the politicians, there is clearly some uncertainty present so that a study using probability might be sensible.
We begin by contemplating two events:
![]()
A more sophisticated approach would refer, not to events, but to uncertain quantities (§9.2) measuring the decrease in tax and the increase in wages for the poor but, to avoid technical problems, we here consider only events. In these terms, the trickle-down effect can be expressed by saying that the probability of the poor gaining is higher if the top rate of tax is reduced, than otherwise. In symbols,
![]()
for a “you” who believes in the effect. Since the effect must operate through the gross domestic product (GDP), the conversation is extended to include the event
![]()
during some period under consideration. Technological advances can account for a 2% increase whatever government is in power, so the best that the changes to taxation could achieve is an increase beyond 2%. With three events, L, R, and G, we are ready to introduce probabilities. The events arise in the natural order, L first, which affects G and then the poor share in the increase, R; so the events are taken in that order. L is an act, a “do”, and has no uncertainty.
According to the reasoning used by the government, the event L of less tax will result in an increase in GDP, event G. Inserting the uncertain element, the firm assertion is replaced by saying G is, for you, more probable under L than under L c. Suppose you think about this and come up with the values
The next stage is to include the poor through the event R. First consider the case where the GDP does increase beyond its natural value, event G, and contrast the two cases, L with the tax reduction, and L c without. For a fixed increase in GDP, the rich will consume more of it with L than with L c because in the former case they will have more money to spend, with the result that the poor will benefit less under L than with L c. Essentially, the poor's share will diminish under L because the rich have the capacity to increase theirs, recalling that this is for a fixed increase in GDP. However, both groups will probably do well because of the increase in prosperity due to the higher GDP. Putting all these considerations together suggests that the values
reasonably reflect them, both probabilities being on the high side but that, given L, being the smaller.
Next pass to the case where the GDP does not increase beyond its natural value, event G c. It will still probably remain true that, with the tax breaks, the rich will consume more of the GDP than if they had not had them, so that the poor will get less. On the contrary, neither group will do as well as with G because there is less to be shared. The values
might reasonably reflect these considerations.
It was seen in §8.8, that with three events, there are seven probabilities to be assessed in order to provide a complete structure. Here, one event, L, has no uncertainty, it is either done or not, so only six values have to be found and these are provided in (13.9), (13.10), and (13.11) above. The probability calculus can now be invoked and the conversation extended from the events of importance, R and L, to include G. First with the tax relief L
![]()
and then with L c
![]()
As a result, you think that the poor will probably do better without the tax relief for the rich, 0.52, than with it, 0.44, and the probability development does not support the trickle-down effect.
The essence of the above argument is that if you include the GDP, then the poor are likely to have a smaller share of it if the rich get their tax breaks, whatever the size of the GDP. On averaging over values of the GDP, the reduction persists. Notice that what happens with both G and with G c does not necessarily happen when the status of the GDP is omitted, as we saw with Simpson's paradox in §8.2, but here the values suggested in (13.10) and (13.11) do not lead to the paradox. (A reader interested in comparing the calculation here with that for Simpson may be helped by noting that R here corresponds to recovery, L to the treatment, and G to sex.)
Before leaving the discussion, let me emphasize the point made at the beginning, namely that the emphasis is on the methodology of the discussion and not on its economic soundness. It would be possible for the reader, acting as another “you”, to replace some, if not all, of the probabilities used above, by other probabilities in order to produce an argument that supports the trickle-down effect. The discussion in this section, indeed throughout the book, is not intended to be partisan but only to demonstrate a form of reasoning, using uncertainty, intended to shed new light on a problem. One feature of the general approach is that it incorporates other considerations that may be relevant to the main issue. Here GDP has been included to relate tax on the rich to well-being of the poor. The tool here is coherence, fitting the uncertainties together in a logical manner. By being able to calculate other probabilities from those initially assessed, it is possible to look at different aspects of the problem. The inclusion of more features brings with it more opportunities to exploit coherence and more checks on the soundness of the uncertainties that have been assessed. More features involve more complexity, but the process only requires the three rules of probability. These are suitable for use on a computer. I envisage an analysis in which a decision maker, “you”, thinks about some uncertainties, leaving the computer to calculate others. The presentation here has been in terms of beliefs but extends to action because utility is itself expressed in terms of probabilities as was seen in §10.2. The claim here is that we have a tool that enables you to both think and act, while a computer supplies checks on the integrity of your thoughts and actions.
13.6 Summary
All the methods described in this chapter depend on the concept of coherence, of how your beliefs fit together. Indeed, it can be said that all the arguments used in this book revolve around coherence. With the single exception of Cromwell's rule, which excludes emphatic beliefs about events that are not logically proven, none of the material says what your beliefs should be; none of your probabilities are proscribed. There are many cases where it has been suggested that specific probabilities are rather natural, such as believing the tosses of a coin to be exchangeable; or based on good evidence, such as believing that a new-born child is equally likely to be of either sex. But there is no obligation on you to accept these beliefs, so that you can believe that, when you have tossed the coin 10 times with heads every time, the next toss will probably be tails, to make up the deficit; or a pregnant woman believes that the child she bears is male. Neither of these beliefs is wrong; the most that can be said is that they are unusual or incoherent.
At first sight, this extremely liberal view that you can believe what you like, looks set to lead to chaos in society, with all of us having different opinions and acting in contrary ways. However, coherence mitigates against this. We saw in the simple example of the red and white urns in §6.9 that, whatever your initial belief about the color of the urn, provided you updated this belief by Bayes rule, the continual withdrawal of more white balls than red would raise your probability that the urn was white to nearly 1, so that everyone would be in the same position, irrespective of any initial disagreements. Generally, if there are a number of theories, data will eventually convince everyone who has an open mind that the same theory is the correct one. It is our shared experiences that lead us to agreement. But notice that this agreement depends on your use of Bayes rule, or generally on coherence in putting all your beliefs together. Without coherence there is little prospect of agreement. I suggest that in coherence lies the best prospect of social unity on this planet.
In this chapter, we have not been nearly so ambitious, being content to argue that you should not contemplate beliefs and probabilities in isolation, but should always consider at least two beliefs so that the full force of the probability calculus may be used. Similarly, in decision making, it is important to fit all the parts of the tree together in a coherent way. The lesson of this book—
Be Coherent.