In this chapter
Forward and reverse engineering
Sequence diagrams and communication diagrams—which are collectively called interaction diagrams—are two of the diagrams used in the UML for modeling the dynamic aspects of systems. An interaction diagram shows an interaction, consisting of a set of objects and their relationships, including the messages that may be dispatched among them. A sequence diagram is an interaction diagram that emphasizes the time ordering of messages; a communication diagram is an interaction diagram that emphasizes the structural organization of the objects that send and receive messages.
You use interaction diagrams to model the dynamic aspects of a system. For the most part, this involves modeling concrete or prototypical instances of classes, interfaces, components, and nodes, along with the messages that are dispatched among them, all in the context of a scenario that illustrates a behavior. Interaction diagrams may stand alone to visualize, specify, construct, and document the dynamics of a particular society of objects, or they may be used to model one particular flow of control of a use case.
Interaction diagrams are not only important for modeling the dynamic aspects of a system, but also for constructing executable systems through forward and reverse engineering.
When you watch a movie projected from film or broadcast on television, your mind actually plays tricks on you. Instead of seeing continuous motion as you would in live action, you really see a series of static images played back to you fast enough to give the illusion of continuous motion.
When directors and animators plan a film, they use the same technique but at lower fidelity. By storyboarding key frames, they build up a model of each scene, sufficient in detail to communicate the intent to all the stakeholders on the production team. In fact, creating this storyboard is a major activity in the production process, helping the team visualize, specify, construct, and document a model of the movie as it evolves from inception through construction and finally deployment.
In modeling software-intensive systems, you have a similar problem: How do you model its dynamic aspects? Imagine, for a moment, how you might visualize a running system. If you have an interactive debugger attached to the system, you might be able to watch a section of memory and observe how it changes its contents over time. With a bit more focus, you might even monitor several objects of interest. Over time, you'd see the creation of some objects, changes in the value of their attributes, and then the destruction of some of them.
The value of visualizing the dynamic aspects of a system this way is quite limited, especially if you are talking about a distributed system with multiple concurrent flows of control. You might as well try to understand the human circulatory system by looking at the blood that passes through one point in one artery over time. A better way to model the dynamic aspects of a system is by building up storyboards of scenarios, involving the interaction of certain interesting objects and the messages that may be dispatched among them.
In the UML, you model these storyboards by using interaction diagrams. As Figure 19-1 shows, you can build up these storyboards in two ways: by emphasizing the time ordering of messages and by emphasizing the structural relationships among the objects that interact. Either way, the diagrams are semantically equivalent; you can convert one to the other without loss of information.

An interaction diagram shows an interaction, consisting of a set of objects and their relationships, including the messages that may be dispatched among them. A sequence diagram is an interaction diagram that emphasizes the time ordering of messages. Graphically, a sequence diagram is a table that shows objects arranged along the X axis and messages, ordered in increasing time, along the Y axis. A communication diagram is an interaction diagram that emphasizes the structural organization of the objects that send and receive messages. Graphically, a communication diagram is a collection of vertices and arcs.
An interaction diagram is just a special kind of diagram and shares the same common properties as do all other diagrams—a name and graphical contents that are a projection into a model. What distinguishes an interaction diagram from all other kinds of diagrams is its particular content.
Interaction diagrams commonly contain
Roles or objects
Communications or links
Messages
Note
An interaction diagram is basically a projection of the elements found in an interaction. The semantics of an interaction's context, objects and roles, links and connectors, messages, and sequencing apply to interaction diagrams.
Like all other diagrams, interaction diagrams may contain notes and constraints.
A sequence diagram emphasizes the time ordering of messages. As Figure 19-2 shows, you form a sequence diagram by first placing the objects or roles that participate in the interaction at the top of your diagram, across the horizontal axis. Typically, you place the object or role that initiates the interaction at the left, and increasingly more subordinate objects or roles to the right. Next, you arrange the messages that these objects send and receive along the vertical axis in order of increasing time from top to bottom. This gives the reader a clear visual cue to the flow of control over time.
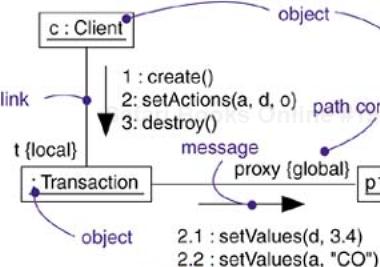
Sequence diagrams have two features that distinguish them from communication diagrams. First, there is the lifeline. An object lifeline is the vertical dashed line that represents the existence of an object over a period of time. Most objects that appear in an interaction diagram will be in existence for the duration of the interaction, so these objects are all aligned at the top of the diagram, with their lifelines drawn from the top of the diagram to the bottom. Objects may be created during the interaction. Their lifelines start with the receipt of the message create (drawn to box at the head of the lifeline). Objects may be destroyed during the interaction. Their lifelines end with the receipt of the message destroy (and are given the visual cue of a large X, marking the end of their lives).
If the interaction represents the history of specific, individual objects, then object symbols with underlined names are placed at the head of the lifelines. Most of the time, however, you will be showing prototypical interactions. The lifelines do not represent specific objects; they represent prototypical roles that represent different objects in each instance of the interaction. In that normal case, you do not underline the names, as they are not specific objects.
Note
If an object changes the values of its attributes, its state, or its roles, you can place a state icon on its lifeline at the point that the change occurs, showing those modifications.
Second, there is the focus of control. The focus of control is a tall, thin rectangle that shows the period of time during which an object is performing an action, either directly or through a subordinate procedure. The top of the rectangle is aligned with the start of the action; the bottom is aligned with its completion (and can be marked by a return message). You can show the nesting of a focus of control (caused by recursion, a call to a self-operation, or by a callback from another object) by stacking another focus of control slightly to the right of its parent (and can do so to an arbitrary depth). If you want to be especially precise about where the focus of control lies, you can also shade the region of the rectangle during which the object's method is actually computing and control has not passed to another object, but this is rather fussy.
The main content in a sequence diagram is the messages. A message is shown by an arrow from one lifeline to another. The arrowhead points to the receiver. If the message is asynchronous, the line has a stick arrowhead. If the message is synchronous (a call), the line has a filled triangular arrowhead. A reply to a synchronous message (a return from a call) is shown by a dashed arrow with a stick arrowhead. The return message may be omitted, as there is an implicit return after any call, but it is often useful for showing return values.
The ordering of time along a single lifeline is significant. Usually the exact distance does not matter; lifelines only show relative sequences, so the lifeline is not a scale diagram of time. Usually the positions of messages on separate pairs of lifelines do not imply any sequencing information; the messages could occur in any order. The entire set of messages on separate lifelines forms a partial ordering. A series of messages establishes a chain of causality, however, so that any point on another lifeline at the end of the chain must always follow the point on the original lifeline at the start of the chain.
A sequence of messages is fine for showing a single, linear sequence, but often we need to show conditionals and loops. Sometimes we want to show concurrent execution of multiple sequences. This kind of high-level control can be shown using structured control operators in sequence diagrams.
A control operator is shown as a rectangular region within the sequence diagram. It has a tag—a text label inside a small pentagon in the upper left corner—to tell what kind of a control operator it is. The operator applies to the lifelines that cross it. This is considered the body of the operator. If a lifeline does not apply to the operator, it may be interrupted at the top of the control operator and resumed at the bottom. The following kinds of control are the most common:
The tag is opt. The body of the control operator is executed if a guard condition is true when the operator is entered. The guard condition is a Boolean expression that may appear in square brackets at the top of any one lifeline within the body and may reference attributes of that object.
The tag is alt. The body of the control operator is divided into multiple subregions by horizontal dashed lines. Each subregion represents one branch of a conditional. Each subregion has a guard condition. If the guard condition for a subregion is true, the subregion is executed. However, at most one subregion may be executed; if more than one guard condition is true, the choice of subregion is nondeterministic and could vary from execution to execution. If no guard condition is true, then control continues past the control operator. One subregion may have a the special guard condition [else]; this subregion is executed if none of the other guard conditions are true.
The tag is par. The body of the control operator is divided into multiple subregions by horizontal dashed lines. Each subregion represents a parallel (concurrent) computation. In most cases, each subregion involves different lifelines. When the control operator is entered, all of the subregions execute concurrently. The execution of the messages in each subregion is sequential, but the relative order of messages in parallel subregions is completely arbitrary. This construct should not be used if the different computations interact. There are very many real-world situations that decompose into independent, parallel activities, however, so this is a very useful operator.
The tag is loop. A guard condition appears at the top of one lifeline within the body. The body of the loop is executed repeatedly as long as the guard condition is true before each iteration. When the guard condition is false at the top of the body, control passes out of the control operator.
There are many other kinds of operators, but these are the most useful.
To provide a clear indication of the boundary, a sequence diagram may be enclosed in a rectangle, with a tag in the upper left corner. The tag is sd, which may be followed by the name of the diagram.
Figure 19-3 shows a simplified example that illustrates some control operators. The user initiates the sequence. The first operator is a loop operator. The numbers in parentheses (1,3) indicate the minimum and maximum number of times the loop body must be executed. Since the minimum is one, the body is always executed at least once before the condition is tested. In the loop, the user enters the password and the system verifies it. The loop continues as long as the password is incorrect. However, after three tries, the loop terminates in any case.

The next operator is an optional operator. The optional body is executed if the password is valid; otherwise the rest of the sequence diagram is skipped. The optional body contains a parallel operator. Operators can be nested as shown.
The parallel operator has two subregions: one allows the user to enter an account and the other allows the user to enter an amount. Because they are parallel, there is no required order for making the two entries; they can occur in either order. This emphasizes that concurrency does not always imply physically simultaneous execution. Concurrency really means that two actions are uncoordinated and can happen in any order. If they are truly independent actions, they can overlap; if they are sequential actions, they can occur in any order.
Once both actions have been performed, the parallel operator is complete. In the next action within the optional operator, the bank delivers cash to the user. The sequence diagram is now complete.
Activity diagrams that are too large can be difficult to understand. Structured sections of an activity can be organized into a subordinate activity, especially if the subordinate activity is used more than once within the main activity. The main activity and the subordinate activities are shown on separate diagrams. Within the main activity diagram, a use of a subordinate activity is shown by a rectangle with the tag ref in its upper left corner; the name of the subordinate behavior is shown in the box. The subordinate behavior is not restricted to an activity diagram; it could also be a state machine, sequence diagram, or other behavioral specification. Figure 19-4 shows the diagram from Figure 19-3 rearranged by moving two sections into separate activity diagrams and referencing them from the main diagram.
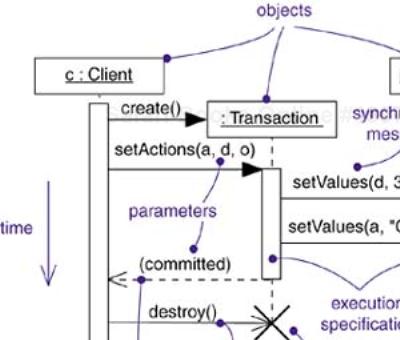
A communication diagram emphasizes the organization of the objects that participate in an interaction. As Figure 19-5 shows, you form a communication diagram by first placing the objects that participate in the interaction as the vertices in a graph. Next, you render the links that connect these objects as the arcs of this graph. The links may have rolenames to identify them. Finally, you adorn these links with the messages that objects send and receive. This gives the reader a clear visual cue to the flow of control in the context of the structural organization of objects that collaborate.
Note
Unlike a sequence diagram, you don't show the lifeline of an object explicitly in a communication diagram, although you can show both create and destroy messages. In addition, you don't show the focus of control explicitly in a communication diagram, although the sequence number on each message can indicate nesting.
Communication diagrams have two features that distinguish them from sequence diagrams. First, there is the path. You render a path corresponding to an association. You also render paths corresponding to local variables, parameters, global variables, and self access. A path represents a source of knowledge to an object.
Second, there is the sequence number. To indicate the time order of a message, you prefix the message with a number (starting with the message numbered 1), increasing monotonically for each new message in the flow of control (2, 3, and so on). To show nesting, you use Dewey decimal numbering (1 is the first message, which contains message 1.1 and message 1.2, and so on). You can show nesting to an arbitrary depth. Note also that, along the same link, you can show many messages (possibly being sent from different directions), and each will have a unique sequence number.
Most of the time you'll model straight, sequential flows of control. However, you can also model more-complex flows involving iteration and branching. An iteration represents a repeated sequence of messages. To model an iteration, you prefix the sequence number of a message with an iteration expression such as *[i := 1..n] (or just * if you want to indicate iteration but don't want to specify its details). An iteration indicates that the message (and any nested messages) will be repeated in accordance with the given expression. Similarly, a condition represents a message whose execution is contingent on the evaluation of a Boolean condition. To model a condition, you prefix the sequence number of a message with a condition clause, such as [x > 0]. The alternate paths of a branch will have the same sequence number, but each path must be uniquely distinguishable by a nonoverlapping condition.
For both iteration and branching, the UML does not prescribe the format of the expression inside the brackets; you can use pseudocode or the syntax of a specific programming language.
Note
You don't show the links among objects explicitly in a sequence diagram. You don't show the sequence number of a message in a sequence diagram explicitly either: It is implicit in the physical ordering of messages from top to bottom of the diagram. You can show iteration and branching, however, using sequence diagram control structures.
Because they both derive from the same information in the UML's metamodel, sequence diagrams and communication diagrams are semantically equivalent. As a result, you can take a diagram in one form and convert it to the other without any loss of information, as you can see in the previous two figures, which are semantically equivalent. However, this does not mean that both diagrams will explicitly visualize the same information. For example, in the previous two figures, the communication diagram shows how the objects are linked (note the {local} and {global} annotations); the corresponding sequence diagram does not. Similarly, the sequence diagram shows message return (note the return value committed), but the corresponding communication diagram does not. In both cases, the two diagrams share the same underlying model, but each may render some things the other does not. However, a model entered in one format may lack some of the information shown on the other format, so although the underlying model can include both kinds of information, the two kinds of diagrams may lead to different models.
You use interaction diagrams to model the dynamic aspects of a system. These dynamic aspects may involve the interaction of any kind of instance in any view of a system's architecture, including instances of classes (including active classes), interfaces, components, and nodes.
When you use an interaction diagram to model some dynamic aspect of a system, you do so in the context of the system as a whole, a subsystem, an operation, or a class. You can also attach interaction diagrams to use cases (to model a scenario) and to collaborations (to model the dynamic aspects of a society of objects).
When you model the dynamic aspects of a system, you typically use interaction diagrams in two ways.
Here you'll use sequence diagrams. Modeling a flow of control by time ordering emphasizes the passing of messages as they unfold over time, which is a particularly useful way to visualize dynamic behavior in the context of a use case scenario. Sequence diagrams do a better job of visualizing simple iteration and branching than do communication diagrams.
Here you'll use communication diagrams. Modeling a flow of control by organization emphasizes the structural relationships among the instances in the interaction, along which messages may be passed.
Consider the objects that live in the context of a system, subsystem, operation or class. Consider also the objects and roles that participate in a use case or collaboration. To model a flow of control that winds through these objects and roles, you use an interaction diagram; to emphasize the passing of messages as they unfold over time, you use a sequence diagram, a kind of interaction diagram.
To model a flow of control by time ordering,
Set the context for the interaction, whether it is a system, subsystem, operation, or class, or one scenario of a use case or collaboration.
Set the stage for the interaction by identifying which objects play a role in the interaction. Lay them out on the sequence diagram from left to right, placing the more important objects to the left and their neighboring objects to the right.
Set the lifeline for each object. In most cases, objects will persist through the entire interaction. For those objects that are created and destroyed during the interaction, set their lifelines, as appropriate, and explicitly indicate their birth and death with appropriately stereotyped messages.
Starting with the message that initiates this interaction, lay out each subsequent message from top to bottom between the lifelines, showing each message's properties (such as its parameters), as necessary to explain the semantics of the interaction.
If you need to visualize the nesting of messages or the points in time when actual computation is taking place, adorn each object's lifeline with its focus of control.
If you need to specify time or space constraints, adorn each message with a timing mark and attach suitable time or space constraints.
If you need to specify this flow of control more formally, attach pre- and postconditions to each message.
A single sequence diagram can show only one thread of control (although you can show structured concurrency by using the structured control constructs). Typically, you'll have a number of interaction diagrams, some of which are primary and others that show alternative paths or exceptional conditions. You can use packages to organize these collections of sequence diagrams, giving each diagram a suitable name to distinguish it from its siblings.
For example, Figure 19-6 shows a sequence diagram that specifies the flow of control involved in initiating a simple, two-party phone call. At this level of abstraction, there are four roles involved: two Callers (s and r); an unnamed telephone Switch; and c, the reification of the Conversation between the two parties. Note that the diagram models the four roles; each instance of the diagram has particular objects bound to each of the roles. The same pattern of interaction applies to every instance of the diagram.
The sequence begins with one Caller (s) dispatching a signal (liftReceiver) to the Switch object. In turn, the Switch sends setDialTone to the Caller, and the Caller iterates on the message dialDigit. Note that this sequence must be less than 30 seconds, as specified by the constraint. This diagram does not indicate what happens if this time constraint is violated. To show that, you could include a branch or a completely separate sequence diagram. The Switch object then calls itself to perform the routeCall operation. It then creates a Conversation object (c), to which it delegates the rest of the work. Although not shown in this interaction, c would have the additional responsibility of being a party in the switch's billing mechanism (which would be expressed in another interaction diagram). The Conversation object (c) rings the Caller (r), who asynchronously sends the message liftReceiver. The Conversation object then tells the Switch to connect the call, then tells both Caller objects to connect, after which they may exchange information, as indicated by the attached note.
An interaction diagram can begin or end at any point of a sequence. A complete trace of the flow of control would be incredibly complex, so it's reasonable to break up parts of a larger flow into separate diagrams.
Consider the objects that live in the context of a system, subsystem, operation, or class. Consider also the objects and roles that participate in a use case or collaboration. To model a flow of control that winds through these objects and roles, you use an interaction diagram; to show the passing of messages in the context of that structure, you use a communication diagram, a kind of interaction diagram.
To model a flow of control by organization,
Set the context for the interaction, whether it is a system, subsystem, operation, or class, or one scenario of a use case or collaboration.
Set the stage for the interaction by identifying which objects play a role in the interaction. Lay them out on the communication diagram as vertices in a graph, placing the more important objects in the center of the diagram and their neighboring objects to the outside.
Specify the links among these objects, along which messages may pass.
Lay out the association links first; these are the most important ones, because they represent structural connections.
Lay out other links next, and adorn them with suitable path annotations (such as
globalandlocal) to explicitly specify how these objects are related to one another.
Starting with the message that initiates this interaction, attach each subsequent message to the appropriate link, setting its sequence number, as appropriate. Show nesting by using Dewey decimal numbering.
If you need to specify time or space constraints, adorn each message with a timing mark and attach suitable time or space constraints.
If you need to specify this flow of control more formally, attach pre- and postconditions to each message.
As with sequence diagrams, a single communication diagram can show only one flow of control (although you can show simple variations by using the UML's notation for interaction and branching). Typically, you'll have a number of such interaction diagrams, some of which are primary and others that show alternative paths or exceptional conditions. You can use packages to organize these collections of communication diagrams, giving each diagram a suitable name to distinguish it from its siblings.
For example, Figure 19-7 shows a communication diagram that specifies the flow of control involved in registering a new student at a school, with an emphasis on the structural relationships among these objects. You see four roles: a RegistrarAgent (r), a Student (s), a Course (c), and an unnamed School role. The flow of control is numbered explicitly. Action begins with the RegistrarAgent creating a Student object, adding the student to the school (the message addStudent), then telling the Student object to register itself. The Student object then invokes getSchedule on itself, obtaining a set of Course objects for which it must register. For each course object in the set, the Student object then adds itself to each Course object.
Forward engineering (the creation of code from a model) is possible for both sequence and communication diagrams, especially if the context of the diagram is an operation. For example, using the previous communication diagram, a reasonably clever forward engineering tool could generate the following Java code for the operation register, attached to the Student class.
public void register() {
 CourseCollection courses = getSchedule();
 for (int i = 0; i < courses.size(); i++)
  courses.item(i).add(this);
 this.registered = true;
}
“Reasonably clever” means the tool would have to realize that getSchedule returns a CourseCollection object, which it could determine by looking at the operation's signature. By walking across the contents of this object using a standard iteration idiom (which the tool could know about implicitly), the code could then generalize to any number of course offerings.
Reverse engineering (the creation of a model from code) is also possible for both sequence and communication diagrams, especially if the context of the code is the body of an operation. Segments of the previous diagram could have been produced by a tool from a prototypical execution of the register operation.
Note
Forward engineering is straightforward; reverse engineering is hard. It's easy to get too much information from simple reverse engineering, so the hard part is being clever about what details to keep.
However, more interesting than the reverse engineering of a model from code is the animation of a model against the execution of a deployed system. For example, given the previous diagram, a tool could animate the messages in the diagram as they were dispatched in a running system. Even better, with this tool under the control of a debugger, you could control the speed of execution, possibly setting breakpoints to stop the action at interesting points to examine the attribute values of individual objects.
When you create interaction diagrams in the UML, remember that sequence diagrams and communication diagrams are both projections on the same model of a system's dynamic aspects. No single interaction diagram can capture everything about a system's dynamic aspects. Rather, you'll want to use many interaction diagrams to model the dynamics of the system as a whole, as well as its subsystems, operations, classes, use cases, and collaborations.
A well-structured interaction diagram
Is focused on communicating one aspect of a system's dynamics.
Contains only those elements that are essential to understanding that aspect.
Provides detail consistent with its level of abstraction and should expose only those adornments that are essential to understanding.
Is not so minimalist that it misinforms the reader about semantics that are important.
When you draw an interaction diagram,
Give it a name that communicates its purpose.
Use a sequence diagram if you want to emphasize the time ordering of messages. Use a communication diagram if you want to emphasize the organization of the objects involved in the interaction.
Lay out its elements to minimize lines that cross.
Use notes and color as visual cues to draw attention to important features of your diagram.
Use branching sparingly; you can represent complex branching much better using activity diagrams.