
The back end is the more interesting part of the GPU pipeline, as many more graphical effects take place during this stage. Consequently, it is the stage that is significantly more likely to suffer from bottlenecks.
There are two brute force tests we can attempt:
- Reduce resolution
- Reduce texture quality
These changes will ease the workload during two important stages at the back end of the pipeline: fill rate and memory bandwidth, respectively. Fill rate tends to be the most common source of bottlenecks in the modern era of graphics rendering, so we will cover it first.
By reducing screen resolution, we have asked the rasterization system to generate significantly fewer fragments and transpose them over a smaller canvas of pixels. This will reduce the fill rate consumption of the application, giving a key part of the rendering pipeline some additional breathing room. Ergo, if performance suddenly improves with a screen resolution reduction, then fill rate should be our primary concern.
Fill rate is a very broad term referring to the speed at which the GPU can draw fragments. But, this only includes fragments that have survived all of the various conditional tests we might have enabled within the given Shader. A fragment is merely a "potential pixel," and if it fails any of the enabled tests, then it is immediately discarded. This can be an enormous performance-saver as the pipeline can skip the costly drawing step and begin work on the next fragment instead.
One such example is Z-testing, which checks whether the fragment from a closer object has already been drawn to the same pixel already. If so, then the current fragment is discarded. If not, then the fragment is pushed through the Fragment Shader and drawn over the target pixel, which consumes exactly one draw from our fill rate. Now imagine multiplying this process by thousands of overlapping objects, each generating hundreds or thousands of possible fragments, for high screen resolutions causing millions, or billions, of fragments to be generated each and every frame. It should be fairly obvious that skipping as many of these draws as we can will result in big rendering cost savings.
Graphics card manufacturers typically advertise a particular fill rate as a feature of the card, usually in the form of gigapixels per second, but this is a bit of a misnomer, as it would be more accurate to call it gigafragments per second; however this argument is mostly academic. Either way, larger values tell us that the device can potentially push more fragments through the pipeline, so with a budget of 30 GPix/s and a target frame rate of 60 Hz, we can afford to process 30,000,000,000/60 = 500 million fragments per frame before being bottlenecked on fill rate. With a resolution of 2560x1440, and a best-case scenario where each pixel is only drawn over once, then we could theoretically draw the entire scene about 125 times without any noticeable problems.
Sadly, this is not a perfect world, and unless we take significant steps to avoid it, we will always end up with some amount of redraw over the same pixels due to the order in which objects are rendered. This is known as overdraw, and it can be very costly if we're not careful.
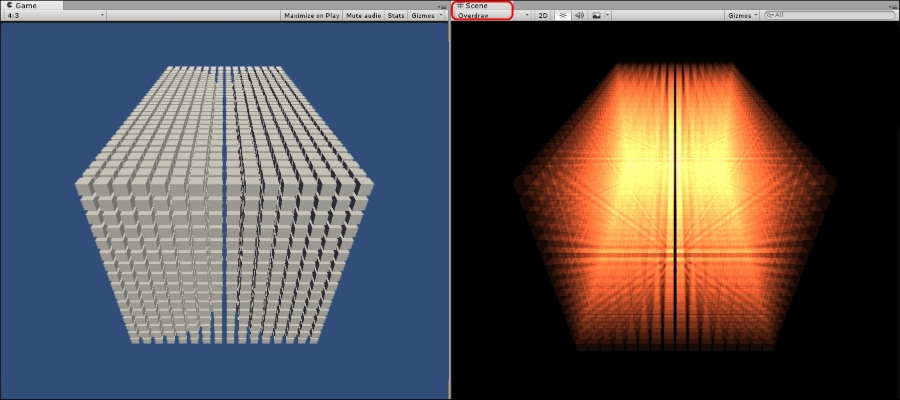
Determining how much overdraw we have can be represented visually by rendering all objects with additive alpha blending and a very transparent flat color. Areas of high overdraw will show up more brightly as the same pixel is drawn over with additive blending multiple times. This is precisely how the Scene view's Overdraw shading mode reveals how much overdraw our scene is suffering.
The following screenshot shows a scene with several thousand boxes drawn normally, and drawn using the Scene view's Overdraw shading mode:
At the end of the day, fill rate is provided as a means of gauging the best-case behavior. In other words, it's primarily a marketing term and mostly theoretical. But, the technical side of the industry has adopted the term as a way of describing the back end of the pipeline: the stage where fragment data is funneled through our Shaders and drawn to the screen.
If every fragment required an absolute minimum level of processing (such as a Shader that returned a constant color), then we might get close to that theoretical maximum. The GPU is a complex beast, however, and things are never so simple. The nature of the device means it works best when given many small tasks to perform. But, if the tasks get too large, then fill rate is lost due to the back end not being able to push through enough fragments in time and the rest of the pipeline is left waiting for tasks to do.
There are several more features that can potentially consume our theoretical fill rate maximum, including but not limited to alpha testing, alpha blending, texture sampling, the amount of fragment data being pulled through our Shaders, and even the color format of the target render texture (the final Frame Buffer in most cases). The bad news is that this gives us a lot of subsections to cover, and a lot of ways to break the process, but the good news is it gives us a lot of avenues to explore to improve our fill rate usage.
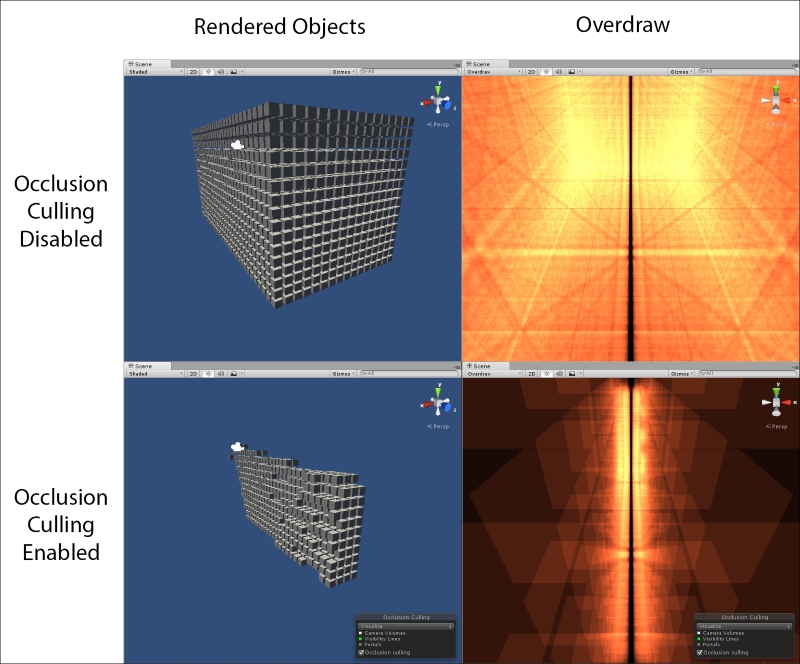
One of the best ways to reduce overdraw is to make use of Unity's Occlusion Culling system. The system works by partitioning Scene space into a series of cells and flying through the world with a virtual camera making note of which cells are invisible from other cells (are occluded) based on the size and position of the objects present.
Note that this is different to the technique of Frustum Culling, which culls objects not visible from the current camera view. This feature is always active in all versions, and objects culled by this process are automatically ignored by the Occlusion Culling system.
Occlusion Culling data can only be generated for objects properly labeled Occluder Static and Occludee Static under the StaticFlags dropdown. Occluder Static is the general setting for static objects where we want it to hide other objects, and be hidden by large objects in its way. Occludee Static is a special case for transparent objects that allows objects behind them to be rendered, but we want them to be hidden if something large blocks their visibility.
Naturally, because one of the static flags must be enabled for Occlusion Culling, this feature will not work for dynamic objects.
The following screenshot shows how effective Occlusion Culling can be at reducing the number of visible objects in our Scene:
This feature will cost us in both application footprint and incur some runtime costs. It will cost RAM to keep the Occlusion Culling data structure in memory, and there will be a CPU processing cost to determine which objects are being occluded in each frame.
The Occlusion Culling data structure must be properly configured to create cells of the appropriate size for our Scene, and the smaller the cells, the longer it takes to generate the data structure. But, if it is configured correctly for the Scene, Occlusion Culling can provide both fill rate savings through reduced overdraw, and Draw Call savings by culling non-visible objects.
Shaders can be a significant fill rate consumer, depending on their complexity, how much texture sampling takes place, how many mathematical functions are used, and so on. Shaders do not directly consume fill rate, but do so indirectly because the GPU must calculate or fetch data from memory during Shader processing. The GPU's parallel nature means any bottleneck in a thread will limit how many fragments can be pushed into the thread at a later date, but parallelizing the task (sharing small pieces of the job between several agents) provides a net gain over serial processing (one agent handling each task one after another).
The classic example is a vehicle assembly line. A complete vehicle requires multiple stages of manufacture to complete. The critical path to completion might involve five steps: stamping, welding, painting, assembly, and inspection, and each step is completed by a single team. For any given vehicle, no stage can begin before the previous one is finished, but whatever team handled the stamping for the last vehicle can begin stamping for the next vehicle as soon as it has finished. This organization allows each team to become masters of their particular domain, rather than trying to spread their knowledge too thin, which would likely result in less consistent quality in the batch of vehicles.
We can double the overall output by doubling the number of teams, but if any team gets blocked, then precious time is lost for any given vehicle, as well as all future vehicles that would pass through the same team. If these delays are rare, then they can be negligible in the grand scheme, but if not, and one stage takes several minutes longer than normal each and every time it must complete the task, then it can become a bottleneck that threatens the release of the entire batch.
The GPU parallel processors work in a similar way: each processor thread is an assembly line, each processing stage is a team, and each fragment is a vehicle. If the thread spends a long time processing a single stage, then time is lost on each fragment. This delay will multiply such that all future fragments coming through the same thread will be delayed. This is a bit of an oversimplification, but it often helps to paint a picture of how poorly optimized Shader code can chew up our fill rate, and how small improvements in Shader optimization provide big benefits in back end performance.
Shader programming and optimization have become a very niche area of game development. Their abstract and highly-specialized nature requires a very different kind of thinking to generate Shader code compared to gameplay and engine code. They often feature mathematical tricks and back-door mechanisms for pulling data into the Shader, such as precomputing values in texture files. Because of this, and the importance of optimization, Shaders tend to be very difficult to read and reverse-engineer.
Consequently, many developers rely on prewritten Shaders, or visual Shader creation tools from the Asset Store such as Shader Forge or Shader Sandwich. This simplifies the act of initial Shader code generation, but might not result in the most efficient form of Shaders. If we're relying on pre-written Shaders or tools, we might find it worthwhile to perform some optimization passes over them using some tried-and-true techniques. So, let's focus on some easily reachable ways of optimizing our Shaders.
The built-in mobile Shaders in Unity do not have any specific restrictions that force them to only be used on mobile devices. They are simply optimized for minimum resource usage (and tend to feature some of the other optimizations listed in this section).
Desktop applications are perfectly capable of using these Shaders, but they tend to feature a loss of graphical quality. It only becomes a question of whether the loss of graphical quality is acceptable. So, consider doing some testing with the mobile equivalents of common Shaders to see whether they are a good fit for your game.
GPUs can calculate with smaller data types more quickly than larger types (particularly on mobile platforms!), so the first tweak we can attempt is replacing our float data types (32-bit, floating point) with smaller versions such as half (16-bit, floating point), or even fixed (12-bit, fixed point).
Color values are good candidates for precision reduction, as we can often get away with less precise color values without any noticeable loss in coloration. However, the effects of reducing precision can be very unpredictable for graphical calculations. So, changes such as these can require some testing to verify whether the reduced precision is costing too much graphical fidelity.
Note that the effects of these tweaks can vary enormously between one GPU architecture and another (for example, AMD versus Nvidia versus Intel), and even GPU brands from the same manufacturer. In some cases, we can make some decent performance gains for a trivial amount of effort. In other cases, we might see no benefit at all.
Swizzling is the Shader programming technique of creating a new vector (an array of values) from an existing vector by listing the components in the order in which we wish to copy them into the new structure. Here are some examples of swizzling:
float4 input = float4(1.0, 2.0, 3.0, 4.0);  // initial test value

float2 val1 = input.yz;  // swizzle two components

float3 val2 = input.zyx;  // swizzle three components in a different order

float4 val3 = input.yyy;  // swizzle the same component multiple times

float sclr = input.w;
float3 val4 = sclr.xxx  // swizzle a scalar multiple times
We can use both the xyzw and rgba representations to refer to the same components, sequentially. It does not matter whether it is a color or vector; they just make the Shader code easier to read. We can also list components in any order we like to fill in the desired data, repeating them if necessary.
Converting from one precision type to another in a Shader can be a costly operation, but converting the precision type while simultaneously swizzling can be particularly painful. If we have mathematical operations that rely on being swizzled into different precision types, it would be wiser if we simply absorbed the high-precision cost from the very beginning, or reduced precision across the board to avoid the need for changes in precision.
The Shader compiler often performs a good job of reducing mathematical calculations down to an optimized version for the GPU, but compiled custom code is unlikely to be as effective as both the Cg library's built-in helper functions and the additional helpers provided by the Unity Cg included files. If we are using Shaders that include custom function code, perhaps we can find an equivalent helper function within the Cg or Unity libraries that can do a better job than our custom code can.
These extra include files can be added to our Shader within the CGPROGRAM block like so:
CGPROGRAM
// other includes
#include "UnityCG.cginc"
// Shader code here
ENDCG
Example Cg library functions to use are abs() for absolute values, lerp() for linear interpolation, mul() for multiplying matrices, and step() for step functionality. Useful UnityCG.cginc functions include WorldSpaceViewDir() for calculating the direction towards the camera, and Luminance() for converting a color to grayscale.
Note
Check the following URL for a full list of Cg standard library functions: http.developer.nvidia.com/CgTutorial/cg_tutorial_appendix_e.html.
Check the Unity documentation for a complete and up-to-date list of possible include files and their accompanying helper functions: http://docs.unity3d.com/Manual/SL-BuiltinIncludes.html.
Perhaps we can make savings by simply disabling Shader features that aren't vital. Does the Shader really need multiple passes, transparency, Z-writing, alpha-testing, and/or alpha blending? Will tweaking these settings or removing these features give us a good approximation of our desired effect without losing too much graphical fidelity? Making such changes is a good way of making fill rate cost savings.
Sometimes the process of writing a Shader involves a lot of back and forth experimentation in editing code and viewing it in the Scene. The typical result of this is that input data that was needed when the Shader was going through early development is now surplus fluff once the desired effect has been obtained, and it's easy to forget what changes were made when/if the process drags on for a long time. But, these redundant data values can cost the GPU valuable time as they must be fetched from memory even if they are not explicitly used by the Shader. So, we should double check our Shaders to ensure all of their input geometry, vertex, and fragment data is actually being used.
Exposing unnecessary variables from our Shader to the accompanying Material(s) can be costly as the GPU can't assume these values are constant. This means the Shader code cannot be compiled into a more optimized form. This data must be pushed from the CPU with every pass since they can be modified at any time through the Material's methods such as SetColor(), SetFloat(), and so on. If we find that, towards the end of the project, we always use the same value for these variables, then they can be replaced with a constant in the Shader to remove such excess runtime workload. The only cost is obfuscating what could be critical graphical effect parameters, so this should be done very late in the process.
Complicated mathematics can severely bottleneck the rendering process, so we should do whatever we can to limit the damage. Complex mathematical functions could be replaced with a texture that is fed into the Shader and provides a pre-generated table for runtime lookup. We may not see any improvement with functions such as sin and cos, since they've been heavily optimized to make use of GPU architecture, but complex methods such as pow, exp, log, and other custom mathematical processes can only be optimized so much, and would be good candidates for simplification. This is assuming we only need one or two input values, which are represented through the X and Y coordinates of the texture, and mathematical accuracy isn't of paramount importance.
This will cost us additional graphics memory to store the texture at runtime (more on this later), but if the Shader is already receiving a texture (which they are in most cases) and the alpha channel is not being used, then we could sneak the data in through the texture's alpha channel, costing us literally no performance, and the rest of the Shader code and graphics system would be none-the-wiser. This will involve the customization of art assets to include such data in any unused color channel(s), requiring coordination between programmers and artists, but is a very good way of saving Shader processing costs with no runtime sacrifices.
In fact, Material properties and textures are both excellent entry points for pushing work from the Shader (the GPU) onto the CPU. If a complex calculation does not need to vary on a per pixel basis, then we could expose the value as a property in the Material, and modify it as needed (accepting the overhead cost of doing so from the previous section Only expose necessary variables). Alternatively, if the result varies per pixel, and does not need to change often, then we could generate a texture file from script code, containing the results of the calculations in the RGBA values, and pulling the texture into the Shader. Lots of opportunities arise when we ignore the conventional application of such systems, and remember to think of them as just raw data being transferred around.
While we're on the subject of texture lookups, they are not trivial tasks for the GPU to process and they have their own overhead costs. They are the most common cause of memory access problems within the GPU, especially if a Shader is performing samples across multiple textures, or even multiple samples across a single texture, as they will likely inflict cache misses in memory. Such situations should be simplified as much as possible to avoid severe GPU memory bottlenecking.
Even worse, sampling a texture in a random order would likely result in some very costly cache misses for the GPU to suffer through, so if this is being done, then the texture should be reordered so that it can be sampled in a more sequential order.
In modern day CPU architecture, conditional statements undergo a lot of clever predictive techniques to make use of instruction-level parallelism. This is a feature where the CPU attempts to predict which direction a conditional statement will go in before it has actually been resolved, and speculatively begins processing the most likely result of the conditional using any free components that aren't being used to resolve the conditional (fetching some data from memory, copying some floats into unused registers, and so on). If it turns out that the decision is wrong, then the current result is discarded and the proper path is taken instead.
So long as the cost of speculative processing and discarding false results is less than the time spent waiting to decide the correct path, and it is right more often than it is wrong, then this is a net gain for the CPU's speed.
However, this feature is not possible on GPU architecture because of its parallel nature. The GPU's cores are typically managed by some higher-level construct that instructs all cores under its command to perform the same machine-code-level instruction simultaneously. So, if the Fragment Shader requires a float to be multiplied by 2, then the process will begin by having all cores copy data into the appropriate registers in one coordinated step. Only when all cores have finished copying to the registers will the cores be instructed to begin the second step: multiplying all registers by 2.
Thus, when this system stumbles into a conditional statement, it cannot resolve the two statements independently. It must determine how many of its child cores will go down each path of the conditional, grab the list of required machine code instructions for one path, resolve them for all cores taking that path, and repeat for each path until all possible paths have been processed. So, for an if-else statement (two possibilities), it will tell one group of cores to process the "true" path, then ask the remaining cores to process the "false" path. Unless every core takes the same path, it must process both paths every time.
So, we should avoid branching and conditional statements in our Shader code. Of course, this depends on how essential the conditional is to achieving the graphical effect we desire. But, if the conditional is not dependent on per pixel behavior, then we would often be better off absorbing the cost of unnecessary mathematics than inflicting a branching cost on the GPU. For example, we might be checking whether a value is non-zero before using it in a calculation, or comparing against some global flag in the Material before taking one action or another. Both of these cases would be good candidates for optimization by removing the conditional check.
The compiler will try its best to optimize our Shader code into the more GPU-friendly low-level language so that it is not waiting on data to be fetched when it could be processing some other task. For example, the following poorly-optimized code, could be written in our Shader:
float sum = input.color1.r;
sum = sum + input.color2.g;
sum = sum + input.color3.b;
sum = sum + input.color4.a;
float result = calculateSomething(sum);
If we were able to force the Shader compiler to compile this code into machine code instructions as it is written, then this code has a data dependency such that each calculation cannot begin until the last finishes due to the dependency on the sum variable. But, such situations are often detected by the Shader compiler and optimized into a version that uses instruction-level parallelism (the code shown next is the high-level code equivalent of the resulting machine code):
float sum1, sum2, sum3, sum4;
sum1 = input.color1.r;
sum2 = input.color2.g;
sum3 = input.color3.b
sum4 = input.color4.a;
float sum = sum1 + sum2 + sum3 + sum4;
float result = CalculateSomething(sum);
In this case, the compiler would recognize that it can fetch the four values from memory in parallel and complete the summation once all four have been fetched independently via thread-level parallelism. This can save a lot of time, relative to performing the four fetches one after another.
However, long chains of data dependency can absolutely murder Shader performance. If we create a strong data dependency in our Shader's source code, then it has been given no freedom to make such optimizations. For example, the following data dependency would be painful on performance, as one step cannot be completed without waiting on another to fetch data and performing the appropriate calculation.
float4 val1 = tex2D(_tex1, input.texcoord.xy);
float4 val2 = tex2D(_tex2, val1.yz);
float4 val3 = tex2D(_tex3, val2.zw);
Strong data dependencies such as these should be avoided whenever possible.
If we're using Unity's Surface Shaders, which are a way for Unity developers to get to grips with Shader programming in a more simplified fashion, then the Unity Engine takes care of converting our Surface Shader code for us, abstracting away some of the optimization opportunities we have just covered. However, it does provide some miscellaneous values that can be used as replacements, which reduce accuracy but simplify the mathematics in the resulting code. Surface Shaders are designed to handle the general case fairly efficiently, but optimization is best achieved with a personal touch.
The approxview attribute will approximate the view direction, saving costly operations. halfasview will reduce the precision of the view vector, but beware of its effect on mathematical operations involving multiple precision types. noforwardadd will limit the Shader to only considering a single directional light, reducing Draw Calls since the Shader will render in only a single pass, but reducing lighting complexity. Finally, noambient will disable ambient lighting in the Shader, removing some extra mathematical operations that we may not need.
We can force Unity to render distant objects using simpler Shaders, which can be an effective way of saving fill rate, particularly if we're deploying our game onto multiple platforms or supporting a wide range of hardware capability. The LOD keyword can be used in the Shader to set the onscreen size factor that the Shader supports. If the current LOD level does not match this value, it will drop to the next fallback Shader and so on until it finds the Shader that supports the given size factor. We can also change a given Shader object's LOD value at runtime using the maximumLOD property.
This feature is similar to the mesh-based LOD covered earlier, and uses the same LOD values for determining object form factor, so it should be configured as such.
Another major component of back end processing and a potential source of bottlenecks is memory bandwidth. Memory bandwidth is consumed whenever a texture must be pulled from a section of the GPU's main video memory (also known as VRAM). The GPU contains multiple cores that each have access to the same area of VRAM, but they also each contain a much smaller, local Texture Cache that stores the current texture(s) the GPU has been most recently working with. This is similar in design to the multitude of CPU cache levels that allow memory transfer up and down the chain, as a workaround for the fact that faster memory will, invariably, be more expensive to produce, and hence smaller in capacity compared to slower memory.
Whenever a Fragment Shader requests a sample from a texture that is already within the core's local Texture Cache, then it is lightning fast and barely perceivable. But, if a texture sample request is made, that does not yet exist within the Texture Cache, then it must be pulled in from VRAM before it can be sampled. This fetch request risks cache misses within VRAM as it tries to find the relevant texture. The transfer itself consumes a certain amount of memory bandwidth, specifically an amount equal to the total size of the texture file stored within VRAM (which may not be the exact size of the original file, nor the size in RAM, due to GPU-level compression).
It's for this reason that, if we're bottlenecked on memory bandwidth, then performing a brute force test by reducing texture quality would suddenly result in a performance improvement. We've shrunk the size of our textures, easing the burden on the GPU's memory bandwidth, allowing it to fetch the necessary textures much quicker. Globally reducing texture quality can be achieved by going to Edit | Project Settings | Quality | Texture Quality and setting the value to Half Res, Quarter Res, or Eighth Res.
In the event that memory bandwidth is bottlenecked, then the GPU will keep fetching the necessary texture files, but the entire process will be throttled as the Texture Cache waits for the data to appear before processing the fragment. The GPU won't be able to push data back to the Frame Buffer in time to be rendered onto the screen, blocking the whole process and culminating in a poor frame rate.
Ultimately, proper usage of memory bandwidth is a budgeting concern. For example, with a memory bandwidth of 96 GB/sec per core and a target frame rate of 60 frames per second, then the GPU can afford to pull 96/60 = 1.6 GB worth of texture data every frame before being bottlenecked on memory bandwidth.
Tip
Memory bandwidth is often listed on a per core basis, but some GPU manufacturers may try to mislead you by multiplying memory bandwidth by the number of cores in order to list a bigger, but less practical number. Because of this, research may be necessary to confirm the memory bandwidth limit we have for the target GPU hardware is given on a per core basis.
Note that this value is not the maximum limit on the texture data that our game can contain in the project, nor in CPU RAM, not even in VRAM. It is a metric that limits how much texture swapping can occur during one frame. The same texture could be pulled back and forth multiple times in a single frame depending on how many Shaders need to use them, the order that the objects are rendered, and how often texture sampling must occur, so rendering just a few objects could consume whole gigabytes of memory bandwidth if they all require the same high quality, massive textures, require multiple secondary texture maps (normal maps, emission maps, and so on), and are not batched together, because there simply isn't enough Texture Cache space available to keep a single texture file long enough to exploit it during the next rendering pass.
There are several approaches we can take to solve bottlenecks in memory bandwidth.
This approach is simple, straightforward, and always a good idea to consider. Reducing texture quality, either through resolution or bit rate, is not ideal for graphical quality, but we can sometimes get away with using 16-bit textures without any noticeable degradation.
Mip Maps (Chapter 4, Kickstart Your Art) are another excellent way of reducing the amount of texture data being pushed back and forth between VRAM and the Texture Cache. Note that the Scene View has a Mipmaps Shading Mode, which will highlight textures in our scene blue or red depending on whether the current texture scale is appropriate for the current Scene View's camera position and orientation. This will help identify what textures are good candidates for further optimization.
The Texture Compression techniques you learned back in Chapter 4, Kickstart Your Art, were described in such a way that helped reduce our application's footprint (executable file size), and runtime CPU memory usage, that is, the storage area where all texture resource data is kept until it is needed by the GPU. However, once the data reaches the GPU, it uses a different form of compression to keep texture data small. The common formats are DXT, PVRTC, ETC, and ASTC.
To make matters more confusing, each platform and GPU hardware supports different compression formats, and if the device does not support the given compression format, then it will be handled at the software level. In other words, the CPU will need to stop and recompress the texture to the desired format the GPU wants, as opposed to the GPU taking care of it with a specialized hardware chip.
The compression options are only available if a texture resource has its Texture Type field set to Advanced. Using any of the other texture type settings will simplify the choices, and Unity will make a best guess when deciding which format to use for the target platform, which may not be ideal for a given piece of hardware and thus will consume more memory bandwidth than necessary.
The best approach to determining the correct format is to simply test a bunch of different devices and Texture Compression techniques and find one that fits. For example, common wisdom says that ETC is the best choice for Android since more devices support it, but some developers have found their game works better with the DXT and PVRTC formats on certain devices.
Beware that, if we're at the point where individually tweaking Texture Compression techniques is necessary, then hopefully we have exhausted all other options for reducing memory bandwidth. By going down this road, we could be committing to supporting many different devices each in their own specific way. Many of us would prefer to keep things simple with a general solution instead of personal customization and time-consuming handiwork to work around problems like this.
Can we modify our Shaders to remove some texture sampling overhead? Did we add some extra texture lookup files to give ourselves some fill rate savings on mathematical functions? If so, we might want to consider lowering the resolution of such textures or reverting the changes and solving our fill rate problems in other ways. Essentially, the less texture sampling we do, the less often we need to use memory bandwidth and the closer we get to resolving the bottleneck.
This approach basically comes back to Batching and Atlasing again. Are there opportunities to batch some of our biggest texture files together? If so, then we could save the GPU from having to pull in the same texture files over and over again during the same frame. As a last resort, we could look for ways to remove some textures from the entire project and reuse similar files. For instance, if we have fill rate budget to spare, then we may be able to use some Fragment Shaders to make a handful of textures files appear in our game with different color variations.
One last consideration related to textures is how much VRAM we have available. Most texture transfer from CPU to GPU occurs during initialization, but can also occur when a non-existent texture is first required by the current view. This process is asynchronous and will result in a blank texture being used until the full texture is ready for rendering. As such, we should avoid too much texture variation across our Scenes.
Even though it doesn't strictly relate to graphics performance, it is worth mentioning that the blank texture that is used during asynchronous texture loading can be jarring when it comes to game quality. We would like a way to control and force the texture to be loaded from disk to the main memory and then to VRAM before it is actually needed.
A common workaround is to create a hidden GameObject that features the texture and place it somewhere in the Scene on the route that the player will take towards the area where it is actually needed. As soon as the textured object becomes a candidate for the rendering system (even if it's technically hidden), it will begin the process of copying the data towards VRAM. This is a little clunky, but is easy to implement and works sufficiently well in most cases.
We can also control such behavior via Script code by changing a hidden Material's texture:
GetComponent<Renderer>().material.texture = textureToPreload;
In the rare event that too much texture data is loaded into VRAM, and the required texture is not present, the GPU will need to request it from the main memory and overwrite the existing texture data to make room. This is likely to worsen over time as the memory becomes fragmented, and it introduces a risk that the texture just flushed from VRAM needs to be pulled again within the same frame. This will result in a serious case of memory "thrashing", and should be avoided at all costs.
This is less of a concern on modern consoles such as the PS4, Xbox One, and WiiU, since they share a common memory space for both CPU and GPU. This design is a hardware-level optimization given the fact that the device is always running a single application, and almost always rendering 3D graphics. But, all other platforms must share time and space with multiple applications and be capable of running without a GPU. They therefore feature separate CPU and GPU memory, and we must ensure that the total texture usage at any given moment remains below the available VRAM of the target hardware.
Note that this "thrashing" is not precisely the same as hard disk thrashing, where memory is copied back and forth between main memory and virtual memory (the swap file), but it is analogous. In either case, data is being unnecessarily copied back and forth between two regions of memory because too much data is being requested in too short a time period for the smaller of the two memory regions to hold it all.
Avoiding this behavior may require customizing texture quality and file sizes on a per-platform and per-device basis. Be warned that some players are likely to notice these inconsistencies if we're dealing with hardware from the same console or desktop GPU generation. As many of us will know, even small differences in hardware can lead to a lot of apples-versus-oranges comparisons, but hardcore gamers will expect a similar level of quality across the board.