
Start by doing what’s necessary, then what’s possible, and suddenly you are doing the impossible.
—Francis of Assisi
How to make a speedy framework even faster?
The main thing we need to do is understand how it works and combine the result with our needs.
And this is what this chapter is all about.
Faulting and how to take advantage of it
How to improve our fetches using a fetch index
How to improve our string search
How to improve our saving operations
Profiling our app using Instruments
Faulting
That short line of code shows that once I fetched a song, it was super simple to get its album name.
But wait – have you ever wondered how it is possible?
All you need to do is access the song’s album name property. Does this mean that we also brought its album when we fetched the song object?
You must admit this is strange – even if fetching a song also fetches its album, fetching the other album’s songs is too much!
I ask you, Where does it end?
You probably know that there are cases where we print Core Data objects and get their properties’ values.
For some reason, that’s not the case in the preceding example. Instead of getting the full object details, we get some general information, and under data, we get fault (marked in bold).
So what does “fault ” means?
“Faulting ” is one of Core Data’s best features and what makes it so efficient on the one hand but so convenient on the other.
Faulting means that Core Data does not go to the persistent store to query data unless it really needs to, and instead, it keeps a hashable representation of the object in memory.
The fact that we lazy-load our data has a huge (positive) impact on performance and memory.
myAlbum is a fault now – this means that its actual data are not fetched yet.
Notice that now, the songs’ relationship is a fault . That’s because we didn’t ask for any information about the songs themselves. Only if we access the songs object Core Data will query the persistent store and get their data.
Amazing and clever as it is, where does it meet us as developers?
So the way faulting works is transparent to us. We basically don’t need to do anything for it to work, and that’s one of Core Data beauties.
But understating how it works can help us solve performance issues and even make our code even more efficient.
Batch Faulting
Let’s get back to our previous example with fetching an album and its songs.
Simple, right?
For every song in the array
If we have 100 songs, we will query the store 100 times.
If we have a very long array, Core Data will do many roundtrips to the persistent store, of course, in the name of faulting.
So the Core Data faulting feature is smart but not that smart.
This is where we can help Core Data faulting be more efficient, and we can do that using something called “ batch faulting .”
I want to explain what the code does.
We can define that the fetch request won’t return the results as faulted objects by setting the returnsObjectsAsFaults property as false.
As always, we need to understand the prices and consequences of what we are doing.
Faulting is not there because some computer science students had to do a college assignment.
Faulting helps you reduce memory footprint. It means that loading all the songs into the memory impacts your app.
Let’s say you have 1000 items you want to display in a UITableView. Fetching all their content to the memory will be a huge mistake – the user probably won’t scroll the bottom of the table view anyway, so there’s no point in consuming so much memory.
But in the case of mapping like the preceding example, batch faulting can be a good solution.
Always balance between memory and speed, and that’s also the case here.
Prefetching
Another way to fetch data efficiently is something called prefetching .
Going back to the previous example, when we fetched the album object, we also said, “I want to fetch its songs as well.”
Providing a list of key paths and setting them in the relationshipKeyPathsForPrefetching will also fetch them.
Looking at the console, we can see Core Data performs two queries.
Even though it’s not always clear what the column names mean, it’s easy to understand what the query is supposed to do – I marked in bold the expressions that can lead to what it’s doing.
Like batch faulting , we interfere with how Core Data optimizes its work. You should balance between memory and speed here and understand its impact.
Deleting
“But you said we don’t need to do anything!”
And you don’t!
In this topic, you just need to lean back and read because it’s for your knowledge self-enrichment only.
Now, a question: We fetch an album, and its songs are a fault. We delete one of the songs from the persistent store in another context. What will happen if the first context tries to fire (meaning load data for a faulted item) the deleted song?
The preceding case is one of the reasons Core Data frustrated so many developers over the years.
As I said, iOS 9 changed that, and now if a faulted item is being deleted in the persistent store, it is also being removed from the other contexts.
Setting the shouldDeleteInaccessibleFaults property to false makes sure your app will crash when accessing deleted faulted objects.
Isn’t it lovely? (See, I said you just need to lean back and read.)
Improve Your Fetches
We already know that Core Data is super-efficient and fast. Core Data fetches are extremely fast, partly because of the reasons we’ve discussed earlier.
How fast?
I built a small app with a persistent store that contains around 100,000 songs.
The execution time was 0.0357 seconds. Insanely fast!
Even though it was on my MacBook Pro M1, it is impressive.
But we can make it even faster by using a fetch index.
Fetch Index
A fetch index is one of the Core Data APIs that can help us specify an index for specific attributes in our store.
So what’s an index?
For those who are not familiar with how classic databases are optimized, an index is another table that helps queries avoid what we call a “full table scan.”
The best way to explain that is by using the book you are just holding. If you want to jump to a specific chapter or locate a particular term, you don’t need to go page by page from the start.
We know why – we have a menu or an index for that.
The same goes with tables. If we want to have an efficient query, we need to create an index for specific columns.
Back to Core Data. Underneath this great framework, we have a database with the same rules of full table scan as well.
To understand how the fetch request I mentioned earlier performed, we will first enable our Core Data SQL debugging in our scheme editor.
Go to Product ➤ Scheme ➤ Edit Scheme.
This time, we are setting the debug level to 4 instead of 1 to get more information about our Core Data activity.

A screenshot of Arguments passed on launch under My Music App, i Phone 13. Arguments passed on launch has hyphen com dot apple dot Core Data dot S Q L Debug 4, checked and selected The environment variables tab includes Name and Value.
Enable Core Data debugging, level 4
The SCAN word you see in bold means that SQLite had to perform a full table scan in the Songs (“ZSONG”) table.
So, even though the performance was good, a full table scan is something we want to avoid using a fetch index.
Creating a Fetch Index
Open your data model editor and select your Song entity.
Select Editor ➤ Add Fetch Index, or click the Add Entity button in the bottom.
Select Add Fetch Index.
A new fetch index is created for you (look at Figure 9-2).

A screenshot of Fetch Index elements. The options under Fetch index elements are Property, Type, and Expression. The column Entities on the left lists Album, Composer, Lyrics, Playlist, and Song. The option by Property Index is highlighted.
A new fetch index
We will give our new fetch index a name, in this case – byName.
We will add a new fetch index element on the right by clicking the plus button and selecting the name property.

A screenshot of Fetch Index elements. The options under Fetch index elements are Property, Type, and Expression. The column Entities on the left lists Album, Composer, Lyrics, Playlist, and Song. The option by Name is highlighted.
A new fetch index element based on the name property
Same duration as the previous fetch?
“But you promised!”
I know I did. But indexing is not “magic.” It is another table Core Data needs to build if it wants to use it.
Reinstalling the app
Creating a model version (we’ll talk about it in the next chapter)
Changing the entity hash modifier.
Now for the explanation.
When Core Data loads the persistent store, it compares the data model scheme defined in the app with the current scheme the store is based on.
If Core Data finds differences, it starts something called migration.
Even though we will learn about migration later in that book, you should be aware that migration triggers the building of an index.
Defining a fetch index is not a scheme change. Therefore, it doesn’t trigger migration.
So one way to trigger migration is to create a model version that is different from the previous one.
Another way to trigger migration is to provide a different Hash Modifier with all the entities we want to build their index.
Go to the data model editor .
Select the entity whose hash modifier you want to change.
Select the inspector pane on the right.
Locate the hash modifier at the bottom.

A screenshot of Attributes, Relationships, Fetched Properties, Entities, and Versioning. Versioning has Hash Modifier, 3 1 2 2 3 5 and Renaming I D. Entities include Album, Composer, Lyrics, Playlist, and Song. Attributes include Number, Integer 32. name, String, and image U R L, U R I. Relationships include lyrics, playlists, and composer.
Changing the hash modifier
All you need to do is to pick a different hash modifier . The simple way is increasing its number.
Much better than before!
The duration of the fetch requests I mentioned here is not important – they were done on my laptop using a simulator. What’s important is to see the change the fetch index made to my request. You can expect different results on another machine, but the improvement stays.
Index Expressions
You and I know that predicates are more complicated than just comparing strings.
If we go back to Chapter 5, I showed you we could also fetch data using expressions.
The preceding expression can be implemented in a fetch request using NSExpressionDescription (go over Chapter 6 again).
If expressions are something you perform with a large set of objects, you can index them as well!

A screenshot of fetch index elements with name selected under property. On the left, there is a list under entities that has Album, Composer, Lyrics, Playlist, and Song. The column on the right has Name, by Name. Type, Binary, and Partial index.
Creating a fetch index element for an expression
Now performing a sum operation on song duration has never been faster!
Indexing expressions really nails it – it’s one of the cases where optimizations are being served to you and you just need to take them.
Is a Fetch Index a Magic?
What you’re asking is, If a fetch index works so well, why not create a fetch index for all entities and attributes? What do we have to lose?
(I don’t know if that’s what you asked, but let’s pretend that’s what happened.)
So not only a fetch index can be handy; sometimes it’s a must. Doing a full table scan on large data sets is considered bad practice.
But on the other hand, the fetch index is not magic.
Indexes have their cost.
Let’s restore the “book example” again.
We have an index for fast locating of terms and subjects in our book.
We notice that the index consumes extra pages of the book, which translates to disk space in the computer world.
But space is the least of our problems.
What happens when we edit, delete, or add more pages to our book?
Now that we have an index, we need to maintain it as well!
So we now understand that an index requires not only space but also time.
Having too many indexes can harm your app performance, and ironically that was something you wanted to improve!
Believe it or not, there are times when adding indexes might create an overload on your app, so be careful and always check the impact of your actions on different metrics.
Use One-to-One Relationships to Improve Performance
Wait…what?
How does using relationships relate to performance ?
When we talked about relationships, we mentioned the form of a one-to-one relationship, which can be an extension of an object.
If you think intuitively, having entities with many attributes hurts both your memory and your fetch time.
One option to avoid that is using the Core Data’s faulting feature, which lazy-loads additional data.
Take the Album entity as an example.
If we want to extend the Album entity with information about the releasing process, for example, who was the musical producer, where it was released, and even pictures, we can add it as part of the Album with more attributes.
But adding more attributes to the Album may impact its loading time when we have a significant amount of data.
A solution might be to create another entity named AlbumRelasingDetails and connect it to Album as a one-to-one relationship.
It’s a great way to load only what you need, and it’s also a great example of how much the separation of concerns principle is helpful in our code.
Limit Your Results
That tip is important because of two reasons – it’s a common use case, and it’s also very easy to implement.
There are so many cases where we need to fetch one object only.
And that’s interesting – because what happens is that after the fetch request finds the first object, it continues until it finishes to search the rest of the objects.
There are cases where limiting the fetch request can cut the fetch time to half and even more!
Now, I said it’s a common use case because many fetch requests try to retrieve a single object. Stopping after the first result can sum up to be a time saver.
String Search Optimization
String-related searches are very popular when working with Core Data. The problem with strings is that they are not only popular but relatively slow to search.
You already saw that predicates containing strings are much more complex than the others, which explains how we can easily fall into nonefficient fetches.
Case-Sensitive Searching
You are already supposed to know by now that Core Data string searches are case sensitive.
But underneath, things are not that simple.
Case Sensitive – 0.0082
Case Insensitive – 0.0322
Searching with case insensitivity can be almost four times slower!
Why does it happen?
If our Core Data debugging is still enabled from before, we can have a look at our console for further information.
Looking at the preceding code, you can see I marked the relevant change in bold. While the case-insensitive query still uses the index we created, the comparison is made using the NSCoreDataStringCompare, which is much slower.
Now, string comparisons are essential – we use them to find names, IDs, URLs, searches, and more.
So the decision about the type of string search we want to do seems important.
What can we do to handle that?
Well, a known tradeoff is paying with space to get speed. In fact, that’s the way indexes work.
To implement that idea in case-insensitive searches , we can add another attribute that holds a lowercase version of the attribute we want to search.
For example, if we have an attribute called “name”, we will add another attribute called “namedNormalized”.
Overriding the willSave() method is an elegant solution to ensure our data won’t corrupt.
The extra attribute is a great way to eat the cake and leave it whole – we can keep the original text as it is and still perform very quick fetches!
Improve Our Saving
Fetching data is not the only Core Data aspect we can optimize – another action we are doing is saving.
Now, even though saving doesn’t look like an action that can be optimized, it is undoubtedly something we can improve.
Batch Saving
I guess that the best saving tip would be “insert many, save once.”
You should remember that the saving action is an expensive one. If you have the option to reduce the number of times you push changes to the persistent store, you should lower it to the minimum possible.
We can see the function iterates through the list of contacts , and in each iteration, it inserts a new contact and calls the save() function.
So, for 1000 contacts, the function calls save() 1000 times!
9.1 seconds.
And that’s a simulator running on a MacBook Pro M1, yes?
Let’s measure the time again:
0.2 seconds!
Inserting 10,000 objects took 0.2 seconds vs. 9 seconds. That’s a huge difference!
Remember saving is an expensive operation. Use it with caution, especially with loops.
And that’s an action you need to consider where to put – it can be when you go to the background, at the end of a sync operation, or when the user moves out of a screen.
Ordering + Relationships
Do you want to learn more tips that can cut your saving time by half?
Stay tuned.
Let’s talk about to-many relationships.
Do you remember we can define a to-many relationship as “ordered”? If you don’t have to use that feature and need more power juice, you better give it up and save around 25% time.
Look at these numbers – saving 10,000 objects:
Ordered To-Many Relationship: 0.48 seconds.
Non-ordered To-Many Relationship: 0.36 seconds.
But we can go even further. If we insert these objects, not as part of a relationship, we can earn even more time – 0.25 seconds!
First, we need to understand why it happens. The ordered to-many relationship requires Core Data to maintain linking between the different objects we insert and keep an ordered list, consuming more CPU power.
But the connection Core Data needs to do to maintain the to-many relationship also has its weight, and that’s another thing we ditched.
Now, you probably think to yourself, “You said that ’relationships’ are one of Core Data’s best features,” and they are!
But you see, in performance, it’s always a tradeoff. On one occasion, we can sacrifice memory, and on another, it will be our comfort as engineers.
In this case, we gave up important Core Data features to speed our savings by 50%. Is it worth it? You decide.
Giving up Core Data features means we need some kind of a replacement. First, we can add an attribute that saves the timestamp of the insertion. That will make it easier for you to sort the objects by their insertion time.
Second, you can maintain a relationship between objects using another attribute representing the connection between the entities.
For example, we can add an attribute named “albumID” for a Song entity, just as we do in SQL tables.
Working with Instruments
All the great tips you got here are not an insurance certificate everything will work flawlessly.
Programs are complex, and managing data is even more complicated.
We can easily get lost in all the tradeoffs and optimizations I showed you.
Lucky us, Apple Instruments is a fantastic tool that can help us get to the bottom of our issues.
A Few Words About Instruments
Instruments is an Xcode tool for memory and performance debugging. Even though it comes as a separate application, Xcode and Instruments work together seamlessly.
Besides memory, CPU, I/O, and network monitoring, Instruments also provides excellent Core Data debugging tools.
Opening Instruments
The best way to start debugging with Instruments is to launch Instruments within Xcode .

A screenshot of My Core Data App 2 with a play button. The drop-down option lists Run, Test, Profile, and Analyze, and Profile is highlighted.
Running Profile from Xcode
Another even faster option would be to press ⌘ (Command) + I.
Once we do that, our project will be recompiled, and the Instruments application will be launched.
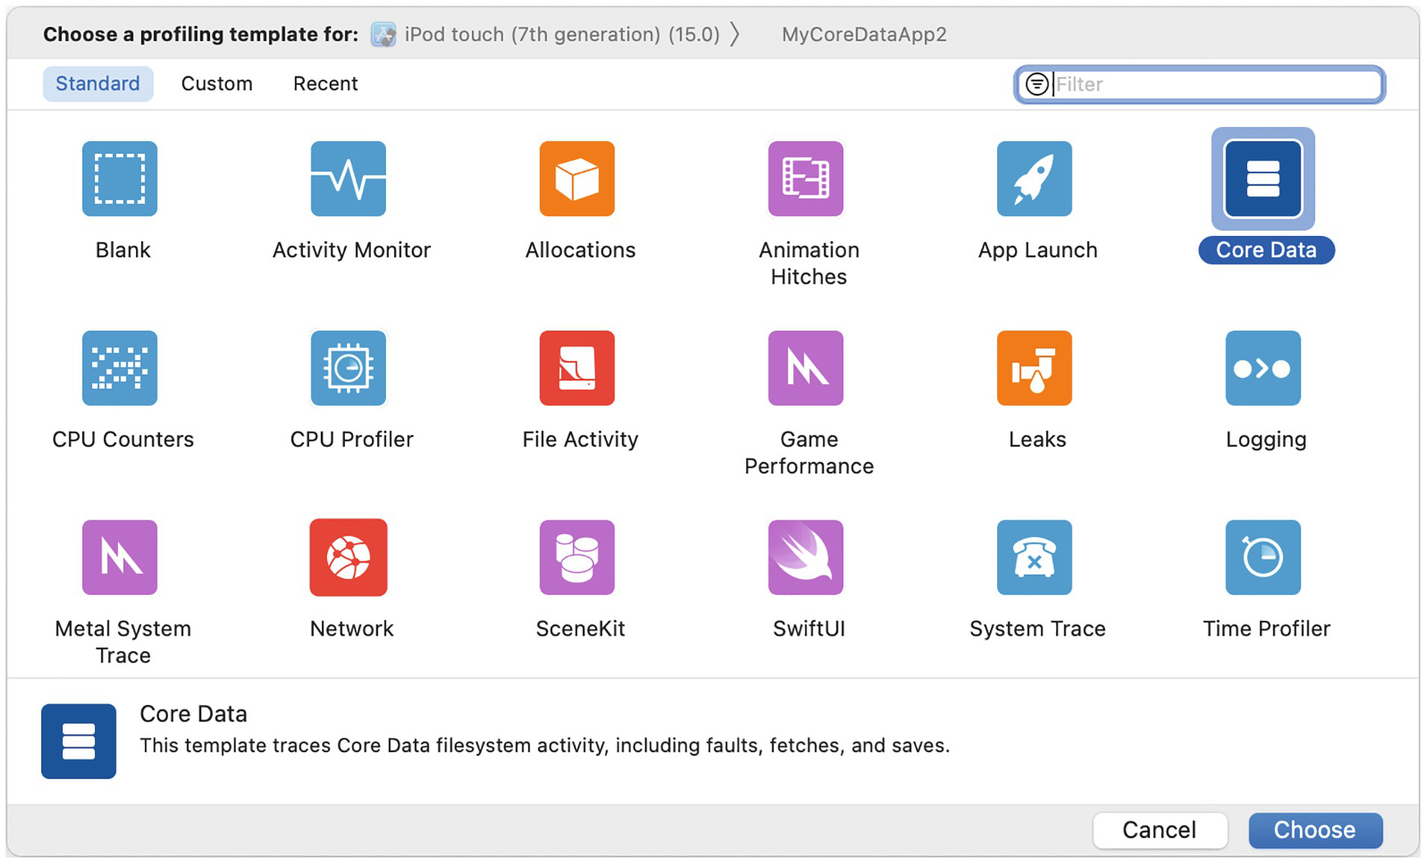
A screenshot of a profiling template in instruments, with the standard option open. The templates with icons include Blank, C P U counters, Metal System Trace, Activity monitor, C P U profiler, Network, Allocations, File activity, Animation hitches, Game performance, Swift U I, and core data. The core data icon is highlighted.
Choose a profiling template in Instruments
As you can see, there are many profiling templates you can pick from! But this is a Core Data book, so we’ll go for the Core Data template. You are more than welcome to explore the other available templates.

A screenshot of a window with Core data faults selected, from a list that includes Core Data fetches, and Core Data saves.
Instruments profiling window
About Core Data Instruments
The Core Data template has three different instruments we can use – Faults, Fetches, and Saves.
To clear the terminology we use here, each one is called an “instrument,” and the “Core Data” you chose in Figure 9-7 is called a profiling template . It’s a template because it comes with the three Core Data instruments available today, but you can add more or remove instruments.
Core Data Saves Instrument
The Core Data Saves instrument can help you investigate when your app performs save operations to the persistent store.

A screenshot of a window where Core data faults is displayed with fault duration and relationship fault duration. On the right, a sound track is marked at 14.377.210.540.
Core Data Saves instrument profiling
Our Core Data Saves instrument displays something interesting – it shows that over the first 14 seconds of the app launch, there is a load of save operations done to the persistent store.

A screenshot of of a window with Core data faults, Core Data fetches, and Core Data saves. On the right, there is a display of a sound track. A list at the bottom has save duration, 2.31 milliseconds highlighted.
Investigate save operations in Instruments
Oh! We can see the list of the save operations , and for each of them, we can also tell when it happened, for how long, and even who called the save operation in our code.
Looking deeply, we see that we call the save() operation for each loop iteration.

A screenshot of how to run instruments after the insert objects fix. At the bottom left, start and save duration have highlighted values.
Running Instruments after the insert objects fix
Now we see one save operation after half a second. It looks like the problem was fixed!
The number of details we get using the Core Data Saves instrument is just amazing. This instrument can really help you put your thumb on Core Data saving bottlenecks and manage them easily.
Faults and Fetches
Two more Core Data instruments that can be very useful are Fetches and Faults .
As their names suggest, the Core Data Fetches instrument provides information about fetches the app performs, and the Core Data Faults instrument provides information about relationship faulting.

A screenshot of Core data fetches and faults instruments. The performance is graphed on the main part of the screen, with groups of bars.
Core Data Fetches and Faults instruments
Core Data Fetches and Faults instruments can show you high pressure and bottlenecks in your Core Data.
For example, a big faults number may indicate a problematic model scheme or not an optimized fetch request .
And maybe, it’s a sign that you need to do batch faulting to be more efficient (just like we learned earlier).
A high number of fetches of the same entity might indicate a narrow predicate you are using or for multiple main contexts trying to fetch data at the same time.
Core Data Instruments can point to an anomaly in the way you work with data and give you a hint of what you can fix.
While it may look a little bit scary at first, Instruments is very friendly.
You should remember that most of the issues you may find there can be easily fixed using the tips you’ve learned in this chapter.
Summary
I know this chapter is a little bit “weird.”
On the one hand, I showed you how Core Data is super-efficient, and on the other hand, I showed you how you could optimize it to your own needs.
But this is how optimizations work.
We want to make the best even better, and it’s also a great way to explain how things work underneath, even if you don’t need to do anything.
We’ve learned what faulting is and how to use it to speed our fetches. We also learned how to index our data, speed up our string search, and perform efficient saving operations.
We ended with Instruments – an excellent profiling tool you have in your Xcode.
Now it’s time to slow down (again, word game!) and learn how to maintain Core Data for the long run.