
In this section, I use the Anon-U trace files in two different simulations. We’ll see how the number of cache clients affects hit ratio and how the hit ratio changes as a function of the cache size.
For hit ratio versus number of clients, I used one day’s access log from the Anon-U data. I am restricted to a single day because the client IP addresses are not sanitized consistently between log files. The access log I used has 1.7 million requests from 2,415 different clients. I can’t tell from this data which of the objects are uncachable, so in the simulation all URLs are uniformly uncachable with a 25% probability.
Given a trace with 2,415 clients, how can we calculate the hit
ratio for one, two, or any particular number of clients? My
approach is to first create a random ordering of clients. Then
I run a program that reports the hit ratio for requests from the
first client, the first two clients, the first three clients,
and so on, all the way up to the maximum. For small numbers of
clients, the hit ratio varies greatly depending on the ordering
of clients. In one case, the first 20 clients might have a 20%
hit ratio, while another results in 90%. To improve the
precision, I ran the simulation with 100 different client
orderings and averaged the results. Note that, in these
simulations, the cache size is infinite, and there are no
If-modified-since or
no-cache requests. The
random seed is always the same so that the set of uncachable
URLs remains consistent between runs.
Figure A-7 shows the mean hit ratios with “error bars,” which represent the minimum and maximum cache hit ratio values for the 100 different runs. As the number of clients increases, the minimum-maximum spread decreases.
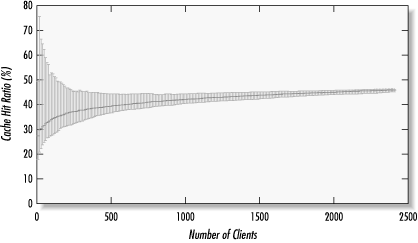
The linear scale of the first figure makes it difficult to see the trend for small numbers of clients. Figure A-8 is a graph of the same data but on a logarithmic scale and without error bars. Here you can see that the mean hit ratio starts at around 18% and increases in proportion to the logarithm of the number of clients.
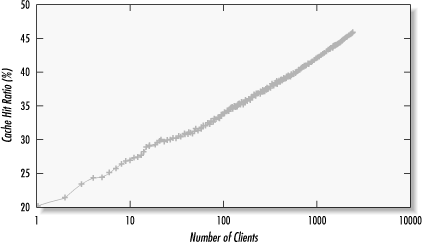
Figure A-9 gives the results from a simulation with different cache sizes and also shows how the hit ratio increases with the number of total requests. As with Figure A-8, the hit ratio increases in proportion to the logarithm of the cache size. For this trace, each order of magnitude increase in cache size results in an increase in hit ratio of 11%.

The different lines in Figure A-9 show the hit ratio trace after reading a certain number of requests from the log file. For example, the lowest line shows the simulation results after reading 10,000 requests. You can see that the hit ratio doesn’t change once the cache size reaches 50MB. In other words, a 50MB cache is sufficient to store every cachable response from the first 10,000 requests. At the other extreme, all 21 million requests in the Anon-U logs require a 40GB cache to achieve maximum hit ratio.