
Web performance optimization streamlines your content and tunes your server to deliver web pages faster. In the following chapters, you’ll learn how to optimize your web pages and multimedia, shrink your Cascading Style Sheet (CSS) and HTML file sizes, and reduce server requests with sprites and suturing. You’ll learn how to squeeze your Ajax code and make it more robust. You’ll explore advanced techniques such as improving parallel downloads, caching, HTTP compression, and URL rewriting.
Finally, in Chapter 10 you’ll read about best-practice metrics and tools to measure and optimize your search engine marketing (SEM) campaigns and improve website performance. First, let’s explore the user psychology of delay, and trends in web page growth.
Previous research has shown that user frustration increases when page load times exceed 8 to 10 seconds without feedback. [83], [84] Newer evidence shows that broadband users are less tolerant of web page delays than narrowband users. A JupiterResearch survey found that 33% of broadband shoppers are unwilling to wait more than four seconds for a web page to load, whereas 43% of narrowband users will not wait more than six seconds. [85]
Even small changes in response times can have significant effects. Google found that moving from a 10-result page loading in 0.4 seconds to a 30-result page loading in 0.9 seconds decreased traffic and ad revenues by 20%. [86] When the home page of Google Maps was reduced from 100 KB to 70–80 KB, traffic went up 10% in the first week and an additional 25% in the following three weeks. [87] Tests at Amazon revealed similar results: every 100 ms increase in load time of Amazon.com decreased sales by 1%. [88]
Overall, slow web pages lower perceived credibility and quality. Keeping your page load times below tolerable attention thresholds will help to lower user frustration, [89] create higher conversion rates, [90] and promote deeper flow states.
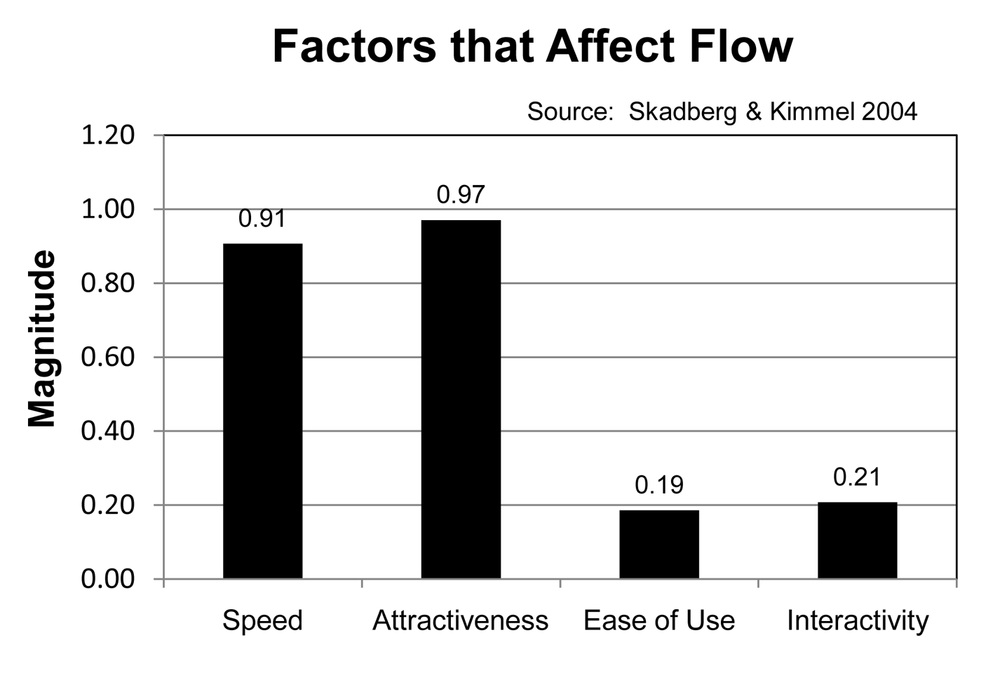
Speed is the second most important factor, after site attractiveness, to increasing flow in users (see Figure 58). [91] People who are more engaged while browsing your site will learn faster and show an improved attitude and behavior toward your site.
To increase perceived speed, strive to display your initial useful content in less than one or two seconds by layering and streamlining your content. Once total load time exceeds six to eight seconds, provide linear feedback to extend the tolerable wait time by lowering stress levels and allowing users to plan ahead. [92] See Chapter 7 for techniques on using CSS to streamline your content to display faster.
People make snap decisions about the aesthetic value and thus the credibility of your pages. In as little as 1/20th of a second, users form a first impression of your page that does not change significantly over time. [93] Confirming these results, Noam Tractinsky and others found that the average attractiveness ratings of web pages after being exposed for only half a second were consistent with the ratings after 10 seconds. [94]
Clearly you only have a very short time to make a good first impression on the Web.
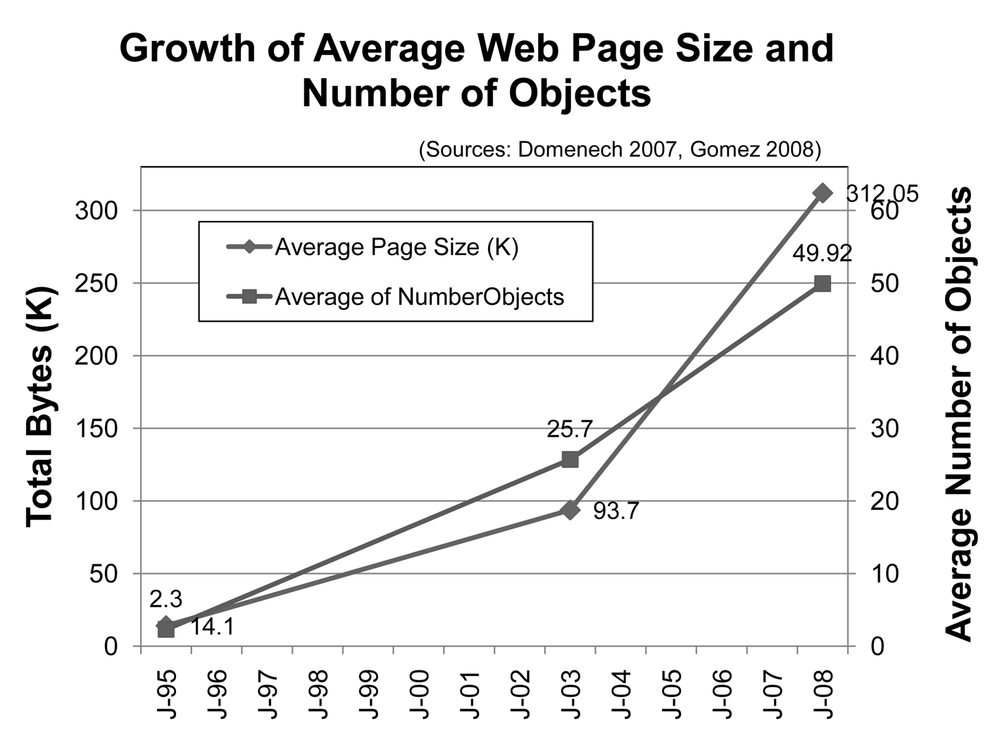
The average home page has grown in size and complexity over the years. From 2003 to 2008, the size of the average web page grew more than 3.3 times from 93.7 KB to more than 312 KB (see Figure 59). During the same five-year period, the number of objects (separate files, such as images, CSS, and JavaScript) in the average web page nearly doubled from 25.7 to 49.9 objects per page. [95], [96]
In the Web’s early days, when there were few objects per page, total page size dominated web page response times. With the growth of the number of objects per page, however, the latency due to object overhead, not the objects themselves, now dominates most web page delays (see Figure 60). [97]
For four or more external objects per page, the overhead of description time (DT in the graph, caused by the dependency between objects) for objects plus waiting time (WT in the graph, caused by limited parallelism) for threads makes up more than 50% of web page delay. As the number of objects increases, the delay from downloading the actual objects pales in comparison, with only 20% or less due to object size as the number of objects per page exceeds 20.
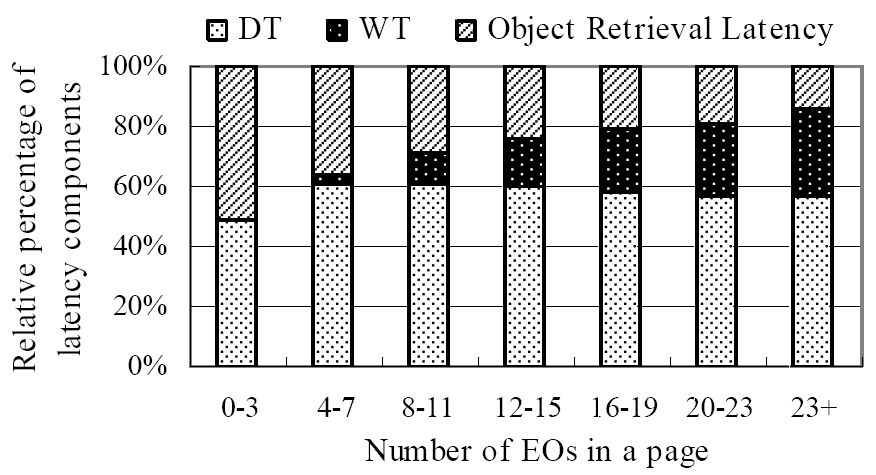
Figure 60. Relative distribution of latency components showing that object overhead dominates web page latency
Because of this object overhead, improving parallelism is a more effective way to optimize throughput than Content Delivery Networks (CDNs), DNS caching, or persistent connections. [98] Persistent and pipelined connections are more effective on connections faster than 200 Kbps. Therefore, narrowband users suffer the most from the inexorable increase in web objects. [99] You’ll learn how to improve parallelism in Chapter 9.
From 2003 to 2008, web page size has more than tripled and the number of external objects has nearly doubled. So, over time narrowband users (56K and ISDN) have experienced slower response times. Broadband users, however, have experienced somewhat faster response times. For broadband users, the average download time of the Keynote Business 40 Internet Performance Index (KB40) has decreased from 2.8 to 2.3 seconds from February 2006 to February 2008 (see Figure 61). [100]
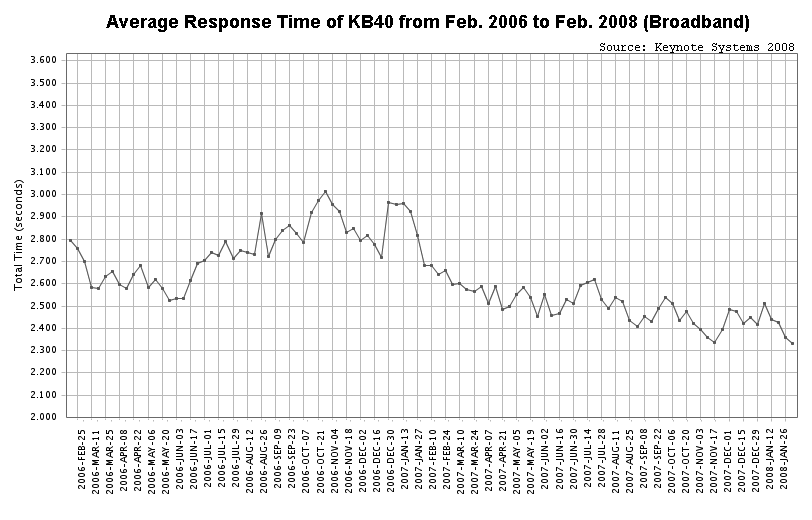
Figure 61. Average KB40 website performance over broadband from February 2006 to February 2008 (Source: Keynote Systems, Inc.)
So, the increase in the average speed of broadband is faster than the increase in the size and complexity of the average web page. That is one reason why broadband users expect faster response times, yet narrowband users experience slower response times. Keynote recommends the following response times for different connection speeds: [101]
Two to three seconds for business/high-end home speeds
Three to five seconds for entry-level DSL
20 to 30 seconds for dial-up users (implies a total page size of 100 KB at 20 seconds)
So, the old 8- to 10-second rule has diverged. With the response time trend shown in Figure 61, we recommend three- to four-second total load times for broadband users. Given the growth in average page size shown in Figure 59, we recommend keeping your HTML code under 40–60 KB (which will load in less than 8 to 12 seconds), and page graphics under 40–60 KB (another 8 to 12 seconds of progressive load) for dial-up users. This equates to an absolute limit for dial-up of 120 KB.
Note that there are some exceptions. These recommendations apply to landing pages, home pages, and pages where the user is likely to navigate quickly. For pages where the user expects to linger, such as a white paper, breaking up the page can be annoying and can make printing and searching more difficult.
With the spread of broadband, high-speed users are no longer willing to wait 8 to 10 seconds for a page to load. Today you have three to four seconds to respond, or you risk abandonment. Although broadband users have seen faster load times, narrowband users have been left behind. With the average web page sporting more than 50 external objects, object overhead now dominates most web page delays. Minimizing HTTP requests while still retaining attractiveness has become the most important skill set for web performance optimizers.
In the following chapters, you’ll learn how to optimize your content by reducing file sizes, using CSS, and applying advanced server- and client-side techniques.
[83] Bouch, A. et al. 2000. “Quality is in the Eye of the Beholder: Meeting Users’ Requirements for Internet Quality of Service.” In CHI 2000 (The Hague, The Netherlands: April 1–6, 2000), 297–304.
[84] In my own book, Speed Up Your Site: Web Site Optimization (New Riders), I determined an average of 8.6 seconds for tolerable wait time.
[85] Akamai. June 2006. “Retail Web Site Performance: Consumer Reaction to a Poor Online Shopping Experience.” Akamai Technologies, http://www.akamai.com (accessed February 10, 2008). This is a JupiterResearch abandonment survey commissioned by Akamai.
[86] Linden, G. November 6, 2006. “Marissa Mayer at Web 2.0.” Geeking with Greg, http://glinden.blogspot.com/2006/11/marissa-mayer-at-web-20.html (accessed February 8, 2008).
[87] Farber, D. November 9, 2006. “Google’s Marissa Mayer: Speed Wins.” CNET Between the Lines, http://blogs.zdnet.com/BTL/?p=3925 (accessed February 10, 2008).
[88] Kohavi, R., and R. Longbotham. 2007. “Online Experiments: Lessons Learned.” Computer 40 (9): 103–105. The Amazon statistic was taken from a presentation by Greg Linden at Stanford: http://home.blarg.net/~glinden/StanfordDataMining.2006-11-29.ppt.
[89] Ceaparu, I. et al. 2004. “Determining Causes and Severity of End-User Frustration.” International Journal of Human-Computer Interaction17 (3): 333–356. Slow websites inhibit users from reaching their goals, causing frustration.
[90] Akamai. 2007. “Boosting Online Commerce Profitability with Akamai.” Akamai Technologies, http://www.akamai.com (accessed February 10, 2008). Based on the finding that 30% to 50% of transactions above the four-second threshold bail out, Akamai estimated that by reducing the percentage of transactions above this threshold from 40% to 10%, conversion rates will improve by 9% to 15%.
[91] Skadberg, Y., and J. Kimmel. 2004. “Visitors’ flow experience while browsing a Web site: its measurement, contributing factors and consequences.” Computers in Human Behavior 20 (3): 403–422. Flow is an optimal experience where users are fully engaged in an activity.
[92] Nah, F. 2004. “A study on tolerable waiting time: how long are Web users willing to wait?” Behaviour & Information Technology 23 (3): 153–163.
[93] Lindgaard, G. et al. 2006. “Attention web designers: You have 50 milliseconds to make a good first impression!” Behaviour and Information Technology 25 (2): 115-126.
[94] Tractinsky, N. et al. 2006. “Evaluating the consistency of immediate aesthetic perceptions of web pages,” International Journal of Human-Computer Studies 64 (11): 1071-1083.
[95] Domenech, J. et al. 2007. “A user-focused evaluation of web prefetching algorithms.”Computer Communications 30 (10): 2213–2224.
[96] Flinn, D., and B. Betcher. “Re: latest top 1000 website data?” Email to author, January 8, 2008. Gomez, Inc. provided the top 1000 web page data from June 2006 to January 2008 (available at http://www.websiteoptimization.com/secrets/performance/survey.zip).
[97] Yuan, J. et al. 2005. “A More Precise Model for Web Retrieval.” In WWW 2005 (Chiba, Japan: May 10–14, 2005), 926–927. Figure used by permission.
[98] Bent, L., and G. Voelker. 2002. “Whole Page Performance.” In WCW 2002 (Boulder, CO: August 14–16, 2002), 8.
[99] Hall, J. et al. 2003. “The Effect of Early Packet Loss on Web Page Download Times.” In PAM 2003 (La Jolla, CA: April 6–8, 2003).
[100] Berkowitz, D., and A. Gonzalez. “Andy: Keynote data for your use.” Email to author (February 8, 2008). Keynote Systems, Inc. provided the graph of the KB40 response time from February 2006 to February 2008.
[101] Rushlo, B. “web performance download time guidelines?” Email to author, February 21, 2008. Keynote response time guidelines.