
When You Can Use Technical Analysis for Investing
Charles D. Kirkpatrick, II, CMT and Julie Dahlquist, Ph.D., CMT
Technical analysis is widely used in freely traded markets. In the United States and most major industrial countries, technical analysis is used in the currency, equity, fixed income, and commodity markets. Professional traders and investors, as well as individuals who are investing their own funds, use the techniques of technical analysis. An obvious use of technical analysis is to make money. Investors attempt to buy a security at a low price and sell it at a high price; technical analysis helps identify profitable buying and selling opportunities. In addition to aiding the investor with determining profitable buying and selling opportunities, technical analysis can be used to manage risk.
For an investor to use technical analysis in a market, easy access, fungibility, sufficient liquidity, and continuous trading must characterize the market. Although there are many freely traded markets in the world in which technical analysis is used, the most common, and the one this book will most frequently address, is the U.S. stock market.
In What Types of Markets Can Technical Analysis Be Used?
Markets are simply meeting places of buyers and sellers. Markets can be categorized in many ways. They can be categorized by the assets being traded, the manner in which the borrowers and lenders meet, or by the type of contract that is executed. Let us begin by dividing markets into categories based on how organized or integrated the market is. Using this type of division results in four different types of markets: direct search markets, brokered markets, dealer markets, and auction markets.
The direct search market is the least organized market structure. With this type of market, buyers and sellers must seek and find each other directly. For example, suppose that Elizabeth wants to buy a used washer and dryer for her new apartment. Elizabeth might search the classified ads in her local newspaper for a seller of a washer and dryer. Generally, low-priced, nonstandard goods are traded in the direct search market. This type of market is characterized by sporadic participation by the market players.
The next level of market organization, the brokered market, addresses the direct search market problem of the buyer and seller finding each other. In markets where the volume of trading in a particular good is sufficiently high, brokers can specialize in bringing buyers and sellers together. One of the most familiar examples of a brokered market is the real estate market. Through specialization and economies of scale, the real estate broker is able to provide search and matching services to clients at a cost much lower than the clients’ private search costs would be. The broker is able to earn a commission by providing these search and matching services for the buyer and seller. Brokered investment markets work similarly, with brokers matching buyers and sellers of financial assets for a commission.
A third type of market structure, the dealer market, arises when the trading in a particular type of asset becomes sufficiently heavy. Unlike brokers, dealers trade assets for their own accounts. Specializing in particular types of assets, these dealers post bid and ask prices and stand ready to buy and sell at these prices. The NASDAQ is an example of a dealer market for stocks. The dealer offers to buy securities at the bid price and offers to sell the securities at the ask price. The dealer’s profit margin is known as the bid-ask spread. The dealer market saves market players search costs by providing readily available information about the prices at which they can buy and sell securities. The securities traded in dealer markets are usually substitutable and liquid, with the dealers standing ready to purchase or sell securities providing the liquidity. Thus, dealer markets generally have the characteristics necessary to use technical analysis.
The most highly integrated market is the auction market. In an auction market, all participants converge at one place to buy or sell a good. The centralized facility can be a location, a clearinghouse, or even a computer. An important aspect of the auction market is that all information about offers and bids is centralized where it is readily accessible to all buyers and sellers. As all of the market participants converge, buyers and sellers need not search for each other, and a mutually agreeable price can be established, eliminating the bid-ask spread. Assets such as art, jewelry, and antiques are sold in periodic auction markets. The New York Stock Exchange is an example of a continuous auction market.
Some auction markets can be studied using technical analysis, while others cannot. For example, auction markets in paintings could not be subject to technical analysis because a painting is unique and not substitutable with another painting. The auction market for U.S. Treasury bills, however, can be analyzed with the tools of technical analysis because U.S. Treasury bills are highly liquid securities and are easily substitutable. Because organized exchanges are structured for continuous trading in liquid, substitutable assets, they are usually subject to technical analysis.
Types of Contracts
Now let us look at categorizing markets by the type of contract that is executed. Two broad contract categories are the cash market and the derivative market. The futures market and the option market are subcategories of the derivative market. Table 1 shows the types of assets that might be bought and sold in the cash, futures, and option markets.
Table 1 Asset Categories Traded in Cash, Futures, and Option Markets
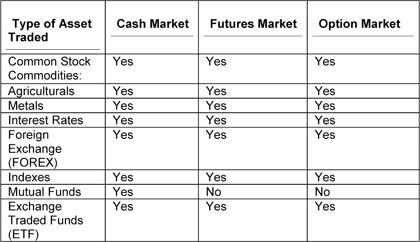
Cash Market
The cash, or spot, market is the oldest type of market. In the cash market, a contract is entered into that will result in immediate exchange of the agreed-upon items. Different rules and conventions regarding the meaning of “immediate” apply depending upon the type of asset being traded. For example, when foreign currencies are being exchanged, delivery is usually instantaneous or at least within two days. In the case of common stock, the delivery period is three days. In the case of cash commodities, each market has its own rules and conventions. Cash indexes trade almost exactly like common stocks, and their delivery is regulated by the exchanges upon which they are traded.
The stock market, the most widely recognized cash market, is open to the public. In the cash commodities markets, the prime producers or consumers of the commodity traded often dominate. For example, Nestle is a large participant in the cocoa cash market; Exxon is a major participant in the oil cash market; Citibank is a major participant in the financial cash market (bonds, notes, fed funds, and so on); and UBS is a principal participant in the FOREX (foreign exchange) cash market.
As technical analysts, the cash markets in which we are principally interested are the common stock and index cash markets that are available on the public stock exchanges. Cash markets can be leveraged but not usually as much as the other vehicles. The amount of leverage in the stock market, as well as the option market, is controlled by the Federal Reserve and the Securities and Exchange Commission, but various ways of getting around the regulations have been developed through the use of derivative markets and private arrangements with lenders. Nevertheless, the average trader or investor is bound by the Federal Reserve regulations, which presently require that for stocks and indexes, a minimum of 50% of market value must be in cash for overnight positions and 25% for intraday positions. This means that the trader or investor can have a 2-to-1 margin for overnight holdings and a 4-to-1 margin for pattern trades intraday. For each $1, up to $2 in securities can be purchased or sold short overnight, and $4 in securities can be held within the day. There are different rules for day traders, for holders of U.S. Treasury securities, for market makers, and for shares selling under $5, and the various exchanges and brokerage firms can have tighter margin requirements if they want. Before contemplating the use of margin, the investor or trader should inquire at the intended brokerage firm what rules and regulations would be applicable to the trading or investing style desired.
Liquidity in the cash stock markets is excellent. The volume of trades and amount of money transacted each day suggest that willing buyers and sellers can always be found. The only time that the U.S. exchanges adjust trading or close down is when the exchange’s computers go down, when a major event or severe weather affecting the United States occurs, or when the stock averages rise or decline a certain large amount, say in a panic. In the instance of a large price change, the NYSE reacts in two ways depending on its severity. When predetermined limits, called circuit breakers, based on a percentage change in the Dow Jones Industrial Average are reached, the exchange closes down all trading for a limited time. As of the first quarter of 2010, for example, should the Dow decline more than 1,050 points (10%) in a day before 2:00 p.m. EST, the exchange would close for an hour. After 2:00 p.m. but before 2:30 p.m., it would close for 1/2 hour, and after 2:30 p.m., it wouldn’t close at all. Should the Dow decline 2,100 points (20%) within a day, the exchange would stop trading for two hours unless it was after 2:00 p.m., in which case it would close for the day. Should the Dow decline 3,150 (30%) points within the day, the exchange would halt trading for the remainder of the day. The limits adjust each quarter based on the Dow level for the previous quarter and have only triggered a shutdown once, on October 27, 1997, when the Dow Jones Industrial Average declined 550 points by 3:30 p.m.
Derivative Markets
The term derivative describes a financial contract that “derives” its value from some other investment vehicle, often called the underlying. The primary use for derivatives is to hedge against risk of loss in the underlying or to speculate with high leverage. Aside from the risk of loss from the hedge or speculation decreasing in value, both hedging and speculation take on additional risks such as counterparty risk, the risk that the party on the other side of the derivative contract may fail to deliver. However, most derivatives have not had this problem and are used principally to transfer risk between investing parties. In this sense, derivatives are thought to cushion economic downturns. In specific instances, however, the derivative market increased volatility, as occurred during the “insurance programs” in 1987, when equity portfolio managers to protect against losses in their portfolios sold S&P 500 futures as the market declined and thus contributed further to the market decline that turned into a crash in prices not seen ever before.
The most common derivatives are futures, options, and swaps, traded either on exchanges, where their prices are visible, or over the counter, where their prices are hidden. The principal underlying vehicles are commodities, equities, FOREX, interest rates, and credit markets.
Futures Markets
Futures contracts that are traded in the futures markets are contracts in which the buyer and seller agree to trade at specific terms at a specific future date. Futures markets are often incorrectly called commodity markets more from historical usage than as a realistic description. Futures markets first developed in the agricultural markets as forward contracts, mostly in the grain markets, to provide a hedge for farmers and banks against crop failure or surplus. To understand the development of the futures market, suppose that you are a wheat farmer. You are concerned about the market price of wheat at harvest time. If the price is not as high as you anticipated because of a bumper crop of wheat, your profits will suffer. American Bread Company (ABC) is also concerned about the price of wheat, although ABC’s concern is the opposite of yours. ABC’s fear is that a poor wheat crop will lead to rising wheat prices, which translates into higher input costs and lower profits for ABC. You and ABC can ease your concerns by entering into a forward contract. In this forward contract, you would agree to sell a particular amount of wheat to ABC at a particular future date and at a price you set now. This reduces your risk and ABC’s risk, you know what to expect as far as your income, and ABC locks in the price of its input.
Although individuals wrote forward contracts for many years, the contracts were first traded in the United States on the Chicago Board of Trade (CBOT) in 1848. However, the trading was cumbersome because the contracts were nonstandard: They each had different delivery dates and different commodity quality specifications. To address this issue, the CBOT developed the standardized contracts we know today as “futures contracts” in 1865 (Brecht, 2003).
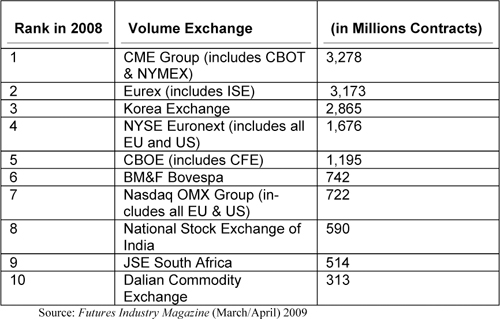
The CBOT, often referred to as “The Board of Trade,” is the oldest futures exchange in North America. Ironically, the largest is the Chicago Mercantile Exchange (CME Group), often called the “Merc,” that now owns the CBOT and the NYMEX. Today, there are a number of futures exchanges throughout the world, many specializing in contracts of specific underlying assets. Futures exchanges are becoming a minigrowth industry as developing nations are organizing markets to trade especially in local products. As Table 2 demonstrates, some of the largest futures exchanges are outside of North America.
Table 2 Ten Largest Futures Exchanges in Derivative Trading Volume
Futures, unlike stocks, are contracts and represent an agreement to purchase or sell a very specific amount and quality of asset at the expiration date. Most nonfinancial contracts are either closed in the marketplace by selling or buying before their first delivery day or are “delivered.” For example, if you own one contract in sugar and do not sell it before the delivery day, you are obligated legally to accept delivery of several railroad boxcar loads of sugar at your railhead. Major dealers in these commodities have the facilities to take or make delivery; most speculators do not. When a trader buys a futures contract then, he does not own anything other than an obligation to take delivery on the delivery day of the commodity underlying the contract. Because the contract is not a specific title of ownership, it is never executed until the delivery day. It is traded back and forth between buyers and sellers, similar to how musical chairs are played, only the music stops on delivery day. Financial futures contracts are different from commodity futures contracts in that they settle on delivery day with cash based on the closing prices of the underlying securities or index.
When a position is initiated in a futures contract, the brokerage firm requires a good faith deposit that requires the trader to make good on any fluctuation in the contract price value. As the price of the contract rises and declines, the good faith deposit is increased or decreased by the amount of the price value change. When the deposit declines below a certain level, the brokerage firm requires that more funds be added to the account. Otherwise, the brokerage firm closes the position.
Margin requirements change as the price of the contract changes, as the price level or volatility changes, or if the exchange determines that the price may change significantly. Exchanges determine the minimum requirements for their contracts, and brokers may set rates higher but not lower than the exchange requirements. There are two types of margin—initial and maintenance. Initial is the amount necessary in the account before an order can be placed. Maintenance margin is the minimum amount necessary to keep an account active. This margin changes each day with the movement of the contract price.
Futures contracts trade in a series of contract months, and each is a unique contract group. The May 2005 Heating Oil futures are different from the June 2005 Heating Oil futures. They are substitutable for their specific contract months but not for each other. On a futures contract, the expiration day, the specific description of the underlying, and the contract size are constants while the price fluctuates. Financial futures are the same in this respect. Their expiration months are quarterly (March, June, September, and December) for each year.
The advantages of futures relative to stocks are many. Futures do not require an uptick for short-selling; they are highly leveraged; and they have a favorable tax benefit. Any futures trade is automatically allocated 60% to long-term gain/loss and 40% to short-term gain/loss. Furthermore, at year-end, the brokerage firm sends only one piece of paper with the net gain or loss for the year rather than a wheelbarrow full of transaction tickets needed to fill out the IRS Schedule D.
The danger of futures centers on its leverage and, in some instances, its illiquidity. Counterparty risk is alleviated through guarantees enforced by the exchanges on all participating parities. The margin requirement for most futures contracts is less than 10%. It is not required that futures traders use all their margin. Indeed, prudent money management would suggest otherwise, but the danger of trading without protective stops has been the ruination of many traders. The other major danger is in more illiquid futures markets where what is called a limit day occurs. Some futures have daily range limits. This practice has declined over the past few years to the point where some futures have limits only for contracts older than the spot month. Nevertheless, a daily price limit, when applicable, means that once the daily range limit from open to high or low is reached, trading in that contract is shut down. If one has a stop order that was not executed when the range was exceeded and the market shut down, too bad. Sometimes several range or daily limit days occur in a row and no trading takes place at all. On a highly leveraged position on the wrong side of the market, this can be ruinous. In the liquid markets such as the financial markets, a limit day is rarely seen because the liquidity of the market is so strong. Nevertheless, a limit day is a risk to be considered.
Option Markets
An option contract gives the holder the right, but not the obligation, to complete the transaction stated in the contract before the expiration date of the contract. There are two basic types of options—call options and put options. The call option gives the owner the option to buy an asset at a particular price, known as the strike price, before the option expiration date. The owner of a put option has the right to sell the stated asset at the strike price before the option expiration date.
Technical analysis is useful in the cash and futures vehicles but not so much in the options markets. Option markets usually have a short life span and with certain exceptions, such as the index options, less liquidity than the other vehicles. Because options are derivatives of the cash or futures markets (the “underlying” markets), often these markets are analyzed first and then trading rules are applied to the options markets. For example, in the S&P 500 futures, a technical buy signal may be generated and the trader, instead of acting on the future, will buy the call, sell the put, or create some kind of combination of calls and puts. This is extremely dangerous for the novice because options include sizable leverage risk and other complications. Options are a subject all their own and are not covered in this book. Because options are derivatives of other vehicles, the student should well understand the cash and futures market before studying or entering the options markets.
Most options trade on exchanges. However, there are esoteric options that trade over the counter in an invisible market between large institutions. These options include the credit default options (CDO) that caused so many problems in the recent financial breakdown. These markets are not freely traded, nor are prices readily available for technical analysis. Within institutions that trade such vehicles, prices may be available for study, but for the public they are not.
Swaps and Forwards
Swaps and forwards are traded over the counter, not on exchanges where prices are continuous and visible. Often, these contracts are specific to the parties only, not transferable, not freely traded, and do not have continuous prices. For these reasons, technical analysis is impossible. Swaps are contracts between parties agreeing to swap certain investment vehicles, one interest rate vehicle for another, for example. Forwards are swap agreements to swap similar investment vehicles sometime in the future. Repurchase agreements, for example, where one agrees to sell and then repurchase Treasury bills are forward swaps. Technical analysis is inapplicable to most of these contracts because they are not freely traded or substitutable with continuous prices. Indeed, in many cases, these contracts cannot be valued.
This item is sold with the understanding that neither the author nor the publisher is engaged in rendering legal, accounting, or other professional services or advice by publishing this item. Each individual situation is unique. Thus, if legal or financial advice or other expert assistance is required in a specific situation, the services of a competent professional should be sought to ensure that the situation has been evaluated carefully and appropriately. The author and the publisher disclaim any liability, loss, or risk resulting directly or indirectly from the use or application of any of the contents of this item.