
Chapter 4. Monitoring services, processes, and events
As an administrator, you need to keep an eye on network systems. The status and usage of system resources can change dramatically over time. Services might stop running. File systems might run out of space. Applications might throw exceptions that, in turn, can cause system problems. Unauthorized users might try to break into the system. The techniques discussed in this chapter can help you identify and resolve these and other system problems.
Managing applications, processes, and performance
Any time you start an application or type a command at the command line, Windows Server 2012 R2 starts one or more processes to handle the related program. Generally, processes you start in this manner are called interactive processes—that is, you start the processes interactively with the keyboard or mouse. If the application or program is active and selected, the interactive process has control over the keyboard and mouse until you switch control by terminating the program or selecting a different one. When a process has control, it’s said to be running in the foreground.
Processes can also run in the background. For processes started by users, this means that programs that aren’t currently active can continue to operate, but they generally aren’t given the same priority as active processes. You can also configure background processes to run independently of the user logon session; the operating system usually starts such processes. An example of this type of background process is a scheduled task run by the operating system. The configuration settings for the task tell the system to execute a command at a specified time.
Getting started with Task Manager
The key tool you use to manage system processes and applications is Task Manager. You can use any of the following techniques to display Task Manager:
Press Ctrl+Shift+Esc.
Press Ctrl+Alt+Del, and then tap or click Task Manager.
Press the Windows logo key, type taskmgr, and then press Enter.
Press and hold or right-click the taskbar, and then tap or click Task Manager on the shortcut menu.
Note
When you press the Windows logo key and type taskmgr, two matches are displayed. One match is the full name, Task Manager. The other match is the command name, taskmgr.
The following sections cover techniques you use to work with Task Manager.
Viewing and working with processes
Task Manager has two general views:
Summary. Shows only applications running in the foreground, which lets you quickly select and work with foreground applications
Expanded. Expands the view, providing additional tabs that you can use to get information about all running processes, system performance, connected users, and configured services
If you are in summary view, you can switch to expanded view by tapping or clicking More Details. If you are in the expanded view, you can switch to summary view by tapping or clicking Fewer Details. When you close and reopen Task Manager, the view that you last used is displayed.
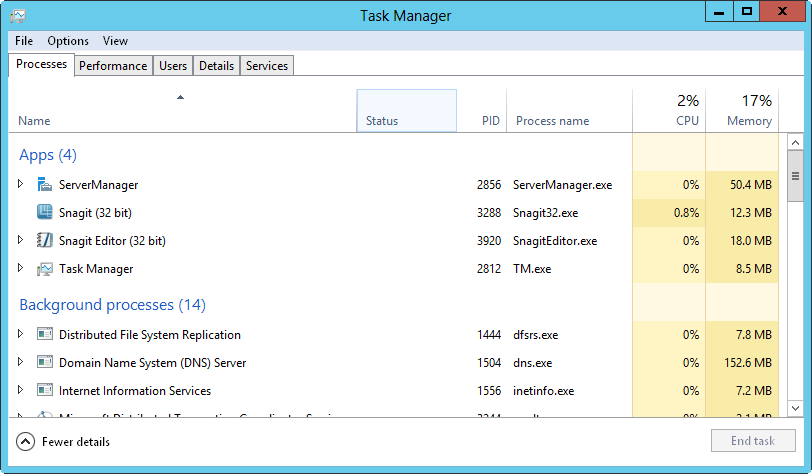
Generally, as an administrator, you’ll work with the expanded view. As shown in Figure 4-1, the expanded view has multiple tabs you can select to work with running processes, system performance, connected users, and configured services. The Processes tab, also shown in Figure 4-1, shows the general status of processes. Processes are grouped by type and listed alphabetically within each type by default. There are three general types:
Apps, which are programs running in the foreground
Background processes, which are programs running in the background
Windows processes, which are processes run by the operating system
Note
The Group By Type option on the View menu controls whether grouping is used. If you clear this option, all processes are listed alphabetically without grouping by type. Note also that you can start a new program from within Task Manager by tapping or clicking Run New Task on the File menu and then entering a command to run the application. Options are included for running the task with Administrator privileges and for browsing to find the executable you want to work with.
Real World
Many Windows processes also are grouped by the service host they are running under, which can include Local Service, Local System, and Network Service. The number of grouped processes is shown in parentheses, and you can expand the related node to view the actual processes. Select Expand All on the View menu to expand all process groups for easy viewing.
The Status column tells you whether an application is running normally or has stopped responding. A blank status is normal and indicates the process is running normally. Any other status indicates a problem, such as when an application might be frozen and you might want to end the task related to it. However, some applications might not respond to the operating system during certain process-intensive tasks. Because of this, you should be certain the application is really not responding before you end its related task.
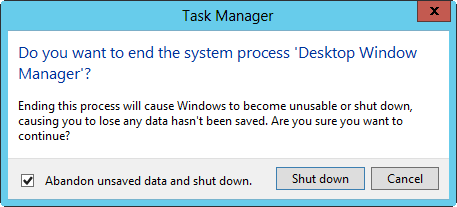
You can stop a process by selecting the process and then tapping or clicking End Task. You shouldn’t try to stop Windows processes by using this technique. If you try to stop a Windows process or a group of Windows processes, Task Manager displays a warning prompt similar to the one shown in Figure 4-2. This warning states that ending this process will cause Windows to become unusable or to shut down. To proceed, you must select Abandon Unsaved Data And Shut Down, and then tap or click Shut Down. Windows then displays a blue screen with an error code. After collecting error information, Windows will restart.
Other columns on the Processes tab provide a lot of information about running processes. You can use this information to determine which processes are over-consuming system resources, such as CPU time and memory. Although only CPU and Memory columns are displayed by default, other columns can be added by pressing and holding or right-clicking any column header and then selecting check boxes for the additional columns to display. In addition to name and status, the other available columns include the following:
CPU. The percentage of CPU utilization for the process (across all cores). The bold value in the column header represents the total CPU utilization for the server (across all cores).
Memory. The total physical memory reserved for the process. The bold value in the column header represents the total physical memory utilization for the server.
Command Line. The full file path to the executable running the process, and any command-line arguments passed in when the process was started.
PID. The numeric identifier for the process.
Process Name. The name of the process or executable running the process.
Publisher. The publisher of the process, such as Microsoft Corporation.
Type. The general process type displayed as app, background process, or Windows process. This information is useful if you cancel the selection for the Group By Type option on the View menu.
Pressing and holding or right-clicking an application’s listing in Task Manager displays a shortcut menu that you can use to do the following:
Administering processes
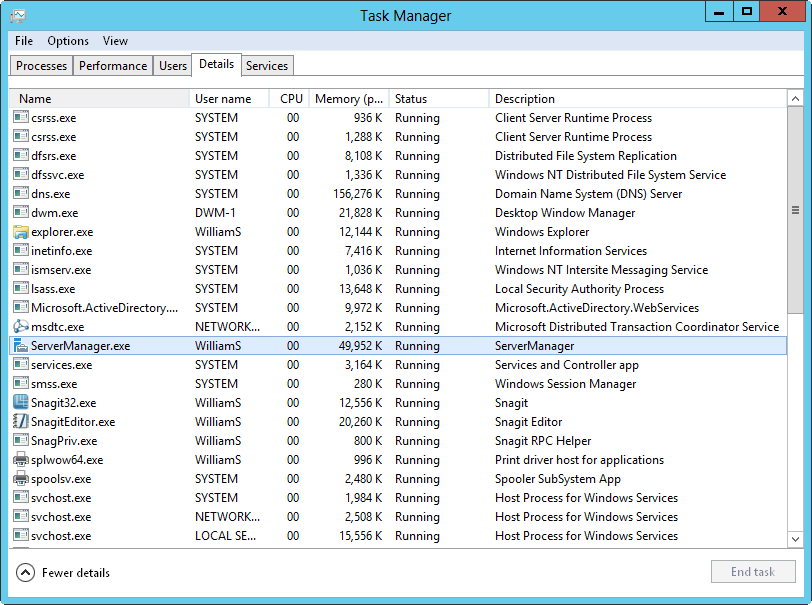
Task Manager’s Details tab is shown in Figure 4-3. This tab provides detailed information about the processes that are running. The columns displayed by default on the Details tab are similar to those provided on the Processes tab:
Name. The name of the process or executable running the process
User Name. The name of the user or system service running the process
CPU. The percentage of CPU utilization for the process
Memory (Private Working Set). The amount of physical memory reserved by the process
Status. The run status of the process
Description. A description of the process
Other columns can be added by pressing and holding or right-clicking any column header and then tapping or clicking Select Columns. When you’re trying to troubleshoot system problems by using process information, you might want to add the following columns to the view:
Base Priority. Displays how much of the system’s resources are allocated to a process. To set the priority for a process, press and hold or right-click the process, choose Set Priority, and then select the new priority from these options: Low, Below Normal, Normal, Above Normal, High, and RealTime. Most processes have a normal priority by default. The highest priority is given to real-time processes.
CPU Time. Shows the total amount of CPU cycle time used by a process since it was started. To quickly display the processes that are using the most CPU time, display this column, and then tap or click the column header to sort process entries by CPU time.
Data Execution Protection. Specifies whether DEP is enabled or disabled for the process.
Elevated. Specifies whether the process is running with elevated, administrator privileges.
Handles. Shows the total number of file handles maintained by the process. Use the handle count to gauge how dependent the process is on the file system. Some processes, such as those used by Microsoft Internet Information Services (IIS), have thousands of open file handles. Each file handle requires system memory to be maintained.
I/O Reads, I/O Writes. Shows the total number of disk input/output (I/O) reads or writes since the process was started. Together, the number of I/O reads and writes tells you how much disk I/O activity has occurred. If the number of I/O reads and writes is growing disproportionately to actual activity on the server, the process might not be caching files or file caching might not be properly configured. Ideally, file caching reduces the need for I/O reads and writes.
Page Faults. Shows whether there are page faults. A page fault occurs when a process requests a page in memory and the system can’t find it at the requested location. If the requested page is elsewhere in memory, the fault is called a soft page fault. If the requested page must be retrieved from disk, the fault is called a hard page fault. Most processors can handle large numbers of soft faults. Hard faults, however, can cause significant delays.
Paged Pool, NP Pool. Shows the paged pool and nonpaged pool. A paged pool is an area of system memory for objects that can be written to disk when they aren’t used. NP pool, or nonpaged pool, is an area of system memory for objects that can’t be written to disk. You should note processes that require a large amount of nonpaged pool memory. If there isn’t enough free memory on the server, these processes might be the reason for a high level of page faults.
Peak Working Set. Shows the highest amount of memory used by the process. The change, or delta, between current memory usage and peak memory usage is also important to note. Applications that have a high delta between base memory usage and peak memory usage, such as Microsoft SQL Server, might need to be allocated more memory when they start so that they perform better.
Platform. Specifies whether the process is running on the 64-bit or 32-bit platform. Windows 64-bit editions support both 64-bit and 32-bit applications by using the Windows on Windows 64 (WoW64) x86 emulation layer. The WoW64 subsystem isolates 32-bit applications from 64-bit applications. This prevents file-system and registry problems. The operating system provides interoperability across the 32-bit/64-bit boundary for the Component Object Model (COM) and for basic operations. However, 32-bit processes cannot load 64-bit dynamic-link libraries (DLLs), and 64-bit processes cannot load 32-bit DLLs.
Process ID (PID). Shows the numeric identifier for the process.
Session ID. Shows the identifier for the session under which the process is running.
Threads. Shows the current number of threads the process is using. Most server applications are multithreaded. Multithreading allows concurrent execution of process requests. Some applications can dynamically control the number of concurrently executing threads to improve application performance. Too many threads, however, can actually reduce performance, because the operating system has to switch thread contexts too frequently.
UAC Virtualization. Indicates whether User Account Control (UAC) virtualization is enabled, disabled, or not allowed in the process. UAC virtualization is needed for legacy applications written for early releases of Windows. When UAC virtualization is enabled for these applications, error notifications and error logging related to virtualized files and registry values are written to the virtualized location rather than to the actual location to which the process was trying to write. If virtualization is required but disabled or not allowed, the process will silently fail when trying to write to protected folders or protected areas of the registry.
If you examine processes running in Task Manager, you’ll notice a process called System Idle Process. You can’t set the priority of this process. Unlike processes that track resource usage, System Idle Process tracks the percentage of system resources that aren’t used. Thus, a 99 in the CPU column of the System Idle Process means that 99 percent of system resources currently aren’t being used.
Processes that are waiting to use a resource that is locked by another process are in a wait state and can continue only when the locked resource is released. As part of normal operations, resources are locked for one process or another and then released to be used by another process. Sometimes, though, with poorly architected programs, a process can get stuck waiting for a resource that never gets released.
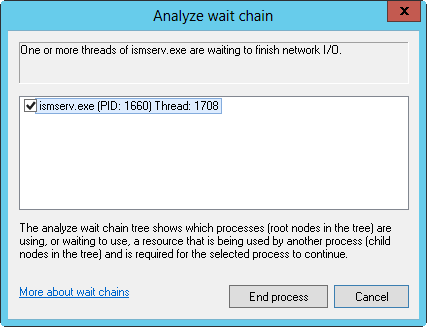
You can view the wait chain for processes by pressing and holding or right-clicking the process and then tapping or clicking Analyze Wait Chain. If the process is waiting for a resource to be released, the wait chain is displayed for that process (as shown in Figure 4-4). The root node in the wait tree is the process using, or waiting to use, the required resource. A process waiting on another process for a resource might explain why a process doesn’t seem as responsive as you might expect.
If you suspect there’s a locking problem, you can select one or more processes in the wait chain and then tap or click End Process. Task Manager then stops the processes, which should free the locked resource. However, keep in mind that it is routine and normal for processes to lock resources while those resources are being used and then to free the resources when they are no longer being used. A problem occurs when a process fails to release a resource, as can happen with a poorly architected program.
As you examine processes, keep in mind that a single application might start multiple processes. Generally, these processes are dependent on a central process. From this main process, a process tree containing dependent processes is formed. You can find the main process for an application by pressing and holding or right-clicking the application on the Processes tab and selecting Go To Details. When you terminate processes, you’ll usually want to target the main application process or the application itself rather than dependent processes. This ensures that the application is stopped cleanly.
To stop the main application process and dependent processes, you have several choices:
Press and hold or right-click the application on the Processes tab, and then tap or click End Task.
Press and hold or right-click the main application process on the Details tab, and then tap or click End Task.
Press and hold or right-click the main or a dependent process on the Processes tab, and then tap or click End Process Tree.
Viewing system services
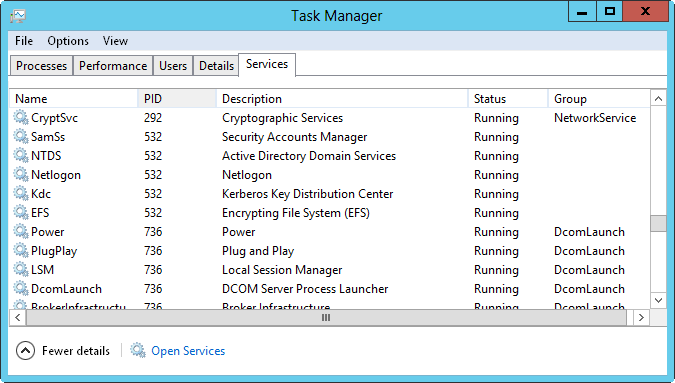
Task Manager’s Services tab provides an overview of system services. This tab displays services by name, process ID, description, status, and group. As shown in Figure 4-5, multiple services typically run under the same process ID. You can quickly sort services by their process ID by tapping or clicking the related column heading. You can tap or click the Status column heading to sort services according to their status, Running or Stopped.
The Group column provides additional options about related identities or service host contexts under which a service runs:
Services running under an identity with a restriction have the restriction listed in the Group column. For example, a service running under the Local Service identity might be listed as LocalServiceNoNetwork to indicate that the service has no network access, or a service might be listed as LocalSystemNetworkRestricted to indicate that the service has restricted access to the network.
Services that have Svchost.exe list their associated context for the –k parameter. For example, the RemoteRegistry service runs with the command line svchost.exe –k regsvc. An entry of regsvc appears in the Group column for this service.
Pressing and holding or right-clicking a service’s listing in Task Manager displays a shortcut menu that allows you to do the following:
Start a stopped service.
Stop a started service.
Go to the related process on the Details tab.
Viewing and managing system performance
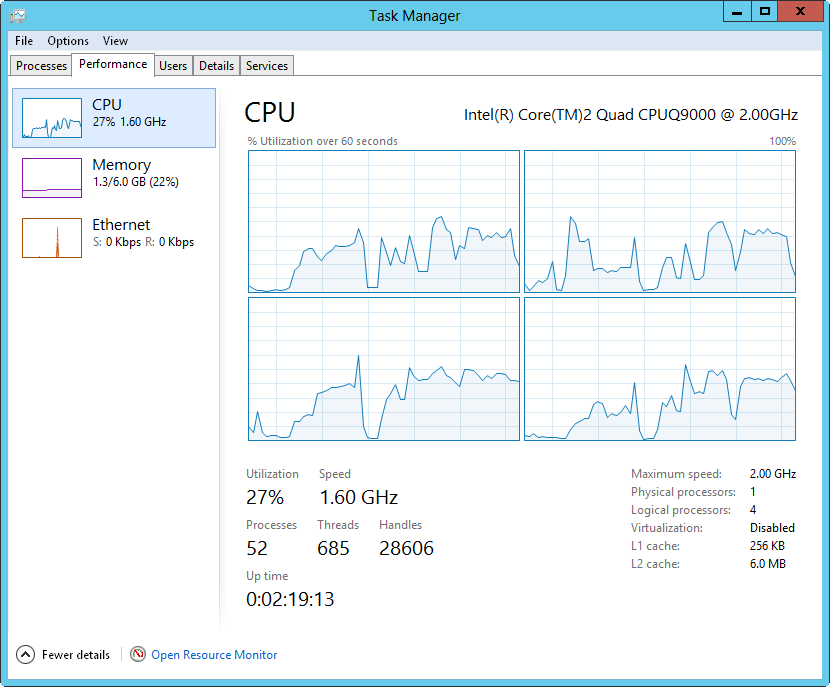
The Performance tab in Task Manager provides an overview of CPU and memory usage. As shown in Figure 4-6, the tab displays graphs and statistics. This information gives you a quick check of system resource usage. For more detailed information, use Performance Monitor, as explained later in this chapter.
The graphs on the Performance tab provide the following information:
CPU. A graph of CPU usage plotted over time
Memory. A graph of memory usage plotted over time
Ethernet. A graph of network throughput plotted over time
Tap or click a summary graph in the left pane to view detailed information for that graph in the right pane. To view a close-up of any graph, double-tap or double-click the graph. Double-tapping or double-clicking again returns you to normal viewing mode.
The Update Speed option on the View menu allows you to change the speed of graph updating and to pause the graph. Updates occur once every four seconds for Low, once every two seconds for Normal, and twice per second for High.
CPU usage: the basics
When you select CPU, the % Utilization graph shows overall processor utilization for the last 60 seconds. If a system has multiple CPUs, a graph is displayed for each CPU by default. You also can view logical processors or NUMA nodes by pressing and holding or right-clicking a CPU graph, clicking Change Graph To, and then clicking Logical Processors or NUMA Nodes as appropriate.
To view kernel times, press and hold or right-click a CPU graph, and then select Show Kernel Times. Because usage by the kernel is plotted separately, you can more easily track the amount of CPU time used by the operating system kernel.
Tip
Tracking the kernel usage can be helpful for troubleshooting. For example, if you are using Microsoft Internet Information Services (IIS) with output caching in kernel mode, you can get a better understanding of how kernel caching might be affecting CPU usage and overall performance by showing kernel times. Kernel usage tracking isn’t enabled by default because it adds to the overhead of monitoring a server in Task Manager.
You can use the CPU information provided to quickly determine the up time for the server, the number of physical processors, the number of logical processors, whether hardware virtualization is enabled, and the amount of on-processor cache for each available register (L1, L2, L3). Keep the following in mind:
Handles. Shows the number of I/O handles in use; I/O handles act as tokens that let programs access resources. I/O throughput and disk performance affect a system more than a consistently high number of I/O handles.
Threads. Shows the number of threads in use; threads are the basic units of execution within processes.
Processes. Shows the number of processes in use; processes are running instances of applications or executable files.
Up Time. Shows how long the system has been up since it was last started.
If CPU usage is consistently high, even under average usage conditions, you might want to perform more detailed performance monitoring to determine the cause of the problem. Memory is often a source of performance problems, and you should rule it out before upgrading or adding CPUs. For more details, see Chapter 5
Memory usage: the basics
When you select Memory, the Memory Usage graph shows overall usage of the private working set for the last 60 seconds. The Memory Composition histogram shows the following:
In-Use Memory. The amount of memory being used by processes
Modified Memory. The amount of memory whose contents must be written to disk before the memory can be used for another purpose
Standby Memory. The amount of memory with cached data and code not actively being used
Free Memory. The amount of memory that is not currently allocated for any purpose
Note
You can use the memory information provided to quickly determine the speed of the memory, the number of memory slots used and available, and the memory form factor.
The total amount of physical RAM configured on the server is listed in the upper-right corner when you are working with the memory graphs. Other memory statistics shown below the memory graphs provide the following information:
In Use. Shows the amount of physical RAM that is in use on the server.
Available. Shows the amount of physical RAM that is available for use (in-cludes memory marked as standby and free). If a server has very little physical memory free, you might need to add memory to the system. In general, you want the free memory to be no less than 5 percent of the total physical memory on the server.
Committed. Lists the virtual memory currently in use followed by the total amount of virtual memory available. If the current page file usage is consistently within 10 percent of the maximum value (meaning consistent usage of 90 percent or more), you might want to add physical memory, increase the amount of virtual memory, or do both.
Cached. Shows the amount of memory used for system caching.
Paged Pool. Provides information on noncritical kernel memory used by the operating system kernel.
Non-paged Pool. Provides information on critical kernel memory used by the operating system kernel.
Critical portions of kernel memory must operate in RAM and can’t be paged to virtual memory. Because of this, this type of kernel memory is listed as being in the nonpaged pool. The rest of kernel memory can be paged to virtual memory and is listed as being in the paged pool.
Network usage: the basics
When you select Ethernet, Task Manager provides an overview of the network adapters used by the system. You can use the information provided to quickly determine the percent utilization, link speed, and operational status of each network adapter configured on a system.
The name of the active network adapter in the Network Connections folder is shown in the upper-right corner. If a system has one network adapter, the summary graph shows details of the network traffic on this adapter over time. If a system has multiple network adapters, the graph displays a composite index of all network connections, which represents all network traffic.
You can view detailed information about link speed, link state, bytes sent, bytes received, and more by pressing and holding or right-clicking the Network Throughput graph and then clicking View Network Details. When working with network details, keep the following in mind:
Network Utilization. Percentage of network usage based on the initial connection speed for the interface or the combined speed of teamed interfaces. For example, an adapter with an initial link speed of 10 gigabits per second (Gbps) and current traffic of 100 megabits per second (Mbps) is utilized at 1 percent.
Link Speed. Connection speed of the interface as determined by the initial connection speed, such as 1 Gbps or 10 Gbps.
State. Operational status of network adapters, such as Connected or Disconnected.
Bytes Sent Throughput. Percentage of current connection bandwidth used by traffic sent from the system.
Bytes Received Throughput. Percentage of current connection bandwidth used by traffic received by the system.
Bytes Throughput. Percentage of current connection bandwidth used for all traffic on the network adapter.
Bytes Sent. Cumulative total bytes sent on the connection to date.
Bytes Received. Cumulative total bytes received on the connection to date.
Bytes. Cumulative total bytes on the connection to date.
Real World
Any time usage is consistently approaching or exceeding 50 percent of total capacity, you should start monitoring the server more closely, and you might want to consider adding network adapters. Plan any upgrade carefully; a lot more planning is required than you might think. Consider the implications not only for that server but also for the network as a whole. You might also have connectivity problems if you exceed the allotted bandwidth of your service provider—it can often take months to obtain additional bandwidth for external connections.
Viewing and managing remote user sessions
Remote users can use Remote Desktop to connect to remote systems. Remote Desktop allows you to manage systems remotely, as if you were sitting at the console. Windows Server 2012 R2 allows up to two active console sessions at a time.
One way to view and manage remote desktop connections is to use Task Manager. To do this, start Task Manager, and then tap or click the Users tab, shown in Figure 4-7. The Users tab shows interactive user sessions for both local and remote users.
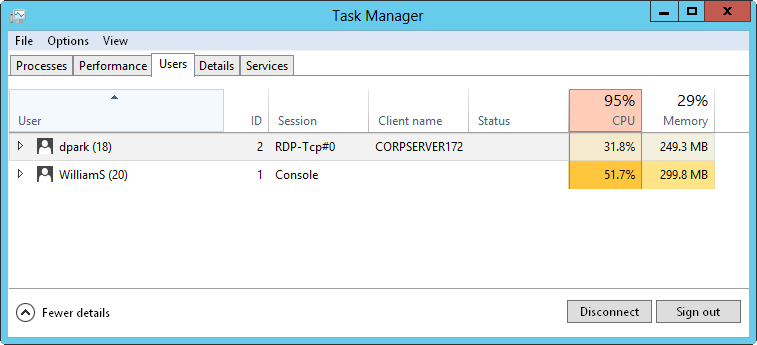
Each user connection is listed with user name, status, CPU utilization, and memory usage by default. Other columns can be added by pressing and holding or right-clicking any column header and then tapping or clicking the columns to add. Available columns include:
ID. The session ID. The first logon has a session ID of 1. The second logon has an ID of 2.
Session. The session type. A user logged on to the local system is listed with Console as the session type. Other users have a session type that indicates the connection type and protocol being used, such as RDP-TCP for a connection that is using the Remote Desktop Protocol (RDP) with TCP as the transport protocol.
Client name. For remote connections, lists the name of the originating client computer.
CPU and memory utilization details are convenient for troubleshooting performance issues related to logged-on users. The combined utilization value is listed above the column heading, and individual utilization values for each logged-on user are listed below it.
In the example shown in Figure 4-7, the server’s CPU is 95% utilized by the logged-on users. This high usage level could affect the overall performance of the server, and the server might not be as responsive when performing other tasks.
If you press and hold or right-click a user session, you have the following options:
Connect. Allows you to connect a remote user session if it’s inactive.
Disconnect. Allows you to disconnect a local or remote user session, halting all user-started applications without saving application data.
Sign Off. Allows you to log off a user by using the normal logoff process. Application data and system state information are saved just as they are during a typical logoff.
Send Message. Allows you to send a console message to a logged-on user.
Also new for Windows Server 2012 R2 is the user’s name is followed by the number of processes that user is running. If you double-tap or double-click the user’s name, an entry for each running process is displayed. Processes are listed by name, CPU usage, and memory usage.
Managing system services
Services provide key functions to workstations and servers. To manage system services on the local server or a remote server, you use the Services panel in Server Manager or the Services node in Computer Management. To work with services on remote servers, remote management and inbound exceptions for Remote Service Management must be enabled. For more information, see “Managing your servers remotely” in Chapter 3
Navigating services in Server Manager
When you are working with Server Manager and select the Local Server node, the All Servers node, or a server group node, the right pane will have a Services panel, like the one shown in Figure 4-8. If you select the server you want to work with in the Servers panel, its services are listed in the Services panel. You can use this panel as follows:
For a server you are logged on to locally, you can use the Services panel in the Local Server node.
For a local or remote server, you can use the Services panel in the All Servers node to work with services.
Automatically created server group nodes are organized by server roles, such as Active Directory Domain Services (AD DS) or Domain Name System (DNS), and you’ll be able to manage the services running on servers that role depends on.
For custom server groups created by you or other administrators, you’ll be able to use the related Services panel to manage services on any remote servers that have been added to the group.
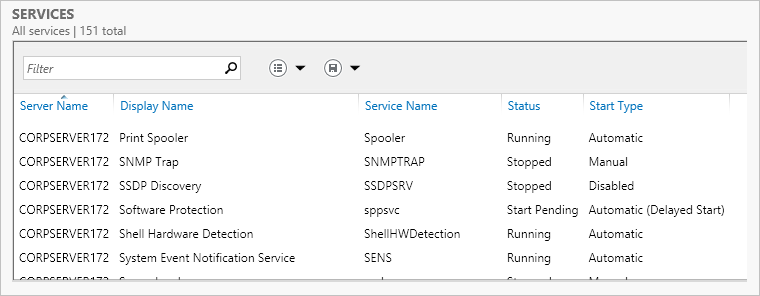
The columns on the Services panel can be adjusted by pressing and holding or right-clicking any column header and then tapping or clicking the columns to add or remove. The columns you can use include the following:
Server Name. The name of the server on which the service is running.
FQDN. The fully qualified domain name (FQDN) of the server on which the service is running.
Display Name. The descriptive name of the service.
Service Name. The internal name of the service.
Description. A short description of the service and its purpose.
Status. The status of the service as running, paused, or stopped.
Start Type. The startup setting for the service. Automatic services are started when the system starts. Users or other services start manual services. Disabled services are turned off and can’t be started while they remain disabled.
Tip
When you are working with many servers, use the service grouping options to help you more easily manage services. You can group services by server name, FQDN, display name, service name, status, and start type by pressing and holding or right-clicking any column header, selecting Group By, and then clicking your grouping option.
Navigating services in Computer Management
For quick and easy management of any service on a remote server, you can use the Services node in Computer Management. You can open Computer Management and automatically connect to a remote server from Server Manager. To do this, follow these steps:
Select All Servers or any server group node in the left pane.
On the Servers panel, press and hold or right-click the server to which you want to connect.
Tap or click Computer Management.
Tip
When you are working with remote servers in Computer Management, many features rely on remote management and appropriate firewall exceptions being enabled, as discussed in Chapter 3. If the user account you are currently using doesn’t have the appropriate credentials for working with the remote server, you won’t be able to connect to the server in Computer Management. To use alternate credentials, press and hold or right-click the server to which you want to connect, select Manage As, enter your alternate credentials, and then click OK. Optionally, you can select Remember My Credentials before clicking OK to save the credentials for each time you log on and want to work with the server remotely. After you set your credentials, press and hold or right-click the server to which you want to connect and then click Computer Management. Now Computer Management will open and connect to the server using the credentials you specified.
When you are working with Computer Management, you view and work with services by expanding the Services And Applications node and then selecting the Services node, as shown in Figure 4-9. The columns in the Services pane are slightly different from those shown when you are working with the Services node in Computer Management:
Name. The name of the service. Only services installed on the system are listed here. Double-tap or double-click an entry to configure its startup options. If a service you need isn’t listed, you can install it by installing the related role or feature, as discussed in Chapter 3.
Description. A short description of the service and its purpose.
Status. The status of the service, indicated as running, paused, or stopped. (Stopped is indicated by a blank entry.)
Startup Type. The startup setting for the service. Automatic services are started when the system starts. Users or other services start manual services. Disabled services are turned off and can’t be started while they remain disabled.
Log On As. The account the service logs on as. The default in most cases is the local system account.
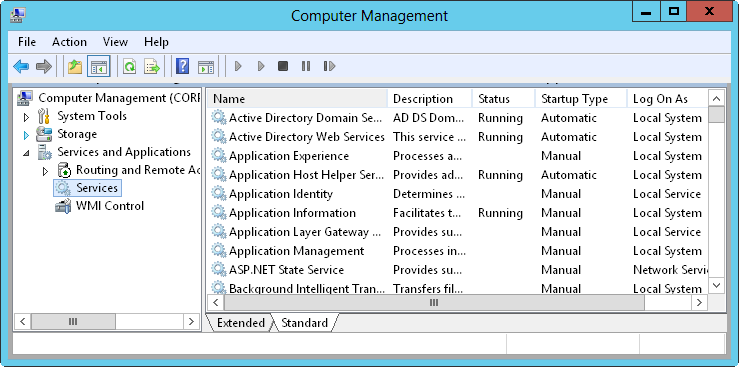
The Services pane has two views: Extended and Standard. To change the view, use the tabs at the bottom of the Services pane. In Extended view, quick links are provided for managing services. Tap or click Start to start a stopped service. Tap or click Restart to stop and then start a service—essentially resetting that service. If you select a service when the Services pane is in Extended view, a description that details the service’s purpose is displayed.
Starting, stopping, and pausing services
As an administrator, you often have to start, stop, or pause services. To start, stop, or pause a service, press and hold or right-click the service you want to manage and then select Start, Stop, or Pause as appropriate. You can also choose Restart to have Windows stop and then start the service after a brief pause. Additionally, if you pause a service, you can use the Resume option to resume normal operation.
Note
When services that are set to start automatically fail, the status is listed as blank, and you usually receive notification in a pop-up dialog box. Service failures can also be logged to the system’s event logs. In Windows Server 2012 R2, you can configure actions to handle service failure automatically. For example, you can have Windows Server 2012 R2 attempt to restart the service for you. For details, see the section “Configuring Service Recovery” later in this chapter.
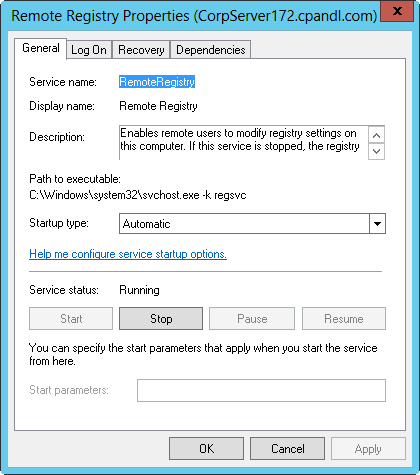
Configuring service startup
You can set services to start manually or automatically. You can also turn them off permanently by disabling them. You configure service startup in Computer Management by following these steps:
Press and hold or right-click the service you want to configure, and then choose Properties.
On the General tab, use the Startup Type list to choose a startup option from the following choices, as shown in Figure 4-10:
Automatic. Select Automatic to start services when the system starts.
Automatic (Delayed Start). Select Automatic (Delayed Start) to delay the start of the service until all nondelayed automatic services have started.
Manual. Select Manual to allow the services to be started manually.
Disabled. Select Disabled to turn off the service.
Tap or click OK.
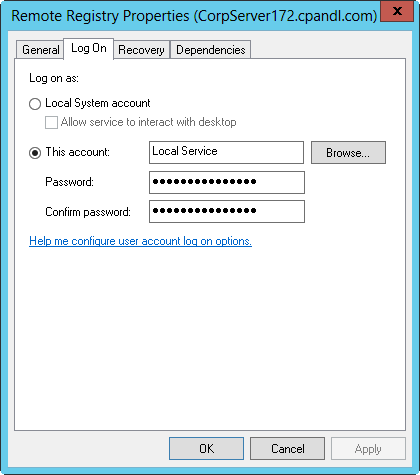
Configuring service logon
You can configure services to log on as a system account or as a specific user. To do either, follow these steps:
In Computer Management, press and hold or right-click the service you want to configure, and then click Properties.
Click the Log On tab, shown in Figure 4-11.
Click Local System Account if you want the service to log on by using the system account (the default for most services). If the service provides a user interface that can be manipulated, select Allow Service To Interact With Desktop to allow users to control the service’s interface.
Click This Account if you want the service to log on by using a specific user account. Be sure to enter an account name and password in the text boxes provided. Use the Browse button to search for a user account if necessary.
Tap or click OK.
Security Alert
You should keep track of any accounts that are used with services. These accounts can be the source of security problems if they’re not configured properly. Service accounts should have the strictest security settings and as few permissions as possible while allowing the service to perform necessary functions. Typically, accounts used with services don’t need many of the permissions you would assign to a typical user account. For example, most service accounts don’t need the right to log on locally. Every administrator should know what service accounts are used (so that they can better track the use of these accounts) and should treat the accounts as if they were administrator accounts. This means using secure passwords, carefully monitoring account usage, carefully applying account permissions and privileges, and so on.
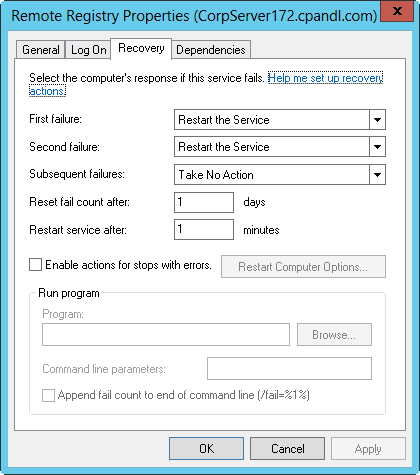
Configuring service recovery
You can configure services to take specific actions when a service fails. For example, you can attempt to restart the service or run an application. To configure recovery options for a service, follow these steps:
In Computer Management, press and hold or right-click the service you want to configure, and then click Properties.
Tap or click the Recovery tab, shown in Figure 4-12.
Figure 4-12. Use the Recovery tab to specify actions that should be taken in case of service failure.Note
Windows Server 2012 R2 automatically configures recovery for critical system services during installation. In most cases, you’ll find that critical services are configured to restart automatically if the service fails. Some extremely critical services, such as DCOM Server Process Launcher and Group Policy Client, are configured to restart the computer if the service fails. You cannot change these settings because they are not available.
You can now configure recovery options for the first, second, and subsequent recovery attempts. The following options are available:
Take No Action. The operating system won’t attempt recovery for this failure but might still attempt recovery of previous or subsequent failures.
Restart The Service. Stops and then starts the service after a brief pause.
Run A Program. Allows you to run a program or a script in case of failure. The script can be a batch program or a Windows script. If you select this option, set the full file path to the program you want to run, and then set any necessary command-line parameters to pass in to the program when it starts.
Restart The Computer. Shuts down and then restarts the computer. Before you choose this option, double-check the computer’s Startup and Recovery options. You want the system to select defaults quickly and automatically.
Configure other options based on your previously selected recovery options. If you elected to run a program as a recovery option, you need to set options in the Run Program panel. If you elected to restart the service, you need to specify the restart delay. After stopping the service, Windows Server waits for the specified delay before trying to start the service. In most cases, a delay of one to two minutes should be sufficient.
Tap or click OK.
Disabling unnecessary services
As an administrator, you need to ensure that servers and the network are secure, and unnecessary services are a potential source of security problems. For example, in many organizations that I’ve reviewed for security problems, I’ve found servers running Worldwide Web Publishing Service, Simple Mail Transfer Protocol (SMTP), and File Transfer Protocol (FTP) Publishing Service when these services weren’t needed. Unfortunately, these services can make it possible for anonymous users to access servers and can also open the server to attack if not properly configured.
If you find unnecessary services, you have several options. With services installed through roles, role services, or features, you can remove the related role, role service, or feature to remove the unnecessary component and its related services. Or you can simply disable the services that aren’t being used. Typically, you’ll want to start by disabling services rather than uninstalling components. This way, if you disable a service and another administrator or a user says he or she can’t perform a particular task anymore, you can enable the related service again if necessary.
To disable a service, follow these steps:
In Computer Management, press and hold or right-click the service you want to configure, and then click Properties. On the General tab, click Disabled in the Startup Type list.
Disabling a service doesn’t stop a running service. It only prevents the service from being started the next time the computer is started, meaning that the security risk still exists. To address this, tap or click Stop on the General tab in the Properties dialog box, and then tap or click OK.
Troubleshooting services
When you think a computer has a problem related to services—their status or configuration, for example—one of the fastest ways to troubleshoot is to use Windows PowerShell. Windows PowerShell provides several cmdlets for working with system services, including:
Get-Service. Gets information about the services
Stop-Service. Stops one or more running services
Start-Service. Starts one or more stopped services
Suspend-Service. Suspends (pauses) one or more running services
Resume-Service. Resumes one or more suspended (paused) services
Restart-Service. Stops and then starts one or more services
Set-Service. Changes the properties or status of a service on a local or remote computer
New-Service. Creates a new Windows service in the registry and in the services database
To get a list of all services configured on a system, type get-service at the command prompt. Optionally, use the –ComputerName parameter to specify a remote computer to work with, as shown in this example:
Get-Service –ComputerName CorpServer18
If you want to check multiple computers, simply enter the computer name in a comma-separated list:
Get-Service –ComputerName Server18, Server24, Server30
Regardless of whether you check the local computer or remote computers, the standard output shows the status, name, and display name of each configured service, as shown in the following example:
Status   Name               DisplayName
------   ----               -----------
Running  ADWS               Active Directory Web Services
Stopped  AeLookupSvc        Application Experience
Stopped  ALG                Application Layer Gateway Service
Stopped  AllUserInstallA... Windows All-User Install Agent
Stopped  AppIDSvc           Application Identity
Running  Appinfo            Application Information
Knowing this, you can display information about a specific service by using its name or display name, such as the following:
Get-Service –DisplayName "Application Experience" –ComputerName CorpServer18
To match partial names, you can use wildcard characters. In this example, you want to check the status of key services used by Hyper-V:
Get-Service –DisplayName Hyper* –ComputerName CorpServer18
As part of troubleshooting, you might also want to locate all services that are disabled or stopped on a computer. To find disabled services, you can enter the following:
Get-Service | where {$_.status -eq 'disabled'}To find stopped services, you can enter the following:
Get-Service | where {$_.status -eq 'stopped'}A service can start only if the services it depends on also are started. You can use the –RequiredServices parameter to confirm the status of the services that are required for a particular service to start. Alternatively, you can check the status of services that depend on a particular service by using the –DependentServices parameter.
As part of troubleshooting, you might need to determine the start mode of services. If a service isn’t configured to start automatically, that would explain why it isn’t running. Although Get-Service doesn’t display the StartMode of services, you can use Get-WMIObject Win32_Service to get extended information about services, including their start mode.
The syntax for displaying detailed information about a particular service follows:
Get-WMIObject Win32_Service -Filter "name='serviceName'" | Select *Or you could use the following:
Get-WMIObject Win32_Service -Filter "displayname='DisplayName'" | Select *In these examples, you use Get-WMIObject Win32_Service to examine all services on a computer and filter the results by either the name or display name of the service. You then use Select-Object (which has Select as an alias) to list all associated properties.
In your troubleshooting, you might want to list the start mode of all enabled services on a computer. The following example shows one way to do this:
get-wmiobject win32_service -filter "StartMode <>'disabled'" |
sort StartMode | format-table -GroupBy StartMode
-Property Name,State
Here, you list all enabled services on a computer, sorting the output by the start mode, and then alphabetically list services in each group by name and state. The output is similar to the following:
  StartMode: Auto

Name                                                     State
----                                                        -----
Netlogon                                                  Running
NlaSvc                                                     Running
MpsSvc                                                    Running
…
   StartMode: Manual

Name                                                    State
----                                                       -----
AppReadiness                                             Stopped
vmicguestinterface                                        Stopped
UmRdpService                                            Running
…
Rather than list all services, you might instead want to quickly identify services that should be running but aren’t. To do this, you can use the following command:
get-wmiobject win32_service -filter "startmode='auto' AND state<> 'Running'" | Select Name,State
Here, you use Get-WMIObject Win32_Service to examine all services that have the Auto start mode (which includes services that have a delayed automatic start) but aren’t running. You look for services that have a state other than ‘Running’ to ensure services with any state other than ‘Running’ are included in the results, as shown in this sample output:
name                                                        state
----                                                        -----
RemoteRegistry                                              Stopped
sppsvc                                                      Stopped
workfolderssvc                                              Stopped
To determine whether a service that should have started automatically but didn’t start because a required service isn’t running, you can enter the following command:
get-wmiobject win32_service -filter "startmode='auto' AND state<> 'Running'"
| get-service -RequiredServices
Here, you use Get-WMIObject Win32_Service to examine all services that have the Auto start mode but aren’t running. You then display the details regarding services that are required for the stopped service to start. If a required service is stopped, that could explain why a service was stopped. You then typically would begin deeper troubleshooting by trying to determine why the required service didn’t start. Otherwise, if required services are running or if there are no required services, you would begin deeper troubleshooting by trying to determining why the original service didn’t start.
Event logging and viewing
Event logs provide historical information that can help you track down system and security problems. To work with services on remote servers, remote management and inbound exceptions for Remote Service Management must be enabled.
The Windows Event Log service controls whether events are tracked. When you start this service, you can track user actions and resource usage events through the event logs. Two general types of log files are used:
Windows logs. Logs that the operating system uses to record general system events related to applications, security, setup, and system components
Applications and services logs. Logs that specific applications and services use to record application-specific or service-specific events
Windows logs that are used include:
Application. This log records events logged by applications, such as the failure of SQL Server to access a database. The default location is %SystemRoot%System32WinevtLogsApplication.evtx.
Forwarded Events. When event forwarding is configured, this log records forwarded events from other servers. The default location is %SystemRoot%System32ConfigForwardedEvents.evtx.
Security. This log records events you’ve set for auditing with local or global group policies. The default location is %SystemRoot%System32WinevtLogsSecurity.evtx.
Note
Any user who needs access to the security log must be granted the user right to the following: Manage Auditing and the Security Log. By default, members of the Administrators group have this user right. To learn how to assign user rights, see the section “Configuring user rights policies” in Chapter 9
Setup. This log records events logged by the operating system or its components during setup and installation. The default location is %SystemRoot%System32WinevtLogsSetup.evtx.
System. This log records events logged by the operating system or its components, such as the failure of a service to start when the system starts. The default location is %SystemRoot%System32WinevtLogsSystem.evtx.
Security Alert
If you’re an administrator, you tend to monitor the application and system logs the most—but you shouldn’t forget about the security log. The security log is one of the most important logs, and you should monitor it closely. If the security log on a server doesn’t contain events, the likeliest reason is that local auditing hasn’t been configured, or that domainwide auditing is configured—in which case, you should monitor the security logs on domain controllers rather than on member servers.
Applications and services logs available include the following:
DFS Replication. This log records Distributed File System (DFS) replication activities. The default location is %SystemRoot%System32WinevtLogsDfs Replication.evtx.
Directory Service. This log records events logged by Active Directory Domain Services (AD DS) and its related services. The default location is %SystemRoot%System32WinevtLogsDirectory Service.evtx.
DNS Server. This log records DNS queries, responses, and other DNS activities. The default location is %SystemRoot%System32WinevtLogsDNS Server.evtx.
File Replication Service. This log records file replication activities on the system. The default location is %SystemRoot%System32WinevtLogsFile Replication Service.evtx.
Hardware Events. When hardware subsystem event reporting is configured, this log records hardware events reported to the operating system. The default location is %SystemRoot%System32ConfigHardware.evtx.
MicrosoftWindows. This provides logs that track events related to specific Windows services and features. Logs are organized by component type and event category. Operational logs track events generated by the standard operations of the related component. In some cases, supplemental logs are displayed for analysis, debugging, and recording administration-related tasks.
Windows PowerShell. This log records activities related to the use of Windows PowerShell. The default location is %SystemRoot%System32WinevtLogsWindows PowerShell.evtx.
Accessing events in Server Manager
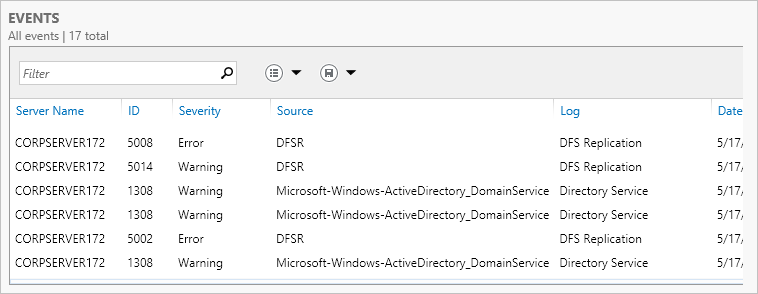
When you are working with Server Manager and select the Local Server node, the All Servers node, or a server group node, the right pane will have an Events panel, like the one shown in Figure 4-13. When you select the server you want to work with in the Servers panel, its events are listed in the Events panel. You can use this panel as follows:
For a server you are logged on to locally, you can use the Events panel in the Local Server node or the All Servers node to view recent warning and error events in the application and system logs.
Automatically created server group nodes are organized by server roles, such as AD DS or DNS, and you’ll be able to view recent error and warning events in logs related to the server role, if applicable. Not all roles have associated logs, but some roles, like AD DS, have multiple associated logs.
For custom server groups created by you or other administrators, you’ll be able to use the related Events panel to view recent warning and error events in the application and system logs.
The columns on the Events panel can be adjusted by pressing and holding or right-clicking any column header and then tapping or clicking the columns to add or remove. The columns you can use include:
Server Name. The name of the server on which the service is running
FQDN. The fully qualified domain name of the server on which the service is running
ID. Generally, a numeric identifier for the specific event, which could be helpful when searching knowledge bases
Severity. The event level as an error or warning
Source. The application, service, or component that logged the event
Log. The log in which the event was recorded
Date And Time. The date and time the event was recorded
Tip
When you are working with many servers, use the grouping options to help you more easily manage events. You can group events by server name, FDQN, ID, severity, source, log, and date and time by pressing and holding or right-clicking any column header, clicking Group By, and then selecting your grouping option.
Accessing events in Event Viewer
To work with event logs on remote servers, remote management and inbound exceptions for Remote Event Log Management must be enabled. For more information, see the section “Managing your servers remotely” in Chapter 3.
You access the event logs by following these steps:
In Server Manager, select All Servers or any server group node in the left pane.
On the Servers panel, press and hold or right-click the server to which you want to connect.
Tap or click Computer Management to automatically connect to the selected server.
In Computer Management, you view and work with the event logs by expanding the System Tools node and then selecting the Event Viewer node, as shown in Figure 4-14.
Expand the Event Viewer node. You can work with the server’s event logs in the following ways:
To view all errors and warnings for all logs, expand Custom Views, and then select Administrative Events. In the main pane, a list of all warning and error events for the server is displayed.
To view all errors and warnings for a specific server role, expand Custom Views, expand Server Roles, and then select the role to view. In the main pane, a list of all events for the selected role is displayed.
To view events in a specific log, expand the Windows Logs node, the Applications And Services Logs node, or both nodes. Select the log you want to view, such as Application or System.
Use the information in the Source column to determine which service or process logged a particular event.
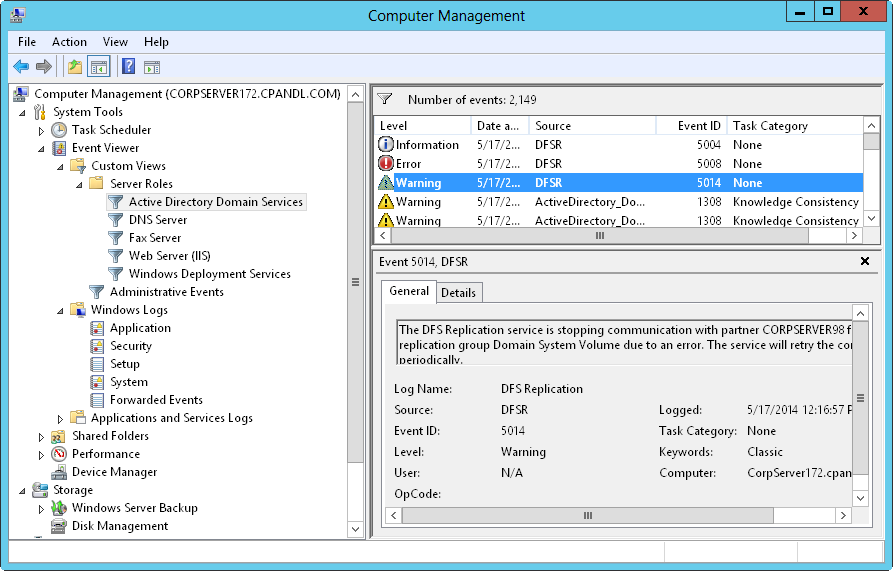
As shown in Figure 4-14, entries in the main pane of Event Viewer provide a quick overview of when, where, and how an event occurred. To obtain detailed information about an event, review the details provided on the General tab in the lower portion of the main pane. The event level or keyword precedes the date and time of the event. Event levels include the following:
Information. An informational event, which is generally related to a successful action.
Audit Success. An event related to the successful execution of an action.
Audit Failure. An event related to the failed execution of an action.
Warning. A warning. Details for warnings are often useful in preventing future system problems.
Error. A noncritical error, such as the failure of a zone transfer request on a DNS server.
Critical. A critical error, such as the Cluster service not responding because a quorum was lost.
Note
Warnings and errors are the two key types of events you’ll want to examine closely. Whenever these types of events occur and you’re unsure of the cause, review the detailed event description.
In addition to level, date, and time logged, the summary and detailed event entries provide the following information:
Source. The application, service, or component that logged the event
Event ID. Generally, a numeric identifier for the specific event, which could be helpful when searching knowledge bases
Task Category. The category of the event, which is almost always set to None, but is sometimes used to further describe the related action, such as a process or a service
User. The user account that was logged on when the event occurred, if applicable
Computer. The name of the computer on which the event occurred
Description. In the detailed entries, a text description of the event
Data. In the detailed entries, any data or error code output by the event
Filtering event logs
Event Viewer creates several filtered views of the event logs for you automatically. Filtered views are listed under the Custom Views node. When you select the Administrative Events node, a list of all errors and warnings for all logs is displayed. When you expand the Server Roles node and then select a role-specific view, a list of all events for the selected role is displayed.
If you want to create a custom view of your own, you can do so in Computer Management by following these steps:
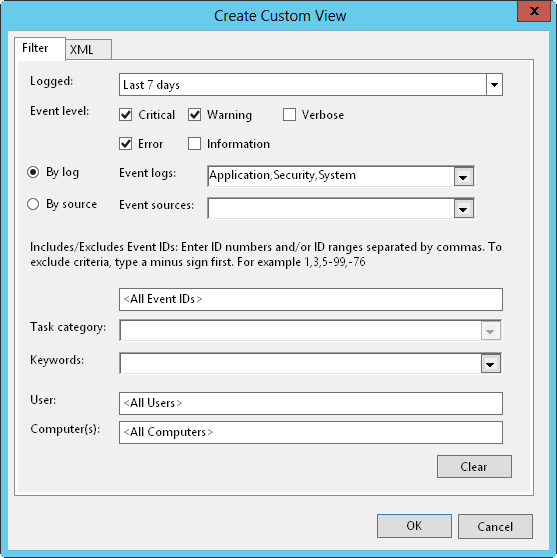
In the left pane, press and hold or right-click the Custom Views node, and then tap or click Create Custom View. This opens the dialog box shown in Figure 4-15.
Use the Logged list to select a time frame for logging events. You can choose to include events from the last hour, last 12 hours, last 24 hours, last 7 days, or last 30 days. Alternatively, you can set a custom range.
Use the Event Level check boxes to specify the level of events to include. Select Verbose to display additional details for events.
Create a custom view for either a specific set of logs or a specific set of event sources:
Use the Event Logs list to select event logs to include. You can select multiple event logs by selecting their check boxes. If you select specific event logs, all other event logs are excluded.
Use the Event Sources list to select event sources to include. You can select multiple event sources by selecting their check boxes. If you select specific event sources, all other event sources are excluded.
Optionally, use the User and Computer(s) boxes to specify users and computers that should be included. If you do not specify users and computers to include, events generated by all users and computers are included.
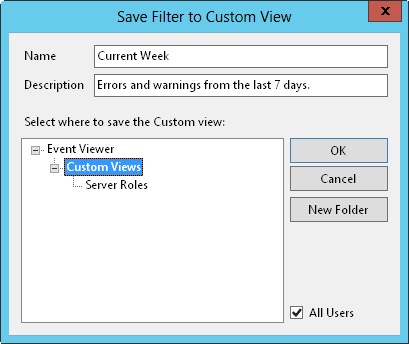
When you tap or click OK, Windows displays the Save Filter To Custom View dialog box, shown in Figure 4-16.
Type a name and description for the custom view.
Select where to save the custom view. By default, custom views are saved under the Custom Views node. You can create a new node by tapping or clicking New Folder, entering a name for the folder, and then tapping or clicking OK.
Tap or click OK to close the Save Filter To Custom View dialog box, which displays a filtered list of events. Review these events carefully, and take steps to correct any problems that exist.
If you want to review a particular type of event, you can filter the log in Computer Management by following these steps:
Expand Windows Logs or Applications And Services Logs as appropriate for the type of log you want to configure to display a list of event logs.
Press and hold or right-click the log you want to work with, and then tap or click Filter Current Log. This opens a dialog box similar to the one shown earlier in Figure 4-15.
Use the Logged list to select the time frame for logging events. You can choose to include events from the last hour, last 12 hours, last 24 hours, last 7 days, or last 30 days.
Use the Event Level check boxes to specify the level of events to include. Select Verbose to get additional details.
Use the Event Sources list to select event sources to include. If you select specific event sources, all other event sources are excluded.
Optionally, use the User and Computer(s) boxes to specify users and computers that should be included. If you do not specify users and computers, events generated by all users and computers are included.
Tap or click OK, which displays a filtered list of events. Review these events carefully, and take steps to correct any problems that exist. To clear the filter and display all events for the log, tap or click Clear Filter in the Actions pane or on the Action menu.
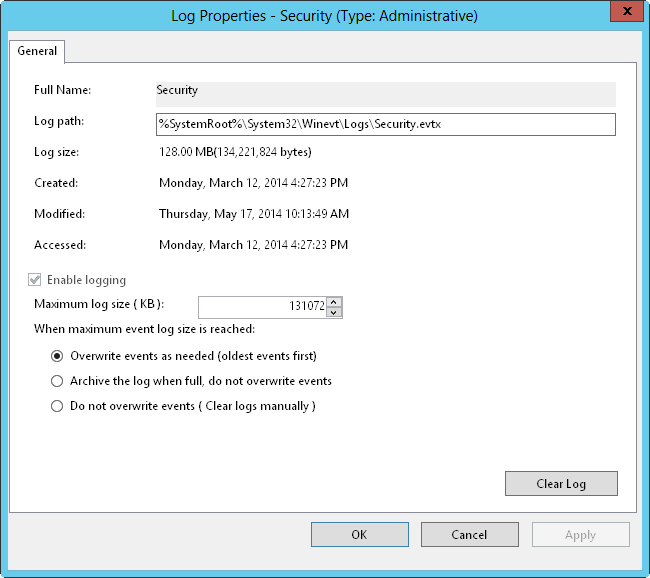
Setting event log options
Log options allow you to control the size of event logs and also how logging is handled. By default, event logs are set with a maximum file size. When a log reaches this limit, events are overwritten to prevent the log from exceeding the maximum file size.
To set log options in Computer Management, follow these steps:
Expand Windows Logs or Applications And Services Logs as appropriate for the type of log you want to configure. This displays a list of event logs.
Press and hold or right-click the event log whose properties you want to set, and then tap or click Properties on the shortcut menu. This opens the dialog box shown in Figure 4-17.
Type or set a maximum size in kilobytes (KB) in the Maximum Log Size box. Make sure that the drive containing the operating system has enough free space for the maximum log size you specify. Log files are stored in the %SystemRoot%System32WinevtLogs directory by default.
Select an event log–wrapping mode. The following options are available:
Overwrite Events As Needed (Oldest Events First). Events in the log are overwritten when the maximum file size is reached. Generally, this is the best option on a low-priority system.
Archive The Log When Full, Do Not Overwrite Events. When the maximum file size is reached, Windows archives the events by saving a copy of the current log in the default directory. Windows then creates a new log for storing current events.
Do Not Overwrite Events (Clear Logs Manually). When the maximum file size is reached, the system generates error messages telling you the event log is full.
Tap or click OK when you are finished.
Note
On critical systems where security and event logging is very important, you should use Archive The Log When Full, Do Not Overwrite Events. When you use this method, you ensure that event history is preserved in archives automatically. You might also want to consider a centralized logging solution.
Clearing event logs
When an event log is full, you need to clear it. To do that in Computer Management, follow these steps:
Expand Windows Logs or Applications And Services Logs as appropriate for the type of log you want to configure. This displays a list of event logs.
Press and hold or right-click the event log whose properties you want to set, and then tap or click Clear Log on the shortcut menu.
Click Save And Clear to save a copy of the log before clearing it. Click Clear to continue without saving the log file.
Archiving event logs
On key systems such as domain controllers and application servers, you’ll want to keep several months’ worth of logs. However, it usually isn’t practical to set the maximum log size to accommodate this. Instead, you should allow Windows to periodically archive the event logs, or you should manually archive the event logs.
Archive log file types
Logs can be archived as the following four types of files:
Event (.evtx) for access in Event Viewer
Tab-delimited text (.txt) for access in text editors or word processors or to import into spreadsheets and databases
Comma-delimited text (.csv) for importing into spreadsheets or databases
XML (.xml) for saving as an XML file
When you export log files to a comma-delimited file, a comma separates each column in the event entry. The event entries look like the following.
Information,07/21/14 3:43:24 PM,DNS Server,2,None,The DNS server has
started.
Error,07/21/14 3:40:04 PM,DNS Server,4015,None,The DNS server has
encountered a critical error from the Directory Service (DS). The data is
the error code.
The format for the entries is as follows.
Level,Date and Time,Source,Event ID,Task Category,Description
Creating log archives
Windows creates log archives automatically when you select the event log–wrapping mode named Archive The Log When Full, Do Not Overwrite Events. You can create a log archive manually in Computer Management by following these steps:
Expand Windows Logs or Applications And Services Logs as appropriate for the type of log you want to configure. This displays a list of event logs.
Press and hold or right-click the event log you want to archive, and then tap or click Save All Events As on the shortcut menu.
In the Save As dialog box, select a directory, and then enter a log file name.
In the Save As Type list, Event Files (*.evtx) is the default file type. Select the log file type you want to use, and then click Save. Note that you might not be able to use the .evtx file type to save events from a remote computer to a local folder. In this case, you need to save the events to the local computer with a different extension, such as .xml. Otherwise, save the events with the .evtx extension on the remote computer.
If you plan to view the log on other computers, you might need to include display information. To save display information, click Display Information For These Languages, choose the language in the list provided, and then tap or click OK. Otherwise, just tap or click OK to save the log without display information.
Note
If you plan to archive logs regularly, you might want to create an archive directory in which you can easily locate the log archives. You should also name the log file so that you can easily determine the log file type and the period of the archive. For example, if you’re archiving the system log file for January 2014, you might want to use the file name System Log January 2014.
Tip
The best file type to use for archiving is .evtx. Use this extension if you plan to review old logs in Event Viewer. However, if you plan to review logs in other applications, you might need to save the logs in a tab-delimited or comma-delimited format. With the tab-delimited or comma-delimited format, you sometimes need to edit the log file in a text editor for the log to be properly interpreted. If you saved the log with the .evtx extension, you can always save another copy in tab-delimited or comma-delimited format later by doing another Save As after opening the archive in Event Viewer.
Viewing log archives
You can view log archives in text format in any text editor or word processor. You should view log archives in the event log format in Event Viewer. You can view log archives in Event Viewer by following these steps:
In Computer Management, select and then press and hold or right-click the Event Viewer node. On the shortcut menu, click Open Saved Log.
In the Open Saved Log dialog box, select a directory and a log file name. By default, the Event Logs Files format is selected. This ensures that logs saved as .evtx, .evt, and .etl are listed. You can also filter the list by selecting a specific file type.
Tap or click Open. If you are prompted about converting the log to the new event log format, tap or click Yes.
Windows displays the Open Saved Log dialog box. Enter a name and description for the saved log.
Specify where to save the log. By default, saved logs are listed under Saved Logs. You can create a new node by tapping or clicking New Folder, entering a name for the folder, and then tapping or clicking OK.
Tap or click OK to close the Open Saved Log dialog box. This displays the contents of the saved log.