
Chapter 11. XML to SVG
You can find pictures anywhere. It’s simply a matter of noticing things and organizing them.
Elliott Erwitt
Introduction
Scalable Vector Graphics (SVG) is a vector graphics format encoded in XML that has the potential to revolutionize the way graphical content is delivered over the Internet. One of the most compelling reasons for encoding graphics as XML is that it allows graphical rendering of data to occur as a transformation. Hence, XSLT, which has no inherent graphics abilities, is capable of complex graphical results because it allows the SVG engine embedded in a browser to do most of the work.
Although this chapter assumes that the reader is already familiar with SVG, it reviews a few introductory techniques you will use often.
One of the first things you need to know about a graphics system is how its coordinate system is arranged. After years of algebra, trigonometry, and calculus, many technical readers find the Cartesian coordinate system the most natural. In this system, the x-coordinates increase in value from left to right, and the y-coordinates increase in value from the bottom of the graph to the top. Alas, SVG does not use a Cartesian system. Instead, it reverses the y-axis so that the coordinate 0,0 is in the upper-left corner and y-coordinates increase as you move downward. For many types of applications, the coordinate system is irrelevant. However, for situations involving the graphical display of data, the Cartesian system is better because it leads to display orientations that most people find intuitive. SVG has a powerful facility that lets you transform the coordinate system to the needs of your application. This is done via translations, rotations, and scaling of the coordinate system that can apply to individual lines and shapes or to graphical-element groupings. In particular, you can choose to work in a Cartesian coordinate system simply by specifying the following transformation:
<svg:g transform="translate(0,{$height}) scale(1,-1)">
     <!--All contents in cartesian coordinates -->
</svg:g>
Here, $height is the height of the entire SVG
graphic or the max y-coordinate in the group.
When plotting data in a graph, you can translate and scale the coordinate system to the range of the data so data values can be used as coordinate values:
<svg:g transform="scale(1,{$height div $max})">
     <!--All contents in cartesion coordinates -->
</svg:g>
In this example, you scale the y-coordinate based on
$height (the height of the SVG graphic) and
$max (the maximum data value that will be
plotted).
Converting to Cartesian coordinates and rescaling is convenient for plotting data, but it is problematic when you want to position text within the transformed coordinate system. The text is rendered upside down due to the Cartesian mapping and distorted due to the scaling. Hence, you must apply an offsetting transformation to the text:
<svg:text x="{$someXPos}"
          y="{$someYPos}"
          transform="translate({$someXPos},{$someYPos})
                     scale(1,{-$max div $height})
                     translate({-$someXPos},{-$someYPos})">
Some Text
</svg:text>
Such transformations make my head spin, but are sometimes the easiest way to achieve a desired result.
11.1. Transforming an Existing Boilerplate SVG
Solution
XSLT 1.0
Imagine that you need to display data in a bar graph. You can imagine creating an XSLT transformation that constructs the SVG representation of the bar graph from scratch (see Recipe 11.2). However, for those uncomfortable with graphical manipulation, this task may seem too daunting. In some cases, though, the data you need to plot is fixed in the number of data points. In this case, you can create the SVG graphic in a drawing program as a boilerplate template that will be instantiated with actual data using XSLT. Doing so greatly simplifies the task.
Consider the following bar-graph template:
<svg width="650" height="500">
     <g id="axis" transform="translate(0 500) scale(1 -1)">
          <line id="axis-y" x1="30" y1="20" x2="30" y2="450"
                style="fill:none;stroke:rgb(0,0,0);stroke-width:2"/>
          <line id="axis-x" x1="30" y1="20" x2="460" y2="20"
                style="fill:none;stroke:rgb(0,0,0);stroke-width:2"/>
     </g>
     <g id="bars" transform="translate(30 479) scale(1 -430)">
          <rect x="30" y="0" width="50" height="0.25"
                style="fill:rgb(255,0,0);stroke:rgb(0,0,0);stroke-width:0"/>
          <rect x="100" y="0" width="50" height="0.5"
                style="fill:rgb(0,255,0);stroke:rgb(0,0,0);stroke-width:0"/>
          <rect x="170" y="0" width="50" height="0.75"
                style="fill:rgb(255,255,0);stroke:rgb(0,0,0);stroke-width:0"/>
          <rect x="240" y="0" width="50" height="0.9"
                style="fill:rgb(0,255,255);stroke:rgb(0,0,0);stroke-width:0"/>
          <rect x="310" y="0" width="50" height="1"
                style="fill:rgb(0,0,255);stroke:rgb(0,0,0);stroke-width:0"/>
     </g>
     <g id="scale" transform="translate(29 60)">
          <text id="scale1" x="0px" y="320px"
                style="text-anchor:end;fill:rgb(0,0,0);font-size:10;font-family:
                Arial">0.25</text>
          <text id="scale2" x="0px" y="215px"
                style="text-anchor:end;fill:rgb(0,0,0);font-size:10;font-family:
                Arial">0.50</text>
          <text id="scale3" x="0px" y="107.5px"
                style="text-anchor:end;fill:rgb(0,0,0);font-size:10;font-family:
                Arial">0.75</text>
          <text id="scale4" x="0px" y="0px" style="text-anchor:end;fill:
                rgb(0,0,0);font-size:10;font-family:Arial">1.00</text>
     </g>
     <g id="key">
          <rect id="key1" x="430" y="80" width="25" height="15"
                style="fill:rgb(255,0,0);stroke:rgb(0,0,0);stroke-width:1"/>
          <rect id="key2" x="430" y="100" width="25" height="15"
                style="fill:rgb(0,255,0);stroke:rgb(0,0,0);stroke-width:1"/>
          <rect id="key3" x="430" y="120" width="25" height="15"
                style="fill:rgb(255,255,0);stroke:rgb(0,0,0);stroke-width:1"/>
          <rect id="key5" x="430" y="140" width="25" height="15"
                style="fill:rgb(0,255,255);stroke:rgb(0,0,0);stroke-width:1"/>
          <rect id="key4" x="430" y="160" width="25" height="15"
                style="fill:rgb(0,0,255);stroke:rgb(0,0,0);stroke-width:1"/>
          <text id="key1-text" x="465px" y="92px"
                style="fill:rgb(0,0,0);font-size:18;font-family:Arial">key1</text>
          <text id="key2-text" x="465px" y="112px"
                style="fill:rgb(0,0,0);font-size:18;font-family:Arial">key2</text>
          <text id="key3-text" x="465px" y="132px"
                style="fill:rgb(0,0,0);font-size:18;font-family:Arial">key3</text>
          <text id="key4-text" x="465px" y="152px"
                style="fill:rgb(0,0,0);font-size:18;font-family:Arial">key4</text>
          <text id="key5-text" x="465px" y="172px"
                style="fill:rgb(0,0,0);font-size:18;font-family:Arial">key5</text>
     </g>
     <g id="title">
          <text x="325px" y="20px" style="text-anchor:middle;fill:rgb(0,0,0);font-
size:24;font-family:Arial">Title</text>
     </g>
</svg>
When rendered, the template looks like Figure 11-1.

This SVG was created using the following guidelines:
First, you knew that you needed to plot five data values, so you
created five bars. You placed the bars in an SVG group with
id="bars“. You then did something very important:
you transformed the coordinate system of the bars so that the bar
height represents the value you want to plot. Specifically, you used
transform="translate(30
479)
scale(1 -430)“. translate moves
the origin of the bars to the origin of the axes.
transform flips and scales the y-axis so that the
height="1" creates a bar of the maximum height.
The negative value does the flipping, and 430 does the scaling (430
comes from the length of the y-axis). The
scale(1,-1) value within the
transform attribute is simply a placeholder that
works for the dummy data in the
SVG graph. Your stylesheet will replace it with an appropriate value
when processing the actual data.
Second, you created a dummy key within a SVG group with
id="key“. You made sure the elements in the key
were ordered to match the bar order. Your transformation will rely on
this ordering to fill in the graph correctly.
Third, you created four appropriately spaced text elements that
represent the scale on the y-axis within a group with
id="scale“. You gave each text node an ID with a
numeric suffix that represents the number of quarters its position
represents. For example, the text element 0.50 has
id="scale2" because it is at 2/4 (or 1/2) of the
scale. Your stylesheet will use the number when it remaps the scale
to values appropriate to the actual data.
Fourth, you created a dummy title text element, also within a group. This text is positioned and anchored to the center of the graphic. This means that it will remain centered when you replace its text with an actual title.
The fact that each major component of the SVG bar graph is in a group simplifies the stylesheet you create so it can load the graph with real data.
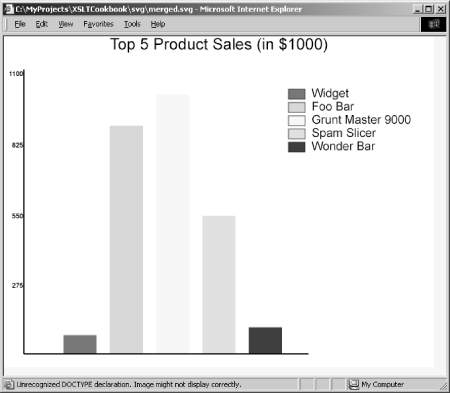
The data you load into the bar graph is sales data for your company’s five top-selling products:
<product-sales description="Top 5 Product Sales (in $1000)">
  <product name="Widget">
    <sales multiple="1000" currency="USD">70</sales>
  </product>
  <product name="Foo Bar">
    <sales multiple="1000" currency="USD">880</sales>
  </product>
  <product name="Grunt Master 9000">
    <sales multiple="1000" currency="USD">1000</sales>
  </product>
  <product name="Spam Slicer">
    <sales multiple="1000" currency="USD">532</sales>
  </product>
  <product name="Wonder Bar">
    <sales multiple="1000" currency="USD">100</sales>
  </product>
</product-sales>
The stylesheet merges boilerplate SVG with this data file to create a plot of the actual data:
<xsl:stylesheet version="1.0" xmlns:xsl="http://www.w3.org/1999/XSL/Transform"
  xmlns:math="http://www.exslt.org/math"
  exclude-result-prefixes="math">

<!-- By default, copy the SVG to the output -->
<xsl:import href="../util/copy.xslt"/>

<!-- We need max to find the maximum data value. -->
<!-- We use the max for scaling purposes -->
<xsl:include href="../math/math.max.xslt"/>

<!-- The data file names is passed as a parameter -->
<xsl:param name="data-file"/>

<!--We define the output type to be an SVG file and reference the SVG DTD -->
<xsl:output method="xml" version="1.0" encoding="UTF-8" indent="yes"
  doctype-public="-//W3C//DTD SVG 1.0/EN"
  doctype-system="http://www.w3.org/TR/2001/REC-SVG-20010904/DTD/svg10.dtd"/>

<!-- We load all the data values into a node set variable for -->
<!-- easy access -->
<xsl:variable name="bar-values" select="document($data-file)/*/*/sales"/>

<!-- We load all the data names of each bar into a node set variable for easy access
-->
<xsl:variable name="bar-names" select="document($data-file)/*/*/@name"/>

<!--We find the max data value -->
<xsl:variable name="max-data">
  <xsl:call-template name="math:max">
    <xsl:with-param name="nodes" select="$bar-values"/>
  </xsl:call-template>
</xsl:variable>

<!-- For purely aesthetic reasons, we scale the graph so the maximum value -->
<!-- that can be plotted is 10% greater than the true data maximum. -->
<xsl:variable name="max-bar" select="$max-data + $max-data div 10"/>

<!-- Since we gave each component of the graph a named group, -->
<!-- we can easily structure the stylesheet to match each -->
<!-- group and perform the appropriate transformation. -->

<!-- We copy the scale group and replace the text values with values -->
<!-- that reflect the range of our data. We use the numeric part -->
<!-- of each id to create the correct multiple of 0.25 -->

<xsl:template match="g[@id='scale']">
  <xsl:copy>
    <xsl:copy-of select="@*"/>
    <xsl:for-each select="text">
      <xsl:copy>
      <xsl:copy-of select="@*"/>
            <xsl:variable name="factor"
            select="substring-after(@id,'scale') * 0.25"/>
            <xsl:value-of select="$factor * $max-bar"/>
        </xsl:copy>
    </xsl:for-each>
  </xsl:copy>
</xsl:template>

<!--For the key component, we simply replace the text values -->
<xsl:template match="g[@id='key']">
  <xsl:copy>
    <xsl:copy-of select="@*"/>
    <xsl:apply-templates select="rect"/>
    <xsl:for-each select="text">
    <xsl:variable name="pos" select="position()"/>
    <xsl:copy>
      <xsl:copy-of select="@*"/>
      <xsl:value-of select="$bar-names[$pos]"/>
    </xsl:copy>
    </xsl:for-each>
  </xsl:copy>
</xsl:template>

<!--We replace the title with a description extracted from the data.  -->
<!--We might also have allowed the title to be passed in as a parameter-->
<xsl:template match="g[@id='title']">
  <xsl:copy>
    <xsl:copy-of select="@*"/>
    <xsl:for-each select="text">
      <xsl:copy>
        <xsl:copy-of select="@*"/>
        <xsl:value-of select="document($data-file)/*/@description"/>
      </xsl:copy>
    </xsl:for-each>
  </xsl:copy>
</xsl:template>

<!-- The bars are created by -->
<!-- 1) replacing the transform attribute with one that scales based
on the value of $max-bar -->
<!-- 2) Loads the data value into the height of the bar -->
<xsl:template match="g[@id='bars']">
<xsl:copy>
  <xsl:copy-of select="@id"/>
  <xsl:attribute name="transform">
    <xsl:value-of select="concat('translate(60 479) scale(1 ',
    -430 div $max-bar,')')"/>
  </xsl:attribute>
  <xsl:for-each select="rect">
    <xsl:variable name="pos" select="position()"/>
    <xsl:copy>
      <xsl:copy-of select="@*"/>
      <xsl:attribute name="height">
        <xsl:value-of select="$bar-values[$pos]"/>
      </xsl:attribute>
    </xsl:copy>
  </xsl:for-each>
 </xsl:copy>
</xsl:template>

</xsl:stylesheet>
When you apply this stylesheet to the template SVG, the result is the bar graph shown in Figure 11-2.
XSLT 2.0
Rather than repeat the entire solution for 2.0, I highlight the changes that are either required or desirable.
You can use the built-in XPath 2.0 max function
instead of the custom one we wrote in Chapter 3:
<xsl:variable name="bar-values" select="document($data-file)/*/*/sales"
              as="xs:double*"/>
<!--We find the max data value -->
<xsl:variable name="max-data" select="max($bar-values)"/>
You can’t play fast and loose with types in XSLT 2.0. You must use conversion functions from strings to numbers and visa versa:
<xsl:template match="g[@id='scale']">
  <xsl:copy>
    <xsl:copy-of select="@*"/>
    <xsl:for-each select="text">
      <xsl:copy>
      <xsl:copy-of select="@*"/>
            <xsl:variable name="factor"
            select="number(substring-after(@id,'scale')) * 0.25"/>
            <xsl:value-of select="$factor * $max-bar"/>
        </xsl:copy>
    </xsl:for-each>
  </xsl:copy>
</xsl:template>
You can also use the more concise form of
xsl:attribute. Note also the required numeric to
string conversion:
  <xsl:attribute name="transform" select="concat('translate(60 479) scale(1 ',
    string(-430 div $max-bar),')')"/>
Discussion
Creating SVG directly from data can involve a great deal of mathematical manipulation, trial and error, and frustration, especially if graphics manipulation is not your cup of tea. This recipe provides a way around the problem by using SVG that was laid out visually rather than programmatically. Furthermore, the transformation facilities of SVG were exploited to simplify data to graphical mapping.
Of course, this recipe has some obvious limitations.
First, you must know beforehand the number of data points you need to plot. A more general bar-graph builder would compute and distribute the bars automatically based on runtime inspection of the data. You can partially get around this problem by creating an SVG template with, say, ten bars, and remove the ones you don’t need at runtime. This workaround would detract from the presentation’s aesthetics because obvious gaps would emerge if only two data elements were mapped into a template originally laid out for ten.
Second, although you can create graphics that are more sophisticated than this simple example, the technique is limited to linear mappings of magnitude to graphical display. For example, it is not obvious that you could easily use this approach with a pie chart; changing the area of a pie slice is not simply a matter of adjusting the value of a single attribute.
A third limitation of this approach stems from the fact that the data source, SVG template, and stylesheet tend to be coupled. Thus, each time you use this technique, you create a new SVG template and stylesheet. Over time, this situation can result in more effort than if you simply built a more generic solution in the first place.
Despite its limitations, this example is valuable because it provides a good starting point for someone just learning to exploit SVG graphics. Specifically, it lets you rely on the facilities of the SVG editor for aligning, distributing, and proportioning the graphics.
11.2. Creating Reusable SVG Generation Utilities for Graphs and Charts
Problem
You want to create a library of SVG generators that can be mixed and matched in applications involving graphical presentation of data.
Solution
XSLT 1.0
If you plan to do a significant amount of SVG generation using XSLT, it is useful to develop a library of templates that generate graphical components that can be mixed and matched. This section shows several components that can graph data.
Axis generation
This example creates a general set of templates for generating graduated x- and y-axes:
<!-- Draw a graduated X-Axis -->
<xsl:template name="svgu:xAxis">
<xsl:param name="min"
select="0"/> <!-- Min x coordinate -->
<xsl:param name="max"
select="100"/> <!-- Max x coordinate -->
<xsl:param name="offsetX"
select="0"/> <!-- X offset of axis placement -->
<xsl:param name="offsetY"
select="0"/> <!-- Y offset of axis placement -->
<xsl:param name="width"
select="500"/> <!-- Width of the physical
plotting area -->
<xsl:param name="height"
select="500"/> <!-- Height of the physical plotting area -->
<xsl:param name="majorTicks"
select="10"/> <!-- Number of major axis divisions -->
<xsl:param name="majorBottomExtent"
select="4"/> <!-- Length of the major tick mark from
axis downward -->
<xsl:param name="majorTopExtent"
select="$majorBottomExtent"/> <!-- Length of the major tick
mark from axis upward -->
<xsl:param name="labelMajor"
select="true()"/> <!-- Label the major tick marks if
true -->
<xsl:param name="minorTicks"
select="4"/> <!-- Number of minor axis divisions per
major division-->
<xsl:param name="minorBottomExtent"
select="2"/> <!-- Length of the minor tick mark from
axis downward -->
<xsl:param name="minorTopExtent"
select="$minorBottomExtent"/> <!-- Length of the minor tick
mark from axis upward -->
<xsl:param name="context"/> <!-- A user defined context indicator for
formatting template calls. -->
<!-- Compute the range and scaling factors -->
<xsl:variable name="range" select="$max - $min"/>
<xsl:variable name="scale" select="$width div $range"/>
<!-- Establish a Cartesian coordinate system with correct offset -->
<!-- and scaling -->
<svg:g transform="translate({$offsetX},{$offsetY+$height})
scale({$scale},-1) translate({$min},0)">
<!-- Draw a line for the axis -->
<svg:line x1="{$min}" y1="0" x2="{$max}" y2="0">
<xsl:attribute name="style">
<!-- Call a template that can be overridden to -->
<!-- determine the axis style -->
<xsl:call-template name="xAxisStyle">
<xsl:with-param name="context" select="$context"/>
</xsl:call-template>
</xsl:attribute>
</svg:line>
<!-- Draw the tick marks and labels -->
<xsl:call-template name="svgu:ticks">
<xsl:with-param name="xMajor1" select="$min"/>
<xsl:with-param name="yMajor1" select="$majorTopExtent"/>
<xsl:with-param name="xMajor2" select="$min"/>
<xsl:with-param name="yMajor2" select="-$majorBottomExtent"/>
<xsl:with-param name="labelMajor" select="$labelMajor"/>
<xsl:with-param name="freq" select="$minorTicks"/>
<xsl:with-param name="xMinor1" select="$min"/>
<xsl:with-param name="yMinor1" select="$minorTopExtent"/>
<xsl:with-param name="xMinor2" select="$min"/>
<xsl:with-param name="yMinor2" select="-$minorBottomExtent"/>
<xsl:with-param name="nTicks"
select="$majorTicks * $minorTicks + 1"/>
<xsl:with-param name="xIncr"
select="($max - $min) div ($majorTicks * $minorTicks)"/>
<xsl:with-param name="scale" select="1 div $scale"/>
</xsl:call-template>
</svg:g>
</xsl:template>
<xsl:template name="svgu:yAxis">
<xsl:param name="min"
select="0"/> <!-- Min x coordinate -->
<xsl:param name="max"
select="100"/> <!-- Max x coordinate -->
<xsl:param name="offsetX"
select="0"/> <!-- X offset of axis placement -->
<xsl:param name="offsetY"
select="0"/> <!-- Y offset of axis placement -->
<xsl:param name="width"
select="500"/> <!-- Width of the physical
plotting area -->
<xsl:param name="height"
select="500"/> <!-- Height of the physical plotting area -->
<xsl:param name="majorTicks"
select="10"/> <!-- Number of major axis divisions -->
<xsl:param name="majorLeftExtent"
select="4"/> <!-- Length of the major tick mark from
axis downward -->
<xsl:param name="majorRightExtent"
select="$majorBottomExtent"/> <!-- Length of the major tick
mark from axis upward -->
<xsl:param name="labelMajor"
select="true()"/> <!-- Label the major tick marks if
true -->
<xsl:param name="minorTicks"
select="4"/> <!-- Number of minor axis divisions per
major division-->
<xsl:param name="minorLeftExtent"
select="2"/> <!-- Length of the minor tick mark from
axis right -->
<xsl:param name="minorRightExtent"
select="$minorBottomExtent"/> <!-- Length of the minor tick
mark from axis left -->
<xsl:param name="context"/> <!-- A user-defined context indicator for
formatting template calls -->
<xsl:param name="majorLeftExtent"
select="4"/>
<xsl:param name="majorRightExtent"
select="$majorLeftExtent"/>
<xsl:param name="minorLeftExtent"
select="2"/>
<xsl:param name="minorRightExtent"
select="$minorLeftExtent"/>
<!-- Compute the range and scaling factors -->
<xsl:variable name="range" select="$max - $min"/>
<xsl:variable name="scale" select="$height div $range"/>
<!-- Establish a Cartesian coordinate system with correct offset -->
<!-- and scaling -->
<svg:g transform="translate({$offsetX},{$offsetY+$height})
scale(1,{-$scale}) translate(0,{-$min})">
<svg:line x1="0" y1="{$min}" x2="0" y2="{$max}">
<xsl:attribute name="style">
<xsl:call-template name="yAxisStyle">
<xsl:with-param name="context" select="$context"/>
</xsl:call-template>
</xsl:attribute>
</svg:line>
<xsl:call-template name="svgu:ticks">
<xsl:with-param name="xMajor1" select="-$majorLeftExtent"/>
<xsl:with-param name="yMajor1" select="$min"/>
<xsl:with-param name="xMajor2" select="$majorRightExtent"/>
<xsl:with-param name="yMajor2" select="$min"/>
<xsl:with-param name="labelMajor" select="$labelMajor"/>
<xsl:with-param name="freq" select="$minorTicks"/>
<xsl:with-param name="xMinor1" select="-$minorLeftExtent"/>
<xsl:with-param name="yMinor1" select="$min"/>
<xsl:with-param name="xMinor2" select="$minorRightExtent"/>
<xsl:with-param name="yMinor2" select="$min"/>
<xsl:with-param name="nTicks"
select="$majorTicks * $minorTicks + 1"/>
<xsl:with-param name="yIncr"
select="($max - $min) div ($majorTicks * $minorTicks)"/>
<xsl:with-param name="scale" select="1 div $scale"/>
</xsl:call-template>
</svg:g>
</xsl:template>
<!--Recursive utility for drawing tick marks and labels -->
<xsl:template name="svgu:ticks">
<xsl:param name="xMajor1" />
<xsl:param name="yMajor1" />
<xsl:param name="xMajor2" />
<xsl:param name="yMajor2" />
<xsl:param name="labelMajor"/>
<xsl:param name="freq" />
<xsl:param name="xMinor1" />
<xsl:param name="yMinor1" />
<xsl:param name="xMinor2" />
<xsl:param name="yMinor2" />
<xsl:param name="nTicks" select="0"/>
<xsl:param name="xIncr" select="0"/>
<xsl:param name="yIncr" select="0"/>
<xsl:param name="i" select="0"/>
<xsl:param name="scale"/>
<xsl:param name="context"/>
<xsl:if test="$i < $nTicks">
<xsl:choose>
<!-- Time to draw a major tick -->
<xsl:when test="$i mod $freq = 0">
<svg:line x1="{$xMajor1}" y1="{$yMajor1}"
x2="{$xMajor2}" y2="{$yMajor2}">
</svg:line>
<xsl:if test="$labelMajor">
<xsl:choose>This part of the code renders the tick marks along the x- and y-axes. This example hardcodes the format string to avoid yet another parameter, but you might consider using a parameter or passing the value to another template for formatting:
              <!-- Ticking along x-axis -->
               <xsl:when test="$xIncr > 0">
                 <!-- Tick label must compensate for distorted coordinate
                      system -->
                 <svg:text x="{$xMajor1}" y="{$yMajor2}"
                       transform="translate({$xMajor1},{$yMajor2})
                                  scale({$scale},-1)
                                  translate({-$xMajor1},{-$yMajor2})">
                          <xsl:attribute name="style">
                            <xsl:call-template name="xAxisLabelStyle">
                              <xsl:with-param name="context"
                                              select="$context"/>
                            </xsl:call-template>
                          </xsl:attribute>
                   <!-- Perhaps label format should be parameter -->
                   <xsl:value-of select="format-number($xMajor1,'#0.0')"/>
                 </svg:text>
               </xsl:when>
              <!-- Ticking along y-axis -->
               <xsl:otherwise>
                 <svg:text x="{$xMajor1}" y="{$yMajor1}"
                          transform="translate({$xMajor1},{$yMajor1})
                          scale(1,{-$scale})
                          translate({-$xMajor1},{-$yMajor1})">
                   <xsl:attribute name="style">
                     <xsl:call-template name="yAxisLabelStyle">
                       <xsl:with-param name="context" select="$context"/>
                     </xsl:call-template>
                   </xsl:attribute>
                   <xsl:value-of select="format-number($yMajor1,'#0.0')"/>
                 </svg:text>
               </xsl:otherwise>
             </xsl:choose>
           </xsl:if>
         </xsl:when>
          <!-- Time to draw a minor tick -->
         <xsl:otherwise>
           <svg:line x1="{$xMinor1}" y1="{$yMinor1}"
                 x2="{$xMinor2}" y2="{$yMinor2}">
           </svg:line>
         </xsl:otherwise>
       </xsl:choose>

        <!-- Recursive call for next tick -->
       <xsl:call-template name="svgu:ticks">
         <xsl:with-param name="xMajor1" select="$xMajor1 + $xIncr"/>
         <xsl:with-param name="yMajor1" select="$yMajor1 + $yIncr"/>
         <xsl:with-param name="xMajor2" select="$xMajor2 + $xIncr"/>
         <xsl:with-param name="yMajor2" select="$yMajor2 + $yIncr"/>
         <xsl:with-param name="labelMajor" select="$labelMajor"/>
         <xsl:with-param name="freq" select="$freq"/>
         <xsl:with-param name="xMinor1" select="$xMinor1 + $xIncr"/>
         <xsl:with-param name="yMinor1" select="$yMinor1 + $yIncr"/>
         <xsl:with-param name="xMinor2" select="$xMinor2 + $xIncr"/>
         <xsl:with-param name="yMinor2" select="$yMinor2 + $yIncr"/>
         <xsl:with-param name="nTicks" select="$nTicks"/>
         <xsl:with-param name="xIncr" select="$xIncr"/>
         <xsl:with-param name="yIncr" select="$yIncr"/>
         <xsl:with-param name="i" select="$i + 1"/>
         <xsl:with-param name="scale" select="$scale"/>
         <xsl:with-param name="context" select="$context"/>
       </xsl:call-template>
     </xsl:if>

   </xsl:template>

   <!-- Override this template to change x-axis style -->
   <xsl:template name="xAxisStyle">
     <xsl:param name="context"/>
      <xsl:text>stroke-width:0.5;stroke:black</xsl:text>
   </xsl:template>

   <!-- Override this template to change y-axis style -->
   <xsl:template name="yAxisStyle">
     <xsl:param name="context"/>
      <xsl:text>stroke-width:0.5;stroke:black</xsl:text>
   </xsl:template>

   <!-- Override this template to change x-axis label style -->
   <xsl:template name="xAxisLabelStyle">
     <xsl:param name="context"/>
     <xsl:text>text-anchor:middle; font-size:8;
               baseline-shift:-110%</xsl:text>
   </xsl:template>

   <!-- Override this template to change y-axis label style -->
   <xsl:template name="yAxisLabelStyle">
     <xsl:param name="context"/>
     <xsl:text>text-anchor:end;font-size:8;baseline-shift:-50%</xsl:text>
   </xsl:template>
This XSLT script produces x- and y-axes with major and minor tick marks and labels:
<xsl:stylesheet version="1.0"
  xmlns:xsl="http://www.w3.org/1999/XSL/Transform"
  xmlns:svg="http://www.w3.org/2000/svg"
  xmlns:svgu="http://www.ora.com/XSLTCookbook/ns/svg-utils"
  xmlns:test="http://www.ora.com/XSLTCookbook/ns/test"
  exclude-result-prefixes="svgu test">

  <xsl:import href="svg-utils.xslt"/>

  <xsl:output method="xml" version="1.0" encoding="UTF-8" indent="yes"
    doctype-public="-//W3C//DTD SVG 1.0/EN"
    doctype-system="http://www.w3.org/TR/2001/REC-SVG-20010904/DTD/svg10.dtd"/>

  <xsl:variable name="width" select="300"/>
  <xsl:variable name="height" select="300"/>
  <xsl:variable name="pwidth" select="$width * 0.8"/>
  <xsl:variable name="pheight" select="$height * 0.8"/>
  <xsl:variable name="offsetX" select="($width - $pwidth) div 2"/>
  <xsl:variable name="offsetY" select="($height - $pheight) div 2"/>

  <xsl:template match="/">


    <svg:svg width="{$width}" height="{$height}">

      <xsl:call-template name="svgu:xAxis">
        <xsl:with-param name="min" select="0"/>
        <xsl:with-param name="max" select="10"/>
        <xsl:with-param name="offsetX" select="$offsetX"/>
        <xsl:with-param name="offsetY" select="$offsetY"/>
        <xsl:with-param name="width" select="$pwidth"/>
        <xsl:with-param name="height" select="$pheight"/>
      </xsl:call-template>

      <xsl:call-template name="svgu:yAxis">
        <xsl:with-param name="min" select="0"/>
        <xsl:with-param name="max" select="10"/>
        <xsl:with-param name="offsetX" select="$offsetX"/>
        <xsl:with-param name="offsetY" select="$offsetY"/>
        <xsl:with-param name="width" select="$pwidth"/>
        <xsl:with-param name="height" select="$pheight"/>
      </xsl:call-template>

    </svg:svg>

  </xsl:template>

</xsl:stylesheet>
This template gives the axes shown in Figure 11-3.

By extending the major ticks across the full width and height, you can create a grid, shown in Figure 11-4:
      <xsl:call-template name="svgu:xAxis">
        <xsl:with-param name="min" select="0"/>
        <xsl:with-param name="max" select="10"/>
        <xsl:with-param name="offsetX" select="$offsetX"/>
        <xsl:with-param name="offsetY" select="$offsetY"/>
        <xsl:with-param name="width" select="$pwidth"/>
        <xsl:with-param name="height" select="$pheight"/>
        <xsl:with-param name="majorTopExtent" select="$pheight"/>
      </xsl:call-template>

      <xsl:call-template name="svgu:yAxis">
        <xsl:with-param name="min" select="0"/>
        <xsl:with-param name="max" select="10"/>
        <xsl:with-param name="offsetX" select="$offsetX"/>
        <xsl:with-param name="offsetY" select="$offsetY"/>
        <xsl:with-param name="width" select="$pwidth"/>
        <xsl:with-param name="height" select="$pheight"/>
        <xsl:with-param name="majorRightExtent" select="$pwidth"/>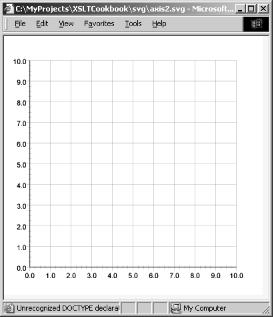
</xsl:call-template>
By also extending the minor ticks across the full width and height, you can create a finer grid, shown in Figure 11-5.
      <xsl:call-template name="svgu:xAxis">
        <xsl:with-param name="min" select="0"/>
        <xsl:with-param name="max" select="10"/>
        <xsl:with-param name="offsetX" select="$offsetX"/>
        <xsl:with-param name="offsetY" select="$offsetY"/>
        <xsl:with-param name="width" select="$pwidth"/>
        <xsl:with-param name="height" select="$pheight"/>
        <xsl:with-param name="majorTopExtent" select="$pheight"/>
        <xsl:with-param name="minorTopExtent" select="$pheight"/>
      </xsl:call-template>

      <xsl:call-template name="svgu:yAxis">
        <xsl:with-param name="min" select="0"/>
        <xsl:with-param name="max" select="10"/>
        <xsl:with-param name="offsetX" select="$offsetX"/>
        <xsl:with-param name="offsetY" select="$offsetY"/>
        <xsl:with-param name="width" select="$pwidth"/>
        <xsl:with-param name="height" select="$pheight"/>
        <xsl:with-param name="majorRightExtent" select="$pwidth"/>
        <xsl:with-param name="minorRightExtent" select="$pwidth"/>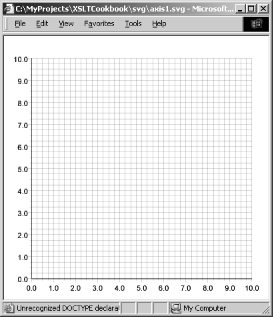
</xsl:call-template>
You can create a four-quadrant plot, shown in Figure 11-6, by shifting the axis and adjusting the extents for the grid:
      <xsl:call-template name="svgu:xAxis">
        <xsl:with-param name="min" select="-5"/>
        <xsl:with-param name="max" select="5"/>
        <xsl:with-param name="offsetX" select="0"/>
                  <xsl:with-param name="offsetY" select="-$pheight div 2"/>
        <xsl:with-param name="width" select="$pwidth"/>
        <xsl:with-param name="height" select="$pheight"/>
        <xsl:with-param name="majorTopExtent" select="$pwidth div 2"/>
                  <xsl:with-param name="majorBottomExtent" select="$pwidth div 2"/>
      </xsl:call-template>

      <xsl:call-template name="svgu:yAxis">
        <xsl:with-param name="min" select="-5"/>
        <xsl:with-param name="max" select="5"/>
        <xsl:with-param name="offsetX" select="-$pwidth div 2"/>
                  <xsl:with-param name="offsetY" select="0"/>
        <xsl:with-param name="width" select="$pwidth"/>
        <xsl:with-param name="height" select="$pheight"/>
        <xsl:with-param name="majorRightExtent" select="$pwidth div 2"/>
                  <xsl:with-param name="majorLeftExtent" select="$pwidth div 2"/>
</xsl:call-template>
By default, this code will align the labels to the ends of the grid lines; however, you can force the labels back to the axes by overriding two templates, producing the results shown in Figure 11-7.

   <xsl:template name="xAxisLabelYOffset">
     <xsl:value-of select="-$pheight div 2"/>
   </xsl:template>

   <xsl:template name="yAxisLabelXOffset">
     <xsl:value-of select="$pwidth div 2"/>
   </xsl:template>
Bar generation
Another common way to plot data is in a bar chart. Bar charts are useful for comparisons. Create a utility that produces a bar for each data value passed to it. The width and color of the bars can be customized easily. The next example allows the bars to be oriented in various directions by using a rotation transformation on the coordinate system. Although this feature is useful, you have to compensate for how rotation affects text and the apparent order of the data values:
 <xsl:template name="svgu:bars">
  <xsl:param name="data" select="/.."/>  <!-- data to chart -->
  <xsl:param name="width" select="500"/>
  <xsl:param name="height" select="500"/>
  <xsl:param name="orientation" select="0"/>
  <xsl:param name="barWidth" select="5"/>
  <xsl:param name="offsetX" select="0"/>
  <xsl:param name="offsetY" select="0"/>
  <xsl:param name="boundingBox" select="false()"/>
  <xsl:param name="barLabel" select="false()"/>
  <xsl:param name="max">
   <xsl:call-template name="emath:max">
     <xsl:with-param name="nodes" select="$data"/>
   </xsl:call-template>
  </xsl:param>
  <xsl:param name="context"/>

 <xsl:variable name="numBars" select="count($data)"/>
  <xsl:variable name="spacing" select="$width div ($numBars + 1)"/>

 <xsl:if test="$boundingBox">
  <svg:g transform="translate({$offsetX},{$offsetY})
                translate({$width div 2},{$height div 2})
                rotate({$orientation - 180})
                translate({-$width div 2},{-$height div 2})">
     <svg:rect x="0" y="0"
      height="{$height}" width="{$width}"
      style="stroke: black;
             stroke-width:0.5;stroke-opacity:0.5;fill:none"/>
   </svg:g>
 </xsl:if>
 <!-- We change the data order to compensate for rotation -->
 <!-- See sort below -->
  <xsl:variable name="data-order">
    <xsl:choose>
      <xsl:when test="$orientation mod 360 >= 180">ascending</xsl:when>
      <xsl:otherwise>descending</xsl:otherwise>
    </xsl:choose>
  </xsl:variable>

  <svg:g transform="translate({$offsetX},{$offsetY})
                translate({$width div 2},{$height div 2})
                rotate({$orientation - 180})
                translate({-$width div 2},{-$height div 2})
                scale(1,{$height div $max})">

    <xsl:for-each select="$data">
      <!-- We use a sort on position to traverse the data in reverse -->
      <!-- when necessary. -->
      <xsl:sort select="position()" data-type="number"
           order="{$data-order}"/>

      <xsl:variable name="pos" select="position()"/>
This example uses lines for the bars. Color and stroke width can be
altered by overriding the
BarStyle template. You might consider using
rectangles, which give you the option of altering the border style:
<svg:line x1="{$spacing * $pos}"
y1="0"
x2="{$spacing * $pos}"
y2="{current()}" id="{$context}_bar_{$pos}">
<xsl:attribute name="style">
<xsl:value-of select="concat('stroke-width: ',$barWidth,'; ')"/>
<xsl:call-template name="svgu:barStyle">
<xsl:with-param name="pos" select="$pos"/>
<xsl:with-param name="context" select="$context"/>
</xsl:call-template>
</xsl:attribute>
</svg:line>
<!-- If user requests bar labels we position a text value -->
<!-- of the data point above the bar. The complex series of -->
<!-- transformations is used to make the text display correctly -->
<!-- despite the rotations and scalings to the coordinate system -->
<xsl:if test="$barLabel">
<svg:text x="{$spacing * $pos}"
y="{current() * ($height div $max)}"
transform="scale(1,{$max div $height})
translate(0,10)
translate({$spacing * $pos},{current() *
($height div $max)})
rotate({180 - $orientation})
translate({-$spacing * $pos},
{-current() * ($height div $max)})"
id="{$context}_barLabel_{$pos}">
<xsl:attribute name="style">
<xsl:call-template name="svgu:barLabelStyle">
<xsl:with-param name="pos" select="$pos"/>
<xsl:with-param name="context" select="$context"/>
</xsl:call-template>
</xsl:attribute>
<xsl:value-of select="."/>
</svg:text>
</xsl:if>
</xsl:for-each>
</svg:g>
</xsl:template>
<xsl:template name="svgu:barStyle">
<xsl:param name="pos"/>
<xsl:param name="context"/>
<xsl:variable name="colors" select="document('')/*/svgu:color"/>
<xsl:value-of
select="concat('stroke: ',$colors[($pos - 1 ) mod count($colors)
+ 1])"/>
</xsl:template>
<xsl:template name="svgu:barLabelStyle">
<xsl:param name="pos"/>
<xsl:param name="context"/>
<xsl:value-of select=" 'text-anchor: middle' "/>
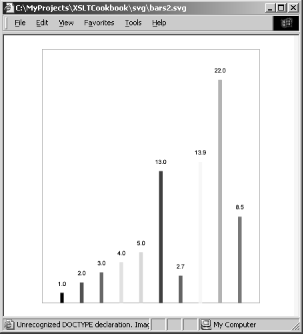
</xsl:template>The following stylesheet plots data by using bars. The results are shown in Figure 11-8.
<xsl:stylesheet version="1.0"
  xmlns:xsl="http://www.w3.org/1999/XSL/Transform"
  xmlns:svg="http://www.w3.org/2000/svg"
  xmlns:svgu="http://www.ora.com/XSLTCookbook/ns/svg-utils"
  xmlns:test="http://www.ora.com/XSLTCookbook/ns/test"
  exclude-result-prefixes="svgu">

<xsl:import href="svg-utils.xslt"/>

<xsl:output method="xml" version="1.0" encoding="UTF-8" indent="yes"
  doctype-public="-//W3C//DTD SVG 1.0/EN"
  doctype-system="http://www.w3.org/TR/2001/REC-SVG-20010904/DTD/svg10.dtd"/>

<test:data>1.0</test:data>
<test:data>2.0</test:data>
<test:data>3.0</test:data>
<test:data>4.0</test:data>
<test:data>5.0</test:data>
<test:data>13.0</test:data>
<test:data>2.7</test:data>
<test:data>13.9</test:data>
<test:data>22.0</test:data>
<test:data>8.5</test:data>

<xsl:template match="/">

<svg:svg width="400" height="400">

  <xsl:call-template name="svgu:bars">
    <xsl:with-param name="data" select="document('')/*/test:data"/>
    <xsl:with-param name="width" select=" '300' "/>
    <xsl:with-param name="height" select=" '350' "/>
    <xsl:with-param name="orientation" select=" '0' "/>
    <xsl:with-param name="offsetX" select=" '50' "/>
    <xsl:with-param name="offsetY" select=" '25' "/>
    <xsl:with-param name="boundingBox" select="1"/>
    <xsl:with-param name="barLabel" select="1"/>
    <xsl:with-param name="max" select="25"/>
  </xsl:call-template>

</svg:svg>

</xsl:template>

 <xsl:template name="svgu:barLabelStyle">
   <xsl:param name="pos"/>
   <xsl:param name="context"/>
   <xsl:text>text-anchor: middle; font-size: 8</xsl:text>
 </xsl:template>

</xsl:stylesheet>
This variation rotates the display to create a horizontal bar chart, as shown in Figure 11-9. The code does not attempt to constrain the angle of orientation, even though only multiples of 90 degrees are likely values.[1]
  <xsl:call-template name="svgu:bars">
    <xsl:with-param name="data" select="document('')/*/test:data"/>
    <xsl:with-param name="width" select=" '300' "/>
    <xsl:with-param name="height" select=" '350' "/>
    <xsl:with-param name="orientation" select=" '90' "/>
    <xsl:with-param name="offsetX" select=" '50' "/>
    <xsl:with-param name="offsetY" select=" '25' "/>
    <xsl:with-param name="boundingBox" select="1"/>
    <xsl:with-param name="barLabel" select="1"/>
    <xsl:with-param name="max" select="25"/>
  </xsl:call-template>
XY plots
Axes and grids are useless unless you can actually plot some data in them. One common way to plot data is with an XY plot in which one value is shown as a function of another. You can create a utility that handles one set of data points at a time and use it several times to plot different data sets on the same graph:
  <xsl:template name="svgu:xyPlot">
    <xsl:param name="dataX" select="/.."/> <!-- x values -->
    <xsl:param name="dataY" select="/.."/>
    <xsl:param name="offsetX" select="0"/>
    <xsl:param name="offsetY" select="0"/>
    <xsl:param name="width" select="500"/>
    <xsl:param name="height" select="500"/>
    <xsl:param name="boundingBox" select="false()"/>
    <xsl:param name="context"/>
    <xsl:param name="maxX">
     <xsl:call-template name="emath:max">
       <xsl:with-param name="nodes" select="$dataX"/>
     </xsl:call-template>
    </xsl:param>
    <xsl:param name="maxY">
     <xsl:call-template name="emath:max">
       <xsl:with-param name="nodes" select="$dataY"/>
     </xsl:call-template>
    </xsl:param>

    <xsl:variable name="scaleX" select="$width div $maxX"/>
    <xsl:variable name="scaleY" select="$height div $maxY"/>
This section uses a Java extension function for simplicity, but you
could also implement max in XPath by using select="($scaleX
> $scaleY) * $scaleX + not($scaleX
>
$scaleY) * $scaleY)“:
    <xsl:variable name="scale" select="Math:max($scaleX,$scaleY)"/>

    <xsl:if test="$boundingBox">
      <svg:g transform="translate({$offsetX},{$offsetY})">
       <svg:rect x="0" y="0" height="{$height}" width="{$width}"
                 style="stroke: black;stroke-width:0.5;
                        stroke-opacity:0.5;fill:none"/>
     </svg:g>
    </xsl:if>
I draw the curve using simple line segments, but a Bézier curve command could result in a smoother effect at the expense of greater code complexity. Since this book covers XSLT rather than SVG, you’ll have to settle for simplicity. The trick to using cubic Bézier curves might be to plot three points at a time using the center point as the control point, but I have not tested this idea:
    <svg:path transform="translate({$offsetX},{$height + $offsetY})
                                scale({$scaleX},{-$scaleY})">
      <xsl:attribute name="d">
        <xsl:for-each select="$dataX">
          <xsl:variable name="pos" select="position()"/>
          <xsl:variable name="x" select="current() "/>
          <xsl:variable name="y" select="$dataY[$pos]"/>
          <xsl:choose>
            <xsl:when test="$pos = 1">
              <xsl:text>M </xsl:text>
            </xsl:when>
            <xsl:otherwise> L </xsl:otherwise>
          </xsl:choose>
          <xsl:value-of select="$x"/>,<xsl:value-of select="$y"/>
        </xsl:for-each>
        </xsl:attribute>
        <xsl:attribute name="style">
          <xsl:call-template name="svgu:xyPlotStyle">
            <xsl:with-param name="scale" select="$scale"/>
            <xsl:with-param name="context" select="$context"/>
          </xsl:call-template>
        </xsl:attribute>
    </svg:path>
  </xsl:template>

   <xsl:template name="svgu:xyPlotStyle">
     <xsl:param name="context"/>
     <xsl:param name="scale"/>
     <xsl:value-of select="concat('fill: none; stroke: black; stroke-width:',1 div
         $scale,'; ')"/>
   </xsl:template>
This XSLT script exercises the XY plot template, producing the results shown in Figure 11-10. For simplicity, I embed the data within the actual stylesheet. In practice, you would extract the data from another XML document:

<xsl:stylesheet version="1.0"
  xmlns:xsl="http://www.w3.org/1999/XSL/Transform"
  xmlns:svg="http://www.w3.org/2000/svg"
  xmlns:svgu="http://www.ora.com/XSLTCookbook/ns/svg-utils"
  xmlns:test="http://www.ora.com/XSLTCookbook/ns/test"
  exclude-result-prefixes="svgu test">

<xsl:import href="svg-utils.xslt"/>

<xsl:output method="xml" version="1.0" encoding="UTF-8" indent="yes"
  doctype-public="-//W3C//DTD SVG 1.0/EN"
  doctype-system="http://www.w3.org/TR/2001/REC-SVG-20010904/DTD/svg10.dtd"/>

<test:xdata>0</test:xdata>
<test:xdata>5</test:xdata>
<test:xdata>10</test:xdata>
<test:xdata>15</test:xdata>
<test:xdata>20</test:xdata>
<test:xdata>25</test:xdata>
<test:xdata>30</test:xdata>
<!-- Rest of x data elided ... -->

<test:ydata>0</test:ydata>
<test:ydata>0.087155743</test:ydata>
<test:ydata>0.173648178</test:ydata>
<test:ydata>0.258819045</test:ydata>
<test:ydata>0.342020143</test:ydata>
<test:ydata>0.422618262</test:ydata>
<test:ydata>0.5</test:ydata>
<!-- Rest of y data elided ... -->

<xsl:variable name="w" select="400"/>
<xsl:variable name="h" select="300"/>
<xsl:variable name="pwidth" select="$w * 0.8"/>
<xsl:variable name="pheight" select="$h * 0.8"/>
<xsl:variable name="offsetX" select="($w - $pwidth) div 2"/>
<xsl:variable name="offsetY" select="($h - $pheight) div 2"/>

<xsl:template match="/">

<svg:svg width="{$w}" height="{$h}">

  <xsl:call-template name="svgu:xyPlot">
    <xsl:with-param name="dataX" select="document('')/*/test:xdata"/>
    <xsl:with-param name="dataY" select="document('')/*/test:ydata"/>
    <xsl:with-param name="offsetX" select="$offsetX"/>
    <xsl:with-param name="offsetY" select="$offsetY"/>
    <xsl:with-param name="width" select="$pwidth"/>
    <xsl:with-param name="height" select="$pheight"/>
    <!--
    <xsl:with-param name="minY" select="-1"/>
    <xsl:with-param name="maxY" select="1"/>
    -->
  </xsl:call-template>

  <xsl:call-template name="svgu:xAxis">
    <xsl:with-param name="min" select="0"/>
    <xsl:with-param name="max" select="360"/>
    <xsl:with-param name="offsetX" select="$offsetX"/>
    <xsl:with-param name="offsetY" select="-$pheight div 2 + $offsetY"/>
    <xsl:with-param name="width" select="$pwidth"/>
    <xsl:with-param name="height" select="$pheight"/>
    <xsl:with-param name="majorTicks" select="6"/>
      <!-- Number of major axis divisions -->
    <xsl:with-param name="minorTicks" select="4"/>
      <!-- Number of major axis divisions -->
  </xsl:call-template>

  <xsl:call-template name="svgu:yAxis">
    <xsl:with-param name="min" select="-1"/>
    <xsl:with-param name="max" select="1"/>
    <xsl:with-param name="offsetX" select="$offsetX"/>
    <xsl:with-param name="offsetY" select="$offsetY"/>
    <xsl:with-param name="width" select="$pwidth"/>
    <xsl:with-param name="height" select="$pheight"/>
  </xsl:call-template>

</svg:svg>

</xsl:template>

</xsl:stylesheet>
The following code, whose results are shown in Figure 11-11, demonstrates how to plot multiple data sets and customize the line style by overriding a template:
<xsl:stylesheet version="1.0"
  xmlns:xsl="http://www.w3.org/1999/XSL/Transform"
  xmlns:svg="http://www.w3.org/2000/svg"
  xmlns:svgu="http://www.ora.com/XSLTCookbook/ns/svg-utils"
  xmlns:test="http://www.ora.com/XSLTCookbook/ns/test"
  exclude-result-prefixes="svgu test">

<xsl:import href="svg-utils.xslt"/>

<xsl:output method="xml" version="1.0" encoding="UTF-8" indent="yes"
  doctype-public="-//W3C//DTD SVG 1.0/EN"
  doctype-system="http://www.w3.org/TR/2001/REC-SVG-20010904/DTD/svg10.dtd"/>

<!-- Data values elided ... -->

<xsl:variable name="w" select="400"/>
<xsl:variable name="h" select="300"/>
<xsl:variable name="pwidth" select="$w * 0.8"/>
<xsl:variable name="pheight" select="$h * 0.8"/>
<xsl:variable name="offsetX" select="($w - $pwidth) div 2"/>
<xsl:variable name="offsetY" select="($h - $pheight) div 2"/>

<xsl:template match="/">

<svg:svg width="{$w}" height="{$h}">

  <xsl:call-template name="svgu:xyPlot">
    <xsl:with-param name="dataX" select="document('')/*/test:xdata"/>
    <xsl:with-param name="dataY" select="document('')/*/test:ydata"/>
    <xsl:with-param name="offsetX" select="$offsetX"/>
    <xsl:with-param name="offsetY" select="$offsetY"/>
    <xsl:with-param name="width" select="$pwidth"/>
    <xsl:with-param name="height" select="$pheight"/>
    <xsl:with-param name="maxY" select="40"/>
  </xsl:call-template>

  <xsl:call-template name="svgu:xyPlot">
    <xsl:with-param name="dataX" select="document('')/*/test:xdata"/>
    <xsl:with-param name="dataY" select="document('')/*/test:y2data"/>
    <xsl:with-param name="offsetX" select="$offsetX"/>
    <xsl:with-param name="offsetY" select="$offsetY"/>
    <xsl:with-param name="width" select="$pwidth"/>
    <xsl:with-param name="height" select="$pheight"/>
    <xsl:with-param name="maxY" select="40"/>
    <xsl:with-param name="context" select="2"/>
  </xsl:call-template>

  <xsl:call-template name="svgu:xAxis">
    <xsl:with-param name="min" select="0"/>
    <xsl:with-param name="max" select="6"/>
    <xsl:with-param name="offsetX" select="$offsetX"/>
    <xsl:with-param name="offsetY" select="$offsetY"/>
    <xsl:with-param name="width" select="$pwidth"/>
    <xsl:with-param name="height" select="$pheight"/>
    <xsl:with-param name="majorTopExtent" select="$pheight"/>
    <xsl:with-param name="minorTopExtent" select="$pheight"/>
  </xsl:call-template>

  <xsl:call-template name="svgu:yAxis">
    <xsl:with-param name="min" select="0"/>
    <xsl:with-param name="max" select="40"/>
    <xsl:with-param name="offsetX" select="$offsetX"/>
    <xsl:with-param name="offsetY" select="$offsetY"/>
    <xsl:with-param name="width" select="$pwidth"/>
    <xsl:with-param name="height" select="$pheight"/>
    <xsl:with-param name="majorRightExtent" select="$pwidth"/>
    <xsl:with-param name="minorRightExtent" select="$pwidth"/>
  </xsl:call-template>

</svg:svg>

</xsl:template>

<!-- Custom style uses context to figure out what line is being drawn -->
                  <xsl:template name="svgu:xyPlotStyle">
                  <xsl:param name="context"/>
                  <xsl:param name="scale"/>
                  <xsl:choose>
                  <xsl:when test="$context = 2">
                  <xsl:value-of select="concat('fill: none; stroke: red;
                  stroke-width:',16 div $scale,'; ')"/>
                  </xsl:when>
                  <xsl:otherwise>
                  <xsl:value-of select="concat('fill: none; stroke: black;
                  stroke-width:',1 div $scale,'; ')"/>
                  </xsl:otherwise>
                  </xsl:choose>
                  </xsl:template>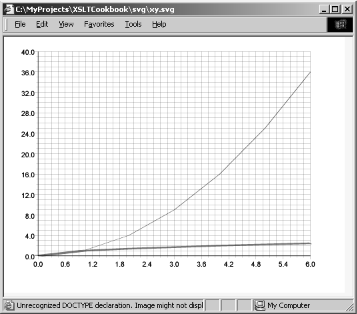
</xsl:stylesheet>
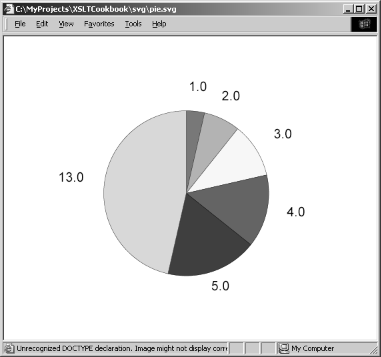
Pie-slice generation
Pie charts provide another common way to compare data. You can create a utility for generating these charts. The key to creating a pie chart is having a means to create the slices of the pie, which invariably involves trigonometry. Since XSLT does not come with trigonometric functions, you will use a Java-based extension. Of course, this immediately limits the portability of our stylesheet. If portability is a must, you could implement sine and cosine functions in XSLT (see Recipe 3.5 for guidance). Otherwise, include the following code in stylesheets that require Java math extensions. Details vary from processor to processor, so see Chapter 12 for more detailed information. This example works for Saxon:
<xsl:stylesheet
  <!-- v. 1.1 is defunct but works in Saxon to enable the -->
  <!-- xsl:script feature. -->
  version="1.1"
  xmlns:xsl="http://www.w3.org/1999/XSL/Transform"
  xmlns:svg="http://www.w3.org/2000/svg"
  xmlns:svgu="http://www.ora.com/XSLTCookbook/ns/svg-utils"
  xmlns:emath="http://www.exslt.org/math"
  xmlns:Math="java:java.lang.Math" extension-element-prefixes="Math"
       exclude-result-prefixes="svgu">

  <xsl:script implements-prefix="Math"
                   xmlns:Math="java:java.lang.Math"
                   language="java"
                   src="java:java.lang.Math"/>

  <!-- We use some XSLT stuff already developed in chatper 2 -->
  <xsl:include href="../math/math.max.xslt"/>
  <xsl:include href="../math/math.min.xslt"/>
...
</xsl:stylesheet>
The routine that does most of the mathematical work is
svgu:pieSlice. This routine was adapted from a
Perl program in SVG Essentials by J. David
Eisenberg (O’Reilly,
2002). Explaining the
trigonometry is
beyond the scope of this book, but essentially, the routine lets you
draw arcs
(based on rotations around a center
coordinate) to compensate for SVG’s less-intuitive
specification of arcs:
<xsl:variable name="svgu:pi" select="3.1415927"/>
<xsl:template name="svgu:pieSlice">
<xsl:param name="cx" select="100"/> <!-- Center x -->
<xsl:param name="cy" select="100"/> <!-- Center y -->
<xsl:param name="r" select="50"/> <!-- Radius -->
<xsl:param name="theta" select="0"/> <!-- Beginning angle in degrees-->
<xsl:param name="delta" select="90"/> <!-- Arc extent in degrees -->
<xsl:param name="phi" select="0"/> <!-- x-axis rotation angle -->
<xsl:param name="style" select=" 'fill: red;' "/>
<xsl:param name="num"/>
<xsl:param name="context"/>
<!--Convert angles to radians -->
<xsl:variable name="theta1"
select="$theta * $svgu:pi div 180"/>
<xsl:variable name="theta2"
select="($delta + $theta) * $svgu:pi div 180"/>
<xsl:variable name="phi_r" select="$phi * $svgu:pi div 180"/>
<!--Figure out begin and end coordinates -->
<xsl:variable name="x0"
select="$cx + Math:cos($phi_r) * $r * Math:cos($theta1) +
Math:sin(-$phi_r) * $r * Math:sin($theta1)"/>
<xsl:variable name="y0"
select="$cy + Math:sin($phi_r) * $r * Math:cos($theta1) +
Math:cos($phi_r) * $r * Math:sin($theta1)"/>
<xsl:variable name="x1"
select="$cx + Math:cos($phi_r) * $r * Math:cos($theta2) +
Math:sin(-$phi_r) * $r * Math:sin($theta2)"/>
<xsl:variable name="y1"
select="$cy + Math:sin($phi_r) * $r * Math:cos($theta2) +
Math:cos($phi_r) * $r * Math:sin($theta2)"/>
<xsl:variable name="large-arc" select="($delta > 180) * 1"/>
<xsl:variable name="sweep" select="($delta > 0) * 1"/>
<svg:path style="{$style} id="{$context}_pieSlice_{$num}">
<xsl:attribute name="d">
<xsl:value-of select="concat('M ', $x0,' ',$y0,
' A ', $r,' ',$r,',',
$phi,',',
$large-arc,',',
$sweep,',',
$x1,' ',$y1,
' L ',$cx,' ',$cy,
' L ', $x0,' ',$y0)"/>
</xsl:attribute>
</svg:path>
</xsl:template>
<xsl:template name="svgu:pieSliceLabel">
<xsl:param name="label" /> <!-- Label -->
<xsl:param name="cx" select="100"/> <!-- Center x -->
<xsl:param name="cy" select="100"/> <!-- Center y -->
<xsl:param name="r" select="50"/> <!-- Radius -->
<xsl:param name="theta" select="0"/> <!-- Beginning angle in degrees-->
<xsl:param name="delta" select="90"/> <!-- Arc extent in degrees -->
<xsl:param name="style" select=" 'font-size: 18;' "/>
<xsl:param name="num"/>
<xsl:param name="context"/>
<!--Convert angles to radians -->
<xsl:variable name="theta2"
select="(($delta + $theta) mod 360 + 360) mod 360"/>
<!-- normalize angles -->
<xsl:variable name="theta2_r" select="$theta2 * $svgu:pi div 180"/>
<xsl:variable name="x" select="$cx + $r * Math:cos($theta2_r)"/>
<xsl:variable name="y" select="$cy + $r * Math:sin($theta2_r)"/>
<!-- Compute the point to anchor text based on position -->
<!-- around the pie. This create a more or less uniform spacing -->
<xsl:variable name="anchor">
<xsl:choose>
<xsl:when test="contains($style,'text-anchor')"></xsl:when>
<xsl:when test="$theta2 >= 0 and $theta2 <= 45">start</xsl:when>
<xsl:when test="$theta2 > 45 and
$theta2 <= 135">middle</xsl:when>
<xsl:when test="$theta2 > 135 and $theta2 <= 225">end</xsl:when>
<xsl:when test="$theta2 > 225 and
$theta2 <= 315">middle</xsl:when>
<xsl:otherwise>start</xsl:otherwise>
</xsl:choose>
</xsl:variable>
<svg:text x="{$x}" y="{$y}"
style="text-anchor:{$anchor};{$style}"
id="{$context}_pieSliceLabel_{$num}">
<xsl:value-of select="$label"/>
</svg:text>
</xsl:template>
<xsl:template name="svgu:pie">
<xsl:param name="data" select="/.."/> <!-- Data to chart -->
<xsl:param name="cx" select="100"/> <!-- Center x -->
<xsl:param name="cy" select="100"/> <!-- Center y -->
<xsl:param name="r" select="50"/> <!-- Radius -->
<xsl:param name="theta" select="-90"/> <!-- Beginning angle for first
slice in degrees-->
<xsl:param name="context"/> <!-- User data to identify this
invocation -->
<xsl:call-template name="svgu:pieImpl">
<xsl:with-param name="data" select="$data"/>
<xsl:with-param name="cx" select="$cx"/>
<xsl:with-param name="cy" select="$cy"/>
<xsl:with-param name="r" select="$r"/>
<xsl:with-param name="theta" select="$theta"/>
<xsl:with-param name="sum" select="sum($data)"/>
<xsl:with-param name="context" select="$context"/>
</xsl:call-template>
</xsl:template>
<!-- Recursive implementation -->
<xsl:template name="svgu:pieImpl">
<xsl:param name="data" />
<xsl:param name="cx" />
<xsl:param name="cy" />
<xsl:param name="r" />
<xsl:param name="theta"/>
<xsl:param name="sum"/>
<xsl:param name="context"/>
<xsl:param name="i" select="1"/>
<xsl:if test="count($data) >= $i">
<xsl:variable name="delta" select="($data[$i] * 360) div $sum"/>
<!-- Draw slice of pie -->
<xsl:call-template name="svgu:pieSlice">
<xsl:with-param name="cx" select="$cx"/>
<xsl:with-param name="cy" select="$cy"/>
<xsl:with-param name="r" select="$r"/>
<xsl:with-param name="theta" select="$theta"/>
<xsl:with-param name="delta" select="$delta"/>
<xsl:with-param name="style">
<xsl:call-template name="svgu:pieSliceStyle">
<xsl:with-param name="i" select="$i"/>
<xsl:with-param name="context" select="$context"/>
</xsl:call-template>
</xsl:with-param>
<xsl:with-param name="num" select="$i"/>
<xsl:with-param name="context" select="$context"/>
</xsl:call-template>
<!-- Recursive call for next slice -->
<xsl:call-template name="svgu:pieImpl">
<xsl:with-param name="data" select="$data"/>
<xsl:with-param name="cx" select="$cx"/>
<xsl:with-param name="cy" select="$cy"/>
<xsl:with-param name="r" select="$r"/>
<xsl:with-param name="theta" select="$theta + $delta"/>
<xsl:with-param name="sum" select="$sum"/>
<xsl:with-param name="context" select="$context"/>
<xsl:with-param name="i" select="$i + 1"/>
</xsl:call-template>
</xsl:if>
</xsl:template>
<!-- Arranges the labels around the chart for each slice -->
<xsl:template name="svgu:pieLabels">
<xsl:param name="data" select="/.."/> <!-- Data for slices -->
<xsl:param name="labels" select="$data"/> <!-- Node set of labels to
chart. Defaults to data -->
<xsl:param name="cx" select="100"/> <!-- Center x -->
<xsl:param name="cy" select="100"/> <!-- Center y -->
<xsl:param name="r" select="50"/> <!-- Radius -->
<xsl:param name="theta" select="-90"/> <!-- Beginning angle for first
slice in degrees-->
<xsl:param name="context"/> <!-- User data to identify this
invocation -->
<xsl:call-template name="svgu:pieLabelsImpl">
<xsl:with-param name="data" select="$data"/>
<xsl:with-param name="labels" select="$labels"/>
<xsl:with-param name="cx" select="$cx"/>
<xsl:with-param name="cy" select="$cy"/>
<xsl:with-param name="r" select="$r"/>
<xsl:with-param name="theta" select="$theta"/>
<xsl:with-param name="sum" select="sum($data)"/>
<xsl:with-param name="context" select="$context"/>
</xsl:call-template>
</xsl:template>
<xsl:template name="svgu:pieLabelsImpl">
<xsl:param name="data" />
<xsl:param name="labels"/>
<xsl:param name="cx" />
<xsl:param name="cy" />
<xsl:param name="r" />
<xsl:param name="theta"/>
<xsl:param name="sum"/>
<xsl:param name="context"/>
<xsl:param name="i" select="1"/>
<xsl:if test="count($data) >= $i">
<xsl:variable name="delta" select="($data[$i] * 360) div $sum"/>
<!-- Draw slice of pie -->
<xsl:call-template name="svgu:pieSliceLabel">
<xsl:with-param name="label" select="$labels[$i]"/>
<xsl:with-param name="cx" select="$cx"/>
<xsl:with-param name="cy" select="$cy"/>
<xsl:with-param name="r" select="$r"/>
<xsl:with-param name="theta" select="$theta"/>
<xsl:with-param name="delta" select="$delta div 2"/>
<xsl:with-param name="style">
<xsl:call-template name="svgu:pieSliceLabelStyle">
<xsl:with-param name="i" select="$i"/>
<xsl:with-param name="value" select="$data[$i]"/>
<xsl:with-param name="label" select="$labels[$i]"/>
<xsl:with-param name="context" select="$context"/>
</xsl:call-template>
</xsl:with-param>
<xsl:with-param name="num" select="$i"/>
<xsl:with-param name="context" select="$context"/>
</xsl:call-template>
<!-- Recursive call for next slice label -->
<xsl:call-template name="svgu:pieLabelsImpl">
<xsl:with-param name="data" select="$data"/>
<xsl:with-param name="labels" select="$labels"/>
<xsl:with-param name="cx" select="$cx"/>
<xsl:with-param name="cy" select="$cy"/>
<xsl:with-param name="r" select="$r"/>
<xsl:with-param name="theta" select="$theta + $delta"/>
<xsl:with-param name="sum" select="$sum"/>
<xsl:with-param name="context" select="$context"/>
<xsl:with-param name="i" select="$i + 1"/>
</xsl:call-template>
</xsl:if>
</xsl:template>
<!-- Override to alter a slice's style -->
<xsl:template name="svgu:pieSliceStyle">
<xsl:param name="i"/>
<xsl:param name="context"/>
<xsl:variable name="colors" select="document('')/*/svgu:color"/>
<xsl:value-of select="concat('stroke:black;
stroke-width:0.5;
fill: ',$colors[($i - 1 ) mod
count($colors) + 1])"/>
</xsl:template>
<!-- Override to alter a slice label's style -->
<xsl:template name="svgu:pieSliceLabelStyle">
<xsl:param name="i"/>
<xsl:param name="value"/>
<xsl:param name="label" />
<xsl:param name="context"/>
<xsl:text>font-size: 16;</xsl:text>
</xsl:template>The following stylesheet creates a pie chart, as shown in Figure 11-12, from sample data.
<xsl:stylesheet version="1.0"
xmlns:xsl="http://www.w3.org/1999/XSL/Transform"
xmlns:svg="http://www.w3.org/2000/svg"
xmlns:svgu="http://www.ora.com/XSLTCookbook/ns/svg-utils"
xmlns:test="http://www.ora.com/XSLTCookbook/ns/test"
exclude-result-prefixes="svgu test">
<xsl:include href="svg-utils.xslt"/>
<xsl:output method="xml" version="1.0" encoding="UTF-8" indent="yes"
doctype-public="-//W3C//DTD SVG 1.0/EN"
doctype-system="http://www.w3.org/TR/2001/REC-SVG-20010904/DTD/svg10.dtd"/>
<test:data>1.0</test:data>
<test:data>2.0</test:data>
<test:data>3.0</test:data>
<test:data>4.0</test:data>
<test:data>5.0</test:data>
<test:data>13.0</test:data>
<xsl:template match="/">
<svg:svg width="500" height="500">
<xsl:call-template name="svgu:pie">
<xsl:with-param name="data" select="document('')/*/test:data"/>
<xsl:with-param name="cx" select="250"/>
<xsl:with-param name="cy" select="250"/>
<xsl:with-param name="r" select="100"/>
<xsl:with-param name="theta" select="-90"/>
</xsl:call-template>
<xsl:call-template name="svgu:pieLabels">
<xsl:with-param name="data" select="document('')/*/test:data"/>
<xsl:with-param name="cx" select="250"/>
<xsl:with-param name="cy" select="250"/>
<xsl:with-param name="r" select="125"/>
<xsl:with-param name="theta" select="-90"/>
</xsl:call-template>
</svg:svg>
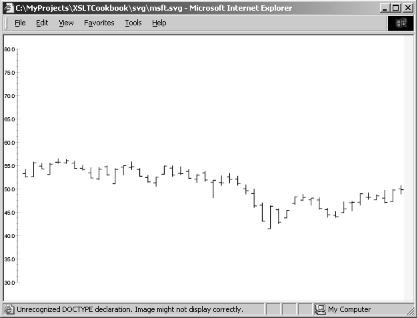
</xsl:template>Open-Hi-Lo-Close plots
Open-Hi-Lo-Close plots are commonly used to plot securities data, but can be used in other applications (for example, to show min, max, mean, and median). The data is passed into this template as four different node sets representing each series. Only the high and low sets are required. The template also handles series with missing data points:
  <xsl:template name="svgu:openHiLoClose">
    <xsl:param name="openData" select="/.."/>
    <xsl:param name="hiData" select="/.."/>
    <xsl:param name="loData" select="/.."/>
    <xsl:param name="closeData" select="/.."/>
    <xsl:param name="width" select=" '500' "/>
    <xsl:param name="height" select=" '500' "/>
    <xsl:param name="offsetX" select="0"/>
    <xsl:param name="offsetY" select="0"/>
    <xsl:param name="openCloseExtent" select="8"/>
    <xsl:param name="max">
     <xsl:call-template name="emath:max">
       <xsl:with-param name="nodes" select="$hiData"/>
     </xsl:call-template>
    </xsl:param>
    <xsl:param name="min">
     <xsl:call-template name="emath:min">
       <xsl:with-param name="nodes" select="$loData"/>
     </xsl:call-template>
    </xsl:param>
    <xsl:param name="context"/>

    <xsl:variable name="hiCount" select="count($hiData)"/>
    <xsl:variable name="loCount" select="count($loData)"/>
    <xsl:variable name="openCount" select="count($openData)"/>
    <xsl:variable name="closeCount" select="count($closeData)"/>

    <xsl:variable name="numBars" select="Math:min($hiCount, $loCount)"/>

    <xsl:variable name="spacing" select="$width div ($numBars + 1)"/>

    <xsl:variable name="range" select="$max - $min"/>
    <xsl:variable name="scale" select="$height div $range"/>

    <svg:g transform="translate({$offsetX},{$offsetY+$height})
                            scale(1,{-$scale})
                            translate(0,{-$min})">

      <xsl:for-each select="$hiData">
        <xsl:variable name="pos" select="position()"/>

        <!--draw hi-lo line -->
        <svg:line x1="{$spacing * $pos}"
                y1="{$loData[$pos]}"
                x2="{$spacing * $pos}"
                y2="{current()}"id="{$context}_highLow_{$pos}">
           <xsl:attribute name="style">
             <xsl:call-template name="svgu:hiLoBarStyle">
               <xsl:with-param name="pos" select="$pos"/>
               <xsl:with-param name="context" select="$context"/>
             </xsl:call-template>
           </xsl:attribute>
        </svg:line>

        <!--draw open mark if opening data present -->
        <xsl:if test="$openCount >= $pos">
          <svg:line x1="{$spacing * $pos - $openCloseExtent}"
                  y1="{$openData[$pos]}"
                  x2="{$spacing * $pos}"
                  y2="{$openData[$pos]}"
                  id="{$context}_open_{$pos}">
             <xsl:attribute name="style">
               <xsl:call-template name="svgu:openCloseBarStyle">
                 <xsl:with-param name="pos" select="$pos"/>
                 <xsl:with-param name="scale" select="$scale"/>
                 <xsl:with-param name="context" select="$context"/>
               </xsl:call-template>
             </xsl:attribute>
          </svg:line>
        </xsl:if>

        <!--draw close mark if closing data present -->
        <xsl:if test="$closeCount >= $pos">
          <svg:line x1="{$spacing * $pos}"
                  y1="{$closeData[$pos]}"
                  x2="{$spacing * $pos +  $openCloseExtent}"
                  y2="{$closeData[$pos]}"
                  id="{$context}_close_{$pos}">
             <xsl:attribute name="style">
               <xsl:call-template name="svgu:openCloseBarStyle">
                 <xsl:with-param name="pos" select="$pos"/>
                 <xsl:with-param name="scale" select="$scale"/>
                 <xsl:with-param name="context" select="$context"/>
               </xsl:call-template>
             </xsl:attribute>
          </svg:line>
        </xsl:if>

      </xsl:for-each>
    </svg:g>

  </xsl:template>

   <xsl:template name="svgu:hiLoBarStyle">
     <xsl:param name="pos"/>
     <xsl:param name="context"/>
     <xsl:text>stroke: black; stroke-width: 1 </xsl:text>
   </xsl:template>

   <xsl:template name="svgu:openCloseBarStyle">
     <xsl:param name="pos"/>
     <xsl:param name="scale"/>
     <xsl:param name="context"/>
     <xsl:text>stroke: black; stroke-width: </xsl:text>
     <xsl:value-of select="2 div $scale"/>
   </xsl:template>

</xsl:stylesheet>
You can use this routine to plot stock data, as shown in Figure 11-13:
<xsl:stylesheet version="1.0"
  xmlns:xsl="http://www.w3.org/1999/XSL/Transform"
  xmlns:svg="http://www.w3.org/2000/svg"
  xmlns:svgu="http://www.ora.com/XSLTCookbook/ns/svg-utils"
  exclude-result-prefixes="svgu">

<xsl:include href="svg-utils.xslt"/>

<xsl:output method="xml" version="1.0" encoding="UTF-8" indent="yes"
  doctype-public="-//W3C//DTD SVG 1.0/EN"
  doctype-system="http://www.w3.org/TR/2001/REC-SVG-20010904/DTD/svg10.dtd"/>

<xsl:template match="/">

<svg:svg width="600" height="400">

  <xsl:call-template name="svgu:openHiLoClose">
    <xsl:with-param name="openData" select="*/row/open"/>
    <xsl:with-param name="hiData" select="*/row/high"/>
    <xsl:with-param name="loData" select="*/row/low"/>
    <xsl:with-param name="closeData" select="*/row/close"/>
    <xsl:with-param name="min" select="30"/>
    <xsl:with-param name="max" select="80"/>
    <xsl:with-param name="width" select="600"/>
    <xsl:with-param name="height" select="350"/>
    <xsl:with-param name="offsetX" select="20"/>
    <xsl:with-param name="offsetY" select="20"/>
    <xsl:with-param name="boundingBox" select="1"/>
  </xsl:call-template>

  <xsl:call-template name="svgu:yAxis">
    <xsl:with-param name="min" select="30"/>
    <xsl:with-param name="max" select="80"/>
    <xsl:with-param name="offsetX" select="20"/>
    <xsl:with-param name="offsetY" select="20"/>
    <xsl:with-param name="width" select="600"/>
    <xsl:with-param name="height" select="350"/>
  </xsl:call-template>

</svg:svg>

</xsl:template>

</xsl:stylesheet>
XSLT 2.0
Very little of substance needs to change when porting the 1.0 recipes
to 2.0. The templates take a large number of parameters so adding
types to all parameters and variables will lead to fewer runtime
errors. Parameters dealing with dimensions like length and width
should be xs:double, and those dealing with
numbers of ticks and the like should be
xs:integer. A few parameters are
xs:boolean, but those are obvious because they
take default values of true() or false().
Discussion
XML-to-SVG transformations are not usually trivial. Graphical layout
of data requires careful planning, even to get the relatively modest
results obtained by these examples. Approaching every XML-to-SVG
transformation anew would be foolhardy—a toolbox of reusable
utilities is essential. I have concentrated on utilities for
charting, but you can certainly come up with utilities for other
domains. The technique used to design these utilities breaks the
construction of a graphic into component parts and creates templates
that construct those parts in a way that allows mixing and matching.
A key consideration in employing this technique is to make sure that
each template can accept enough information to scale its coordinate
system in a way that is compatible with graphics created by
independent templates. For example, most of these templates contain
$min and $max parameters, even
when reasonable values can be computed from the input data. This
situation lets the caller override the defaults to consider the range
of data appearing in the graph as a whole.
One design decision made in these templates was to allow style information to be obtained via calls to default templates that can be overridden by an importing stylesheet. In many cases, this information could have been supplied by additional parameters. This callback-driven approach was selected because it provides a flexible way to stylize as a function of the plotted data. For example, consider how the pie slice or bars can vary as a function of the data point being plotted at any instant:
  <xsl:template name="svgu:pieSliceStyle">
    <xsl:param name="i"/>
    <xsl:param name="context"/>
    <xsl:variable name="colors" select="document('')/*/svgu:color"/>
    <xsl:value-of select="concat('stroke:black;
                                  stroke-width:0.5;
                                  fill: ',$colors[($i - 1 ) mod
                                           count($colors) + 1])"/>
  </xsl:template>
You might even consider passing additional parameters to such
functions from the main template. One obvious addition would pass the
actual data point so that, for example, the actual data magnitude can
drive the choice of color. One limitation of this technique is that
any given stylesheet can only override a template one time. This
section compensates for the limitation by using a user-specified
context parameter. This parameter allows overridden templates to
alter their behavior based on the context. The context plays double
duty; you can use it as a basis for generating identifiers for an SVG
Element’s id attribute. This is
useful if you want to interact with the generated SVG (see Recipe
Recipe 11.4).
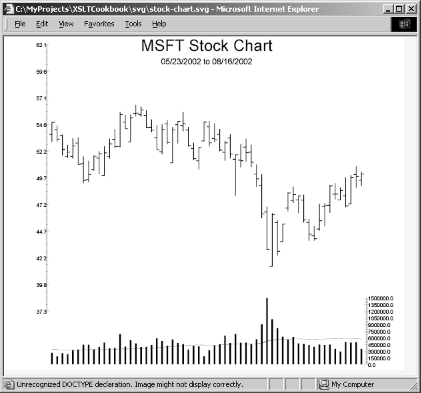
The final example creates a complex chart that utilizes Open-High-Low-Close bars for stock data, a bar chart for volume, an XY-plot for volume-moving average, and two y-axes for the price and volume scales. The results are shown in Figure 11-14.
<xsl:stylesheet version="1.0"
  xmlns:xsl="http://www.w3.org/1999/XSL/Transform"
  xmlns:svg="http://www.w3.org/2000/svg"
  xmlns:svgu="http://www.ora.com/XSLTCookbook/ns/svg-utils"
  xmlns:emath="http://www.exslt.org/math"
  exclude-result-prefixes="svgu">

  <xsl:include href="svg-utils.xslt"/>

  <xsl:output method="xml" version="1.0" encoding="UTF-8" indent="yes"
    doctype-public="-//W3C//DTD SVG 1.0/EN"
    doctype-system="http://www.w3.org/TR/2001/REC-SVG-20010904/DTD/svg10.dtd"/>

  <xsl:variable name="width" select="600"/>
  <xsl:variable name="height" select="500"/>
  <xsl:variable name="pwidth" select="$width * 0.8"/>
  <xsl:variable name="pheight" select="$height * 0.8"/>
  <xsl:variable name="offsetX" select="($width - $pwidth) div 2"/>
  <xsl:variable name="offsetY" select="10"/>

  <xsl:variable name="dataMin">
    <xsl:call-template name="emath:min">
      <xsl:with-param name="nodes" select="//Low"/>
    </xsl:call-template>
  </xsl:variable>

  <xsl:variable name="dataMax">
    <xsl:call-template name="emath:max">
      <xsl:with-param name="nodes" select="//High"/>
    </xsl:call-template>
  </xsl:variable>

  <xsl:variable name="min" select="$dataMin * 0.9"/>
  <xsl:variable name="max" select="$dataMax * 1.1"/>

  <xsl:template match="/">

  <svg:svg width="{$width}" height="{$height}">

  <svg:text x="{$width div 2}" y="{2 * $offsetY}"
      style="text-anchor:middle; font-size:24">MSFT Stock Chart</svg:text>
  <svg:text x="{$width div 2}" y="{4 * $offsetY}"
      style="text-anchor:middle; font-size:12">05/23/2002 to 08/16/2002</svg:text>
  <!-- PRICE -->

    <xsl:call-template name="svgu:openHiLoClose">
      <xsl:with-param name="openData" select="*/row/Open"/>
      <xsl:with-param name="hiData" select="*/row/High"/>
      <xsl:with-param name="loData" select="*/row/Low"/>
      <xsl:with-param name="closeData" select="*/row/Close"/>
      <xsl:with-param name="min" select="$min"/>
      <xsl:with-param name="max" select="$max"/>
      <xsl:with-param name="width" select="$pwidth"/>
      <xsl:with-param name="height" select="$pheight"/>
      <xsl:with-param name="offsetX" select="$offsetX"/>
      <xsl:with-param name="offsetY" select="$offsetY"/>
      <xsl:with-param name="boundingBox" select="1"/>
    </xsl:call-template>

    <xsl:call-template name="svgu:yAxis">
      <xsl:with-param name="offsetX" select="$offsetX"/>
      <xsl:with-param name="offsetY" select="$offsetY"/>
      <xsl:with-param name="width" select="$pwidth"/>
      <xsl:with-param name="height" select="$pheight"/>
      <xsl:with-param name="min" select="$min"/>
      <xsl:with-param name="max" select="$max"/>
      <xsl:with-param name="context" select=" 'price' "/>
    </xsl:call-template>

  <!-- VOLUME -->
  <xsl:variable name="vheight" select="100"/>

  <xsl:call-template name="svgu:bars">
    <xsl:with-param name="data" select="*/row/Volume"/>
    <xsl:with-param name="width" select="$pwidth"/>
    <xsl:with-param name="height" select="$vheight"/>
    <xsl:with-param name="orientation" select="0"/>
    <xsl:with-param name="offsetX" select="$offsetX"/>
    <xsl:with-param name="offsetY" select="$pheight - $offsetY"/>
    <xsl:with-param name="barLabel" select="false()"/>
    <xsl:with-param name="min" select="0"/>
    <xsl:with-param name="max" select="1500000"/>
  </xsl:call-template>

  <!-- This is to make the line plot start on first bar and end on last bar -->
  <xsl:variable name="spacing" select="$pwidth div count(*/row/High) + 1"/>

  <xsl:call-template name="svgu:xyPlot">
    <xsl:with-param name="dataY" select="*/row/Vol10MA"/>
    <xsl:with-param name="width" select="$pwidth - 2 * $spacing"/>
    <xsl:with-param name="height" select="$vheight"/>
    <xsl:with-param name="offsetX" select="$offsetX + $spacing"/>
    <xsl:with-param name="offsetY" select="$pheight - $offsetY"/>
    <xsl:with-param name="minY" select="0"/>
    <xsl:with-param name="maxY" select="1500000"/>
  </xsl:call-template>

    <xsl:call-template name="svgu:yAxis">
      <xsl:with-param name="offsetX" select="$width - $offsetX"/>
      <xsl:with-param name="offsetY" select="$height - $vheight - $offsetY"/>
      <xsl:with-param name="width" select="$pwidth"/>
      <xsl:with-param name="height" select="$vheight"/>
      <xsl:with-param name="min" select="0"/>
      <xsl:with-param name="max" select="1500000"/>
      <xsl:with-param name="context" select=" 'volume' "/>
    </xsl:call-template>

  </svg:svg>

</xsl:template>

 <xsl:template name="svgu:barStyle">
    <xsl:text>stroke: black; stroke-wdth: 0.15</xsl:text>
 </xsl:template>

 <xsl:template name="svgu:xyPlotStyle">
   <xsl:param name="context"/>
   <xsl:param name="scale"/>
   <xsl:value-of select="concat('fill: none; stroke: black; stroke-width:',4 div
       $scale,'; ')"/>
 </xsl:template>

   <xsl:template name="yAxisLabelStyle">
     <xsl:param name="context"/>
     <xsl:choose>
      <xsl:when test="$context = 'price'">
       <xsl:text>text-anchor:end;font-size:8;baseline-shift:-50%</xsl:text>
      </xsl:when>
      <xsl:otherwise>
       <xsl:text>text-anchor:start;font-size:8;baseline-shift:-50%</xsl:text>
      </xsl:otherwise>
    </xsl:choose>
   </xsl:template>

  <!-- Shift the volume labels away from the tick marks -->
   <xsl:template name="yAxisLabelXOffset">
     <xsl:param name="context"/>
     <xsl:if test="$context = 'volume'">
       <xsl:value-of select="6"/>
     </xsl:if>
   </xsl:template>

</xsl:stylesheet>
11.3. Creating a Tree Diagram
Solution
This section presents two different algorithms for rendering a tree. Neither is the most sophisticated algorithm available, but both give reasonable results.
If all the trees you needed to render were balanced, then rendering a tree would be easy because you would need to divide the available horizontal space by the number of nodes at each level and the vertical space by the number of levels.[2] Unfortunately, real-world trees are not as symmetrical. You need an algorithm that considers the breadth of each branch.
The first technique makes only one pass over the tree. However, to accomplish this, it needs to embed foreign bookkeeping attributes into the resulting SVG. This example places these attributes in a namespace to ensure they will not conflict with SVG-specific attributes:
<?xml version="1.0" encoding="UTF-8"?>
<xsl:stylesheet
  <!-- v. 1.1 is defunct but works in Saxon to enable the -->
  <!-- xsl:script feature. -->
  version="1.1"
  xmlns:emath="http://www.exslt.org/math"
  xmlns:xsl="http://www.w3.org/1999/XSL/Transform"
  xmlns:tree="http://www.ora.com/XSLTCookbook/ns/tree"
  xmlns:Math="java:java.lang.Math"
  extension-element-prefixes="Math"
  exclude-result-prefixes="Math emath">

  <xsl:script implements-prefix="Math"
                   xmlns:Math="java:java.lang.Math"
                   language="java"
                   src="java:java.lang.Math"/>

  <xsl:include href="../math/math.max.xslt"/>

  <xsl:output method="xml" version="1.0" encoding="UTF-8" indent="yes"
    doctype-public="-//W3C//DTD SVG 1.0/EN"
    doctype-system="http://www.w3.org/TR/2001/REC-SVG-20010904/DTD/svg10.dtd"/>

  <!-- These parameters control the proportions of the tree -->
  <!-- and its nodes -->
  <xsl:variable name="width" select="500"/>
  <xsl:variable name="height" select="500"/>
  <xsl:variable name="nodeWidth" select="2"/>
  <xsl:variable name="nodeHeight" select="1"/>
  <xsl:variable name="horzSpace" select="0.5"/>
  <xsl:variable name="vertSpace" select="1"/>

  <xsl:template match="/">

  <svg width="{$width}" height="{$height}">

    <!-- Capture the subtree of this node in a variable -->
    <xsl:variable name="subTree">
      <xsl:apply-templates/>
    </xsl:variable>

    <!--maxPos is the max of the furthest X or Y coordinate used in -->
    <!--rendering a node -->
    <xsl:variable name="maxPos"
                  select="Math:max(number($subTree/g/@tree:MAXX),
                          number($subTree/g/@tree:MAXY))"/>
    <xsl:variable name="maxDim" select="Math:max($width,$height)"/>

    <!--We scale the tree so all nodes will fit in the -->
    <!--coordinate system -->
    <g transform="scale({$maxDim div ($maxPos + 1)})">

    <!-- Use exsl:node-set($subTree) -->
    <!-- if your XSLT processor is version 1.0 -->
      <xsl:copy-of select="$subTree/g/*"/>
    </g>

  </svg>
  </xsl:template>

  <!-- This matches all non-leaf nodes -->
  <xsl:template match="*[*]">

    <xsl:variable name="subTree">
        <xsl:apply-templates/>
    </xsl:variable>

    <!-- Position this node horizontally based on the average -->
    <!-- position of its children -->
    <xsl:variable name="thisX"
                         select="sum($subTree/*/@tree:THISX)
                                      div count($subTree/*)"/>

    <xsl:variable name="maxX" select="$subTree/*[last()]/@tree:MAXX"/>

    <!-- Position this node vertically based on its level -->
    <xsl:variable name="thisY"
         select="($vertSpace + $nodeHeight) * count(ancestor-or-self::*)"/>

    <xsl:variable name="maxY">
      <xsl:call-template name="emath:max">
        <!-- Use exsl:node-set($subTree) if your XSLT processor -->
        <!-- is version 1.0 -->
        <xsl:with-param name="nodes" select="$subTree/*/@tree:MAXY"/>
      </xsl:call-template>
    </xsl:variable>

    <!-- We place the parent and its children and the connectors -->
    <!-- in a group -->
    <!-- We also add bookkeeping attributes to the group as a means of -->
    <!--passing information up the tree -->
    <g tree:THISX="{$thisX}" tree:MAXX="{$maxX}" tree:MAXY="{$maxY}">
      <rect x="{$thisX - $nodeWidth}"
               y="{$thisY - $nodeHeight}"
               width="{$nodeWidth}"
               height="{$nodeHeight}"
               style="fill: none; stroke: black; stroke-width:0.1"/>

      <!--Draw a connecting line between current node and its children -->
      <xsl:call-template name="drawConnections">
           <xsl:with-param name="xParent" select="$thisX - $nodeWidth"/>
           <xsl:with-param name="yParent" select="$thisY - $nodeHeight"/>
           <xsl:with-param name="widthParent" select="$nodeWidth"/>
           <xsl:with-param name="heightParent" select="$nodeHeight"/>
           <xsl:with-param name="children" select="$subTree/g/rect"/>
      </xsl:call-template>

      <!--Copy the SVG of the sub tree -->
      <xsl:copy-of select="$subTree"/>
    </g>

  </xsl:template>

  <!-- This matches all leaf nodes -->
  <xsl:template match="*">

    <!-- Position leaf nodes horizontally based on the number of -->
    <!-- preceding leaf nodes -->
    <xsl:variable name="maxX"
         select="($horzSpace + $nodeWidth) *
                 (count(preceding::*[not(child::*)] ) + 1) "/>
You can use count(ancestor-or-self::*) to get the
level each time. However, you might consider adding a parameter to
pass the level down the tree rather than recomputing each time:
    <!-- Position this node vertically based on its level -->
    <xsl:variable name="maxY"
        select="($vertSpace + $nodeHeight) * count(ancestor-or-self::*) "/>

    <g tree:THISX="{$maxX}" tree:MAXX="{$maxX}" tree:MAXY="{$maxY}">
      <rect x="{$maxX - $nodeWidth}"
               y="{$maxY - $nodeHeight}"
               width="{$nodeWidth}"
               height="{$nodeHeight}"
               style="fill: none; stroke: black; stroke-width:0.1;"/>
    </g>

  </xsl:template>

  <!-- Override in importing stylesheet if you want -->
  <!-- straight or some custom type of connection -->
  <xsl:template name="drawConnections">
    <xsl:param name="xParent"/>
    <xsl:param name="yParent"/>
    <xsl:param name="widthParent"/>
    <xsl:param name="heightParent"/>
    <xsl:param name="children"/>
    <xsl:call-template name="drawSquareConnections">
      <xsl:with-param name="xParent" select="$xParent"/>
      <xsl:with-param name="yParent" select="$yParent"/>
      <xsl:with-param name="widthParent" select="$widthParent"/>
      <xsl:with-param name="heightParent" select="$heightParent"/>
      <xsl:with-param name="children" select="$children"/>
    </xsl:call-template>
  </xsl:template>

  <!-- Straight connections take the shortest path from center -->
  <!-- of parent bottom to center of child top -->
  <xsl:template name="drawStraightConnections">
    <xsl:param name="xParent"/>
    <xsl:param name="yParent"/>
    <xsl:param name="widthParent"/>
    <xsl:param name="heightParent"/>
    <xsl:param name="children"/>
    <xsl:for-each select="$children">
       <line x1="{$xParent + $widthParent div 2}"
               y1="{$yParent + $heightParent}"
               x2="{@x + $nodeWidth div 2}"
               y2="{@y}"
               style="stroke: black; stroke-width:0.1;"/>
    </xsl:for-each>
  </xsl:template>

  <!-- Square connections take the shortest path using only horizontal -->
  <!-- and vertical lines from center of parent bottom to center of -->
  <!-- child top -->
  <xsl:template name="drawSquareConnections">
    <xsl:param name="xParent"/>
    <xsl:param name="yParent"/>
    <xsl:param name="widthParent"/>
    <xsl:param name="heightParent"/>
    <xsl:param name="children"/>

    <xsl:variable name="midY"
        select="($children[1]/@y + ($yParent + $heightParent)) div 2"/>

    <!--vertical parent line -->
    <line x1="{$xParent + $widthParent div 2}"
            y1="{$yParent + $heightParent}"
            x2="{$xParent + $widthParent div 2}"
            y2="{$midY}"
            style="stroke: black; stroke-width:0.1;"/>

    <!--central horizontal line -->
    <line x1="{$children[1]/@x + $children[1]/@width div 2}"
            y1="{$midY}"
            x2="{$children[last()]/@x + $children[1]/@width div 2}"
            y2="{$midY}"
            style="stroke: black; stroke-width:0.1;"/>

    <!--vertical child lines -->
    <xsl:for-each select="$children">
       <line x1="{@x + $nodeWidth div 2}"
               y1="{$midY}"
               x2="{@x + $nodeWidth div 2}"
               y2="{@y}"
               style="stroke: black; stroke-width:0.1;"/>
    </xsl:for-each>

  </xsl:template>

  </xsl:stylesheet>
This stylesheet renders the structure of any XML document as a tree. Figure 11-15 shows the result against a simple XML input file.

The first algorithm yields trees whose parent nodes’ horizontal position is a function of the average position of its children. This causes the root node to be placed off center for unbalanced trees. The following algorithm is a slight improvement because it fixes the skewing problem and does not pollute the SVG with foreign attributes. However, it makes two passes over the input tree:
<?xml version="1.0" encoding="UTF-8"?>
<xsl:stylesheet version="1.1"
                         xmlns:emath="http://www.exslt.org/math"
                         xmlns:xsl="http://www.w3.org/1999/XSL/Transform"
                         xmlns:tree="http://www.ora.com/XSLTCookbook/ns/tree"
                         xmlns:Math="java:java.lang.Math"
                         extension-element-prefixes="Math"
                         exclude-result-prefixes="Math emath">

  <xsl:script implements-prefix="Math"
                   xmlns:Math="java:java.lang.Math"
                    language="java"
                    src="java:java.lang.Math"/>

  <xsl:include href="../math/math.max.xslt"/>

  <xsl:output method="xml" version="1.0"
                    encoding="UTF-8"
                    indent="yes"
                    doctype-public="-//W3C//DTD SVG 1.0/EN"
                    doctype-system="http://www.w3.org/TR/2001/REC-SVG-20010904/DTD/svg10.dtd"/>

  <xsl:variable name="width" select="500"/>
  <xsl:variable name="height" select="500"/>
  <xsl:variable name="nodeWidth" select="2"/>
  <xsl:variable name="nodeHeight" select="1"/>
  <xsl:variable name="horzSpace" select="0.5"/>
  <xsl:variable name="vertSpace" select="1"/>
  <xsl:variable name="strokeWidth" select="0.1"/>

  <xsl:template match="/">

    <!--Pass 1 copies input with added bookkeeping attributes -->
    <xsl:variable name="treeWithLayout">
      <xsl:apply-templates mode="layout"/>
    </xsl:variable>

    <xsl:variable name="maxPos"
      select="Math:max($treeWithLayout/*/@tree:WEIGHT *
                       ($nodeWidth + $horzSpace),
                       $treeWithLayout/*/@tree:MAXDEPTH *
                         ($nodeHeight + $vertSpace))"/>

    <xsl:variable name="maxDim" select="Math:max($width,$height)"/>

    <xsl:variable name="scale" select="$maxDim div ($maxPos + 1)"/>

    <!--Pass 2 creates SVG -->
    <svg height="{$height}" width="{$width}">
      <g transform="scale({$scale})">
        <xsl:apply-templates select="$treeWithLayout/*" mode="draw">
          <xsl:with-param name="x" select="0"/>
          <xsl:with-param name="y" select="0"/>
          <xsl:with-param name="width" select="$width div $scale"/>
          <xsl:with-param name="height" select="$height div $scale"/>
        </xsl:apply-templates>
      </g>
    </svg>
  </xsl:template>

  <!--Layout nodes with children -->
  <xsl:template match="node()[*]" mode="layout">
    <xsl:variable name="subTree">
      <xsl:apply-templates mode="layout"/>
    </xsl:variable>

    <!--Non-leaf nodes are assigned the sum of their child weights -->
    <xsl:variable name="thisWeight"
                         select="sum($subTree/*/@tree:WEIGHT)"/>

    <xsl:variable name="maxDepth">
      <xsl:call-template name="emath:max">
        <xsl:with-param name="nodes"
                                   select="$subTree/*/@tree:MAXDEPTH"/>
      </xsl:call-template>
    </xsl:variable>

    <xsl:copy>
      <xsl:copy-of select="@*"/>
      <xsl:attribute name="tree:WEIGHT">
        <xsl:value-of select="$thisWeight"/>
      </xsl:attribute>
      <xsl:attribute name="tree:MAXDEPTH">
        <xsl:value-of select="$maxDepth"/>
      </xsl:attribute>
      <xsl:copy-of select="$subTree"/>
    </xsl:copy>

  </xsl:template>

  <!--Layout leaf nodes -->
  <xsl:template match="*" mode="layout">
    <xsl:variable name="depth" select="count(ancestor-or-self::*) "/>
    <xsl:copy>
      <xsl:copy-of select="@*"/>
      <!--Leaf nodes are assigned weight 1 -->
      <xsl:attribute name="tree:WEIGHT">
        <xsl:value-of select="1"/>
      </xsl:attribute>
      <xsl:attribute name="tree:MAXDEPTH">
        <xsl:value-of select="$depth"/>
      </xsl:attribute>
    </xsl:copy>
  </xsl:template>

  <!--Draw non-leaf nodes -->
  <xsl:template match="node()[*]" mode="draw">
    <xsl:param name="x"/>
    <xsl:param name="y"/>
    <xsl:param name="width"/>
    <xsl:variable name="thisX"
                         select="$x + $width div 2 - ($nodeWidth+$horzSpace) div 2"/>
    <xsl:variable name="subTree">
      <xsl:call-template name="drawSubtree">
        <xsl:with-param name="nodes" select="*"/>
        <xsl:with-param name="weight" select="@tree:WEIGHT"/>
        <xsl:with-param name="x" select="$x"/>
        <xsl:with-param name="y" select="$y + $nodeHeight + $vertSpace"/>
        <xsl:with-param name="width" select="$width"/>
      </xsl:call-template>
    </xsl:variable>
    <g>

      <rect x="{$thisX}"
               y="{$y}"
               width="{$nodeWidth}"
               height="{$nodeHeight}"
               style="fill: none; stroke: black; stroke-width:{$strokeWidth};"/>

      <xsl:call-template name="drawConnections">
        <xsl:with-param name="xParent" select="$thisX"/>
        <xsl:with-param name="yParent" select="$y"/>
        <xsl:with-param name="widthParent" select="$nodeWidth"/>
        <xsl:with-param name="heightParent" select="$nodeHeight"/>
        <xsl:with-param name="children" select="$subTree/g/rect"/>
      </xsl:call-template>

      <xsl:copy-of select="$subTree"/>

    </g>

  </xsl:template>


  <!--Draw leaf nodes -->
  <xsl:template match="*" mode="draw">
    <xsl:param name="x"/>
    <xsl:param name="y"/>
    <xsl:param name="width"/>
    <xsl:variable name="thisX"
                         select="$x + $width div 2 - ($nodeWidth+$horzSpace) div 2"/>
    <g>
      <rect x="{$thisX}"
               y="{$y}"
               width="{$nodeWidth}"
               height="{$nodeHeight}"
               style="fill: none; stroke: black; stroke-width:{$strokeWidth};"/>
    </g>
  </xsl:template>

  <!-- Recursive routine for drawing subtree -->
  <!-- Allocates horz space based on weight given to node -->
  <xsl:template name="drawSubtree">
    <xsl:param name="nodes" select="/.."/>
    <xsl:param name="weight"/>
    <xsl:param name="x"/>
    <xsl:param name="y"/>
    <xsl:param name="width"/>

    <xsl:if test="$nodes">
      <xsl:variable name="node" select="$nodes[1]"/>
      <xsl:variable name="ratio" select="$node/@tree:WEIGHT div $weight"/>

      <!--Draw node and its children in sub partition of space-->
      <!--based on current x and width allocation -->
      <xsl:apply-templates select="$node" mode="draw">
        <xsl:with-param name="x" select="$x"/>
        <xsl:with-param name="y" select="$y"/>
        <xsl:with-param name="width" select="$width * $ratio"/>
      </xsl:apply-templates>

      <!-- Process remaining nodes -->
      <xsl:call-template name="drawSubtree">
        <xsl:with-param name="nodes" select="$nodes[position() > 1]"/>
        <xsl:with-param name="weight" select="$weight"/>
        <xsl:with-param name="x" select="$x + $width * $ratio"/>
        <xsl:with-param name="y" select="$y"/>
        <xsl:with-param name="width" select="$width"/>
      </xsl:call-template>
    </xsl:if>

  </xsl:template>

<!-- Elided code for connections. Same as previous stylesheet -->

</xsl:stylesheet>
Figure 11-16 shows the same input XML rendered with this new algorithm.

Discussion
The previous recipes are incomplete because they render only the tree’s skeleton and not any of its content. An obvious extension would add text to the nodes to make them identifiable. This extension can be tricky because SVG doesn’t scale text automatically, and it becomes especially difficult if the width of the boxes change based on the amount of text they contain. See Recipe 14.14 for a Java-extension function that can help solve SVG text-layout problems.
You chose to map all nodes in the input document to nodes in the SVG
tree. In a real-life problem, you would probably filter out
irrelevant nodes by using match patterns more specific than
match="node()[*]" and
match="*“.
If the tree structure of your data is not modeled literally by the hierarchical structure of the XML, then you need to preprocess the input to create such a structure. For example, this would be the case if the parent-child structure were encoded as pointers and targets stored in attributes.
The stylesheets have code that support two types of connections. The
examples use square connections. Straight connections, shown in Figure 11-17, can be obtained by overriding
drawConnections to call
drawStraightConnections.

These stylesheets present two portability issues. First, they use a
Java extension to access the Java Math:max
function. This function can be implemented easily in XSLT. However,
since SVG-generating stylesheets often need other types of extension
functions, the problem may be unavoidable. The other portability
issue is that they assume support for XSLT 1.1 (now defunct) or
higher where the result-tree fragments can be properly treated as
node sets.
You may wish to use your XSLT
processor’s nodes set converter instead.
See Also
To learn more about sophisticated algorithms for drawing trees and more general graphs, consult Graph Drawing: Algorithms for the Visualization of Graphs by Giuseppe Di Battista, Peter Eades, Roberto Tamassia, and Ionnis G. Tollis (Prentice Hall, 1999). Be forewarned that the book is heavy on the mathematical side; it is not an algorithms pseudocode cookbook.
11.4. Creating Interactive SVG-Enabled Web Pages
Solution
This solution is based on an adaptation of code presented in Didier Martin’s XML.com article Integration by Parts: XSLT, XLink and SVG (http://www.xml.com/lpt/a/2000/03/22/style/index.html). The stylesheet embeds an SVG graphic in an HTML page along with information obtained from an XML document. JavaScript is added to allow the user to interact with the graphic. This particular example is a prototype of an online real-estate application in which users can interact with a layout diagram of a house.
The input XML contains information about the house. Each room is
associated with an id that links the data in the
room to a g element in the SVG diagram with the
same identifier:
<?xml version="1.0" encoding="UTF-8"?>
<?xml-stylesheet type="text/xsl" href="HouseLayout.xsl"?>
<House>
  <Location>
    <Address>1234 Main St. </Address>
    <City>Pleasantville </City>
    <State>NJ</State>
  </Location>
  <Layout figure="HouseLayout.svg">
    <Room id="bedroom1">
      <Name>Bedroom</Name>
      <Length>10</Length>
      <Width>10</Width>
      <Windows>2</Windows>
      <Misc>View of junk yard</Misc>
    </Room>
    <Room id="bedroom2">
      <Name>Bedroom</Name>
      <Length>10</Length>
      <Width>10</Width>
      <Windows>1</Windows>
      <Misc>Elvis slept here</Misc>
    </Room>
    <Room id="masterBedroom">
      <Name>Master Bedroom</Name>
      <Length>18</Length>
      <Width>10</Width>
      <Windows>3</Windows>
      <Misc>Walk-in Closet</Misc>
    </Room>
    <Room id="masterBath">
      <Name>Master Bath</Name>
      <Length>5</Length>
      <Width>5</Width>
      <Windows>1</Windows>
      <Misc>Full Bath w/ bidet</Misc>
    </Room>
    <Room id="kitchen">
      <Name>Kitchen</Name>
      <Length>20</Length>
      <Width>18</Width>
      <Windows>2</Windows>
      <Misc>New Cabinets</Misc>
    </Room>
    <Room id="livingRoom">
      <Name>Living Room</Name>
      <Length>18</Length>
      <Width>18</Width>
      <Windows>2</Windows>
      <Misc>View of Rose Garden</Misc>
    </Room>
    <Room id="bath1">
      <Name>Bathroom</Name>
      <Length>6</Length>
      <Width>5</Width>
      <Windows>1</Windows>
      <Misc>Heart-Shaped Tub</Misc>
    </Room>
  </Layout>
</House>
The stylesheet embeds the SVG file, converts the XML data into a table, and adds canned JavaScript that makes the page interactive, as shown in Figure 11-18.
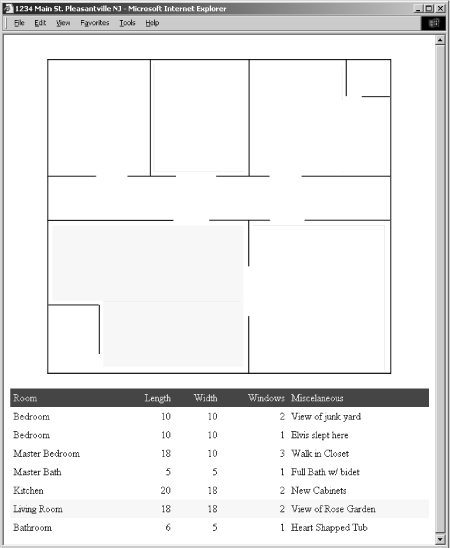
<xsl:stylesheet xmlns:xsl="http://www.w3.org/1999/XSL/Transform"
          xmlns:xlink="http://www.w3.org/1999/xlink"
          version="1.0">
<xsl:output method="html" version="4"/>

<xsl:template match="/">
<html>
<head>
<title><xsl:value-of select="concat(*/*/Address,*/*/City,*/*/State)"/></title>
<script><![CDATA[

var item_selected = null;

// When the mouse pointer triggers the mouse over event
// This function is called.
// We are using both the SVGDOM and the XML DOM
// to access the document's tree nodes.
// More particularly, this function change elements
// identified by the id attribute.
// Note that to change a style attribute with the SVG DOM does not
// require to know in advance the value of the style attribute.
// In contrast, with the XML DOM, you need to know the full content
// of the style attribute.
function on_mouse_over (ID)
{
     if (ID == item_selected)
          return true;

     var obj_name = ID ;

     // Change the SVG element's style
     // -------------------------------
     // 1 - get the SVGDOM document element from the Adobe SVG viewer
     // 2 - Then, get the element included in the SVG document and which is
     // referred by the id identifier.
     // 3 - Finally, get the style attribute from the SVG DOM element node.
     // The getStyle function is particular to the SVG DOM.
     // The get style function returns a style object.
     // We change the 'fill' style attribute with the returned
     // style object. Note that in contrast to the XML DOM,
     // we do not need to know in advance the content of the
     // style attribute's value to change one of the CSS attribute.
     var svgdoc = document.figure.getSVGDocument();
     var svgobj = svgdoc.getElementById(obj_name);
     if (svgobj != null)
     {
          var svgStyle = svgobj.getStyle();
          svgStyle.setProperty ('fill', 'yellow'),
     }

     // Here is what we should have if the target browser
     // would fully support the XML DOM
     // --------------------------------------------------
     // Get the element included in this HTML document (see in the body
     // section) and which is referred by the identifier.
     ///Change the element's style attribute using the
     // XML DOM. Please note that in contrast to the SVG DOM
     // function, the whole style attribute's value is changed and
     // not the value of a single contained CSS attribute.
     // DOES NOT WORK...
     var svgdesc = document.getElementById(obj_name);
     if (svgdesc != null)
          svgdesc.setAttribute("style", "background-color:yellow; cursor:hand");

     // Here is what we do for the IE 5 DHTML DOM
     // -----------------------------------------
     var DHTMLobj = document.all.item(obj_name)
     if (DHTMLobj != null)
          DHTMLobj.style.backgroundColor = "yellow";
     return true;
}

// When the mouse pointer triggers the mouse over event
// This function is called.
// We are using both the SVGDOM and the XML DOM
// to access the document's tree nodes.
// More particularly, this function change elements
// identified by the id attribute.
// Note that to change a style attribute with the SVG DOM does not
// require to know in advance the value of the style attribute.
// In contrast, with the XML DOM, you need to know the full content
// of the style attribute.
function on_mouse_out (ID)
{
     if (ID =  = item_selected)
          return true;

     var obj_name = ID ;

     // Change the SVG element's style
     // -------------------------------
     // 1 - get the SVGDOM document element from the Adobe SVG viewer
     // 2 - Then, get the element included in the SVG document and which is
     // referred by the identifier.
     // 3 - Finally, get the style attribute from the SVG DOM element node.
     // The getStyle function is particular to the SVG DOM.
     // The get style function returns a style object.
     // We change the 'fill' style attribute with the returned
     // style object. Note that in contrast to the XML DOM,
     // we do not need to know in advance the content of the
     // style attribute's value to change one of the CSS attribute.
     var svgdoc = document.figure.getSVGDocument();
     var svgobj = svgdoc.getElementById(obj_name);
     if (svgobj != null)
     {
          var svgStyle = svgobj.getStyle();
          svgStyle.setProperty ('fill', 'white'),
          svgStyle.setProperty ('stroke', 'white'),
     }

     // Here is what we should have if the target browser
     // would fully support the XML DOM
     // --------------------------------------------------
     // Get the element included in this HTML document (see in the body
     // section) and which is referred by the identifier.
     ///Change the element's style attribute using the
     // XML DOM. Please note that in contrast to the SVG DOM
     // function, the whole style attribute's value is changed and
     // not the value of a single contained CSS attribute.
     // DOES NOT WORK...
     var svgdesc = document.getElementById(obj_name);
     if (svgdesc != null)
          svgdesc.setAttribute("style", "background-color:white;");

     // Here is what we do for the IE 5 DHTML DOM
     // --------------------------------------
     var DHTMLobj = document.all.item(obj_name)
     if (DHTMLobj != null)
          DHTMLobj.style.backgroundColor = "white";

     return true;
}

function on_mouse_click(ID)
{
     var obj_name = ID ;

     // reset the color of the previously selected room
     if (item_selected)
     {
          var svgdoc = document.figure.getSVGDocument();
          var svgobj = svgdoc.getElementById(obj_name);
          if (svgobj != null)
          {
               var svgStyle = svgobj.getStyle();
               svgStyle.setProperty ('fill', 'white'),
          }
          var DHTMLobj = document.all.item(obj_name)
          if (DHTMLobj != null)
          {
               DHTMLobj.style.backgroundColor = "white";
               DHTMLobj.style.fontWeight  = "normal";
          }
     }
     // Now select the new room
     if (item_selected != ID)
     {
          var svgdoc = document.figure.getSVGDocument();
          var svgobj = svgdoc.getElementById(obj_name);
          if (svgobj != null)
          {
               var svgStyle = svgobj.getStyle();
               svgStyle.setProperty ('fill', '#C0C0C0'),
          }
          var DHTMLobj = document.all.item(obj_name)
          if (DHTMLobj != null)
          {
               DHTMLobj.style.backgroundColor = "#C0C0C0";
               DHTMLobj.style.fontWeight  = "bolder";
          }
          item_selected = ID;
     }
     else
          item_selected = null;


     return true;
}
]]></script>
</head>

<body>
     <xsl:apply-templates/>
</body>
</html>
</xsl:template>

<xsl:template match="Layout">
     <div align="center">
          <embed name="figure" width="540" height="540" type="image/svg"
          pluginspage="http://www.adobe.com/svg/viewer/install/">
          <xsl:attribute name="src"><xsl:value-of select="@figure"/></xsl:attribute>
          </embed>
     </div>
     <table border="0" cellpadding="1" cellspacing="0" width="100%" bgcolor="black">
     <tr>
          <table border="0" cellpadding="5" cellspacing="0" width="100%"
          bgcolor="white">
               <tr style="background-color:#990033; color:white;">
                    <td>Room</td>
                    <td align="right">Length</td>
                    <td align="right">Width</td>
                    <td align="right">Windows</td>
                    <td>Miscelaneous</td>
               </tr>
               <xsl:apply-templates/>
          </table>
     </tr>
</table>
</xsl:template>

<xsl:template match="Room">
    <tr id="{@id}" style="'background-color:white;'"
        onmouseover="on_mouse_over('{@id}')"
        onmouseout="on_mouse_out('{@id}')"
        onclick="on_mouse_click('{@id}')">
     <td><xsl:value-of select="Name"/></td>
     <td align="right"><xsl:value-of select="Length"/></td>
     <td align="right"><xsl:value-of select="Width"/></td>
     <td align="right"><xsl:value-of select="Windows"/></td>
     <td><xsl:value-of select="Misc"/></td>
    </tr>
</xsl:template>

<xsl:template match="text()"/>

</xsl:stylesheet>
Discussion
Prior examples focused on generating SVG from XML, while this one focuses on integrating SVG into a larger application based on other web technologies. This recipe only touches on the potential of such applications. SVG contains facilities for animation and dynamic content that, when coupled with XSLT’s transformation capabilities, can lead to some impressive results. Consider the following stylesheet that is based on the graph-drawing primitives of Recipe 11.2, but allows the user to interact with the graph:
<?xml version="1.0" encoding="UTF-8"?>
<xsl:stylesheet version="1.0"
  xmlns:svg="http://www.w3.org/2000/svg"
  xmlns:xsl="http://www.w3.org/1999/XSL/Transform"
  xmlns:svgu="http://www.ora.com/XSLTCookbook/ns/svg-utils"
  xmlns:test="http://www.ora.com/XSLTCookbook/ns/test"
  exclude-result-prefixes="svgu test">

<xsl:import href="svg-utils.xslt"/>

<xsl:output method="html"/>

<test:data>1.0</test:data>
<test:data>2.0</test:data>
<test:data>3.0</test:data>
<test:data>4.0</test:data>
<test:data>5.0</test:data>
<test:data>13.0</test:data>
<test:data>2.7</test:data>
<test:data>13.9</test:data>
<test:data>22.0</test:data>
<test:data>8.5</test:data>

<xsl:template match="/">
<html>
  <head>
    <title>Interactive Bar Chart</title>
    <object id="AdobeSVG"
      classid="clsid:78156a80-c6a1-4bbf-8e6a-3cd390eeb4e2"/>
    <xsl:processing-instruction name="import">
      <xsl:text>namespace="svg" implementation="#AdobeSVG"</xsl:text>
    </xsl:processing-instruction>
<script><![CDATA[

function on_change (ID,VALUE)
{
    //Get the svg doc
     var svgDocument = document.all.item('figure').getSVGDocument();

     //The bars id is prefixed with the context value + _bar_ + ID
     var barName = "interact_bar_" + ID ;

     var barObj = svgDocument.getElementById(barName);
     if (barObj != null)
     {
       barObj.setAttribute('y2', VALUE);
     }

     return true;
}

]]></script>
  </head>
  <body>
    <div align="center">
      <svg:svg width="400" height="400" id="figure">
        <xsl:call-template name="svgu:bars">
          <xsl:with-param name="data" select="document('')/*/test:data"/>
          <xsl:with-param name="width" select=" '300' "/>
          <xsl:with-param name="height" select=" '350' "/>
          <xsl:with-param name="offsetX" select=" '50' "/>
          <xsl:with-param name="offsetY" select=" '25' "/>
          <xsl:with-param name="boundingBox" select="1"/>
          <xsl:with-param name="max" select="25"/>
          <xsl:with-param name="context" select=" 'interact' "/>
        </xsl:call-template>
      </svg:svg>
    </div>
    <table border="1" cellspacing="1" cellpadding="1">
      <tbody>
        <xsl:for-each select="document('')/*/test:data">
          <xsl:variable name="pos" select="position()"/>
          <xsl:variable name="last" select="last()"/>
          <tr>
            <td>Bar <xsl:value-of select="$pos"/></td>
            <td>
              <input type="text">
                <xsl:attribute name="value">
                  <xsl:value-of select="."/>
                </xsl:attribute>
                <xsl:attribute name="onchange">
                  <xsl:text>on_change(</xsl:text>
                  <!-- Bars oriented upward are rotated so the ids need
                  <!-- to be reversed. See svgu:bars implementation -->
                  <!-- for clarification. -->
                  <xsl:value-of select="$last - $pos + 1"/>
                  <xsl:text>, this.value)</xsl:text>
                </xsl:attribute>
              </input>
              </td>
          </tr>
        </xsl:for-each>
      </tbody>
    </table>
  </body>
</html>
</xsl:template>

</xsl:stylesheet>
This stylesheet results is a web page that allows you to change data while the height of the bars responds in kind. This stylesheet also demonstrates the technique for inlining SVG content in HTML. Unfortunately, it works only with IE 5.5 or higher browsers and assumes that you use the Adobe SVG plug-in.[3]
See Also
Didier Martin’s XML.com article Integration by Parts: XSLT, XLink and SVG (http://www.xml.com/lpt/a/2000/03/22/style/index.html) contains a more compelling example involving interaction with a CAD diagram of a complex part.
J. David Eisenberg’s SVG Essentials (O’Reilly, 2002) contains detailed information about SVG animation and scripting.
Developers who know Java and want to do some serious SVG development should check out Apache Batik (http://xml.apache.org/batik/).
[1] If you want to annoy an anal-retentive boss, you can generate a bar chart with an orientation of 72 degrees. Better still, plot the data using an orientation of 1 degree and get your colleagues to swear it looks perfectly straight to them!
[2] Actually, you need to divide by the number of nodes + 1, lest you have a so-called “fencepost” error.
[3] This, of course, is the configuration used by a large segment of the modern world. A future version of Firefox (possibly 1.1) will have native SVG support.