
11. I/O: Measurement and Tools
Measuring I/O is even harder than measuring memory consumption. Most of the time, interesting events will be those where nothing is happening; the system is simply waiting for some external event such as the hard disk head moving to the right location. In addition, the whole operating system is designed purposely to make I/O measurement nonrepeatable—er, I mean, to optimize I/O, with lots of global shared state such as caches and disk layout. Even worse, while there are techniques for controlling these variables, they usually also lead to nonrepresentative measurements because the optimizations are absolutely necessary for normal operations.
To illustrate, we will use the short program from Example 11.1 that just reads a file into NSData and then computes a checksum of the bytes in the file.
Example 11.1 datamapping test program: reads a file and computes an xor-checksum
#import <Foundation/Foundation.h>
int main(int argc, char *argv[] ) {
NSURL *url=[NSURL fileURLWithPath:@(argv[1])];
NSData *d=[NSData dataWithContentsOfURL:url options:0 error:nil];
char result=0;
const char *bytes=[d bytes];
const char *end=bytes+[d length];
for (const char *cur=bytes; cur < end; cur++ ) {
result ^= *cur;
}
printf("result: \%x
",result);
}
Example 11.1 does a computation on the file contents and prints out those results to make sure data is actually read and the printf ensures the compiler can’t just optimize the computation away as dead code.
Negative Space: top and time
Our friends time and top are useful in detecting that I/O is happening and blocking our process, though mostly by using the concept of negative space: if we notice time that is not accounted for otherwise, or CPU utilization significantly below 100%, there is a strong suspicion that I/O may be to blame. For example, running the command time ./datamapping test_file yields the result shown:
> time ./datamapping testfile_3gb
real 0m10.669s
user 0m0.305s
sys 0m1.613s
Note the large discrepancy between real and user time, with user time only being 0.3 s, but the actual real time being more than 10 s. The sys time only adds 1.6 s of kernel CPU time, for a total of just under 2 s of time using the CPU. The other 8 s are missing, meaning only about 20% CPU utilization and 80% idle time. This could have been other processes preempting this one, but because scheduling is usually fair it would have to have been several processes or one running at significant higher priority, for example, a real-time process. Another reason would have been that the process decided to de-schedule itself by using the sleep() system call or similar calls to wait for some specified amount of time.
The most likely explanation, especially in our case, is that the process was I/O bound, meaning it was synchronously waiting for an external device to perform some I/O—in this case, to deliver data.
Assuming you have enough memory for keeping the file in RAM, doing a second timing run of the program will yield the very different results shown below: it is much faster, and user and sys times add up almost exactly to the real time measured.
> time ./datamapping testfile_3gb
real 0m1.937s
user 0m0.305s
sys 0m1.613s
This is the result of the buffer cache we discussed in the last section. The entire file has been cached in memory, and instead of doing I/O from disk, the OS just copies the data from the buffer to the program, making repeatable I/O testing difficult.
The purge command empties the entire buffer cache and returns the system to roughly the same state it was in after a cold boot (from power-off). After a purge, the OS will be forced to read from disk again. The purge command’s effects are global and also cause changes to be written to disk, so expect significant degradation in system performance for a while. Also, wait for the system to settle and page in its basic necessities before performing your measurements.
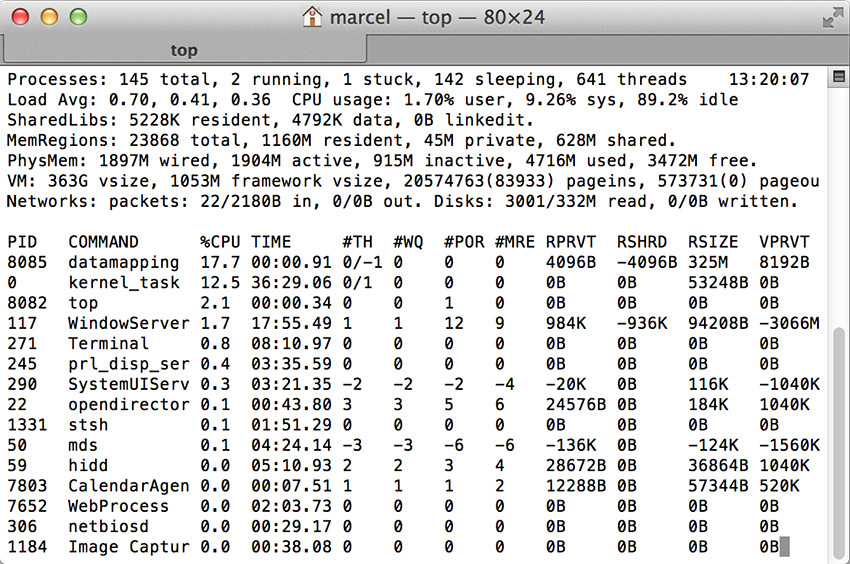
You can also see symptoms of an I/O bound process in the top screenshot Figure 11.1, with top showing the datamapping process at 17.7% CPU utilization. The top output also confirms that the reason is not CPU contention, because the CPU has over 80% idle time and there are no other processes that have high CPU usage statistics. Finally, top also has an indicator that I/O is taking place with the read and written fields in the statistics section.
Summary Information: iostat and netstat
Whereas with time and top, I/O activity was mostly detectable indirectly, the aptly named iostat command gives a direct measure of I/O activity. iostat gives summary information of I/O happening in the system, either as a snapshot or continuously if given a time interval on the command line.
The following is output during a run of the datamapping command.
> iostat 1
disk0 cpu load average
KB/t tps MB/s us sy id 1m 5m 15m
6.00 2 0.01 2 3 95 0.61 0.50 0.51
421.13 430 176.94 2 9 89 0.61 0.50 0.51
417.56 1104 450.26 1 15 84 0.61 0.50 0.51
426.35 1071 445.95 2 15 83 0.72 0.52 0.52
454.21 999 443.28 2 16 82 0.72 0.52 0.52
407.63 1038 413.29 2 14 84 0.72 0.52 0.52
422.73 1057 436.50 1 14 85 0.72 0.52 0.52
493.48 929 447.48 2 20 77 0.72 0.52 0.52
491.08 186 89.07 21 6 74 0.83 0.54 0.53
11.33 6 0.07 25 1 73 0.83 0.54 0.53
20.40 10 0.20 3 8 89 0.83 0.54 0.53
The first three columns display the I/O activity on disk0, in this case the built-in SSD of my MacBook Pro and the only disk attached to the system. I personally find the third column (MB/s) most relevant, most of the time. The first two just break this total number down into average kilobytes per transaction (KB/t) and transactions per second (tps), which can be useful if you are trying to determine if you are doing too many small and possibly random I/Os.
For this run, we see the system initially essentially idle (two transactions, total of 12 KB transferred). Once the datamapping program starts, we quickly ramp to 400 MB/s, the sequential transfer speed of the built-in SSD and finally drop down again once the program is done. The misalignment of the columns during the run shows the age of the program: the formatting didn’t anticipate transfer speeds going into the triple digits!
Although iostat paints with a very broad brush—it only provides summary information combining all I/O going to particular devices—I often find it not just useful to verify that what I think should be happening is in fact really happening, but also sufficient to see what is happening with a particular process if I manage to keep the rest of the system quiet enough.
The netstat command performs a very similar function as iostat when given a time interval on the command line, printing out aggregate network activity in bytes and packets for the specified interval, though it can also give much more detailed information.
Instruments
Needless to say, Instruments has tools to help us with I/O performance measurement. For example, we can use our trusty Time Profiler as shown in Figure 11.2.
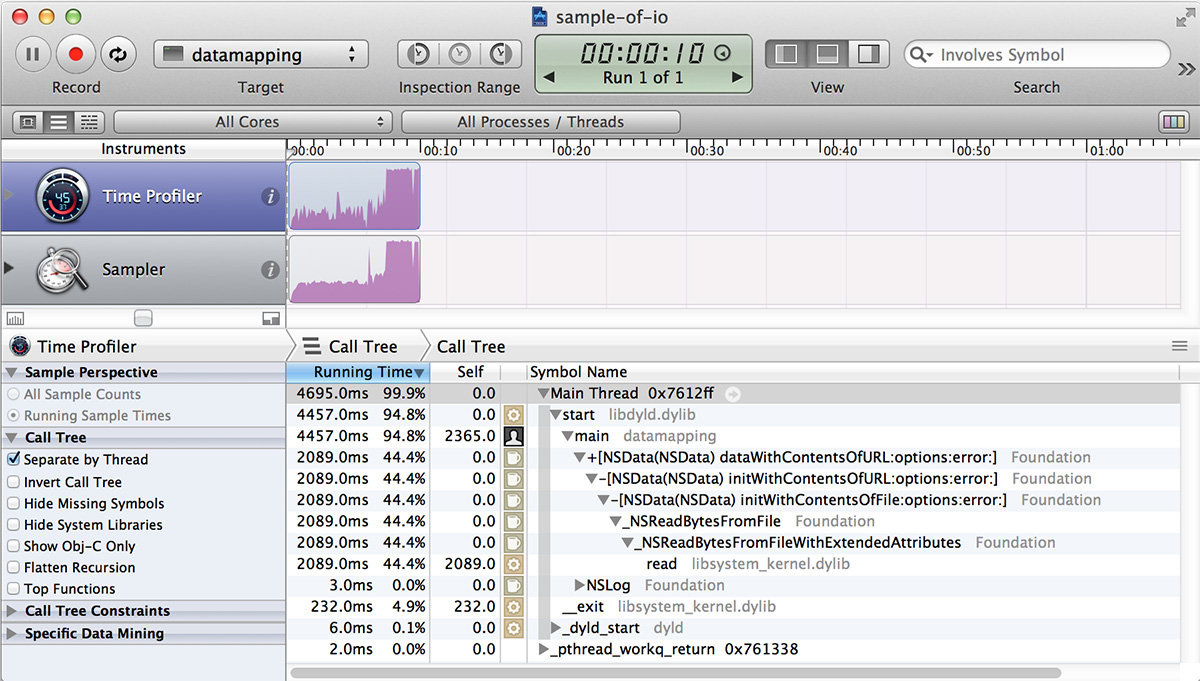
One thing to notice is that CPU utilization shown in the graph is only at 100% near the end; in the first part of the graph, it stays at much less than 100%. This is another example of the negative space we discussed earlier: the fact that we have less than 100% utilization indicates that the program is waiting for something—in this case, reading data from disk using Unix I/O, which despite reading from an SSD at around 400 MB/s does keep the CPU waiting for most of the time. After the I/O is done and everything is read into memory, utilization shoots up to around 100%.
However, if we look closely, we also notice a couple of problems. First, the times do not match: the graph shows 7 s of usage, but the tree view only accounts for 4.7 s. Second, the tree view claims that just 44% of the time is spent reading the file, but we both know and can see that it’s close to three-quarters of the time. The reason for this discrepancy is that the Time Profiler instrument by default only accounts for CPU time; it does not account for time waiting for I/O. In order to also account for time waiting for I/O, we need to check the Record Waiting Times checkbox in the inspector.
With the Record Waiting Times checkbox selected, we get a result like the one you can see in Figure 11.3.
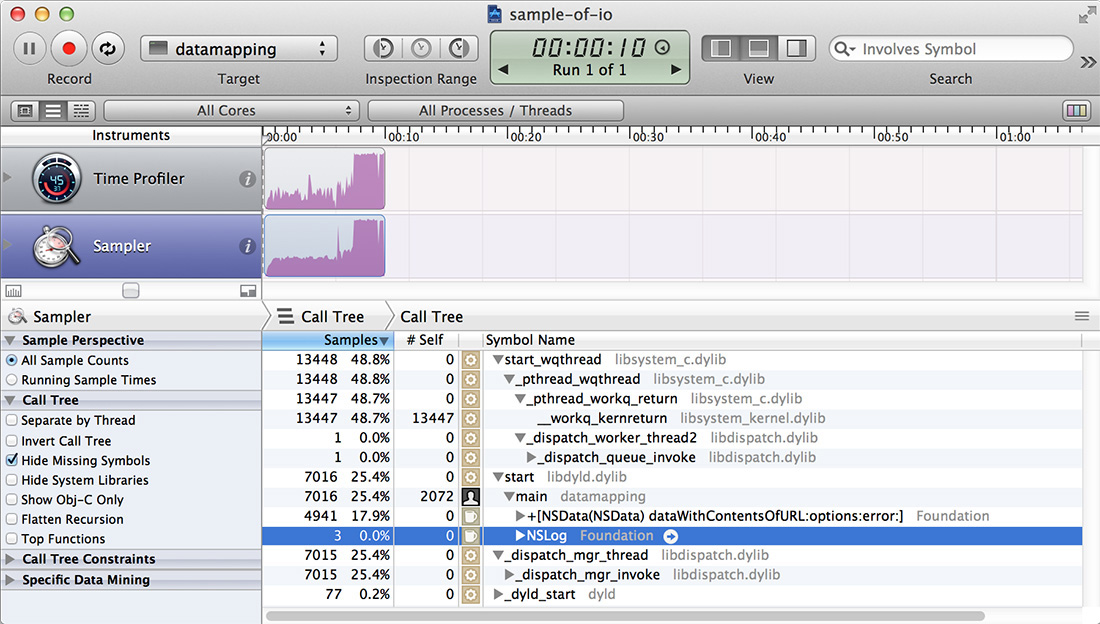
However, recording all time is also confusing: our main function, which we know is the only thing really doing work, is now shown as just taking slightly more than 25% of the time, with almost 50% taken by start_wqthread and its descendants, which bottom out at _workq_kernreturn, and another 25% in _dispatch_mgr_thread. What we are seeing are three helper threads that are sitting idle, but Instruments can’t tell the difference between idleness waiting for something we are interested in, such as the result of read(), and idleness due to being parked, so all threads that are around for the time of the process will show up with equal weight, and our total sample count will be threads × total − time.
Fortunately, we have data-mining tools that can help us, as illustrated in Figure 11.4.
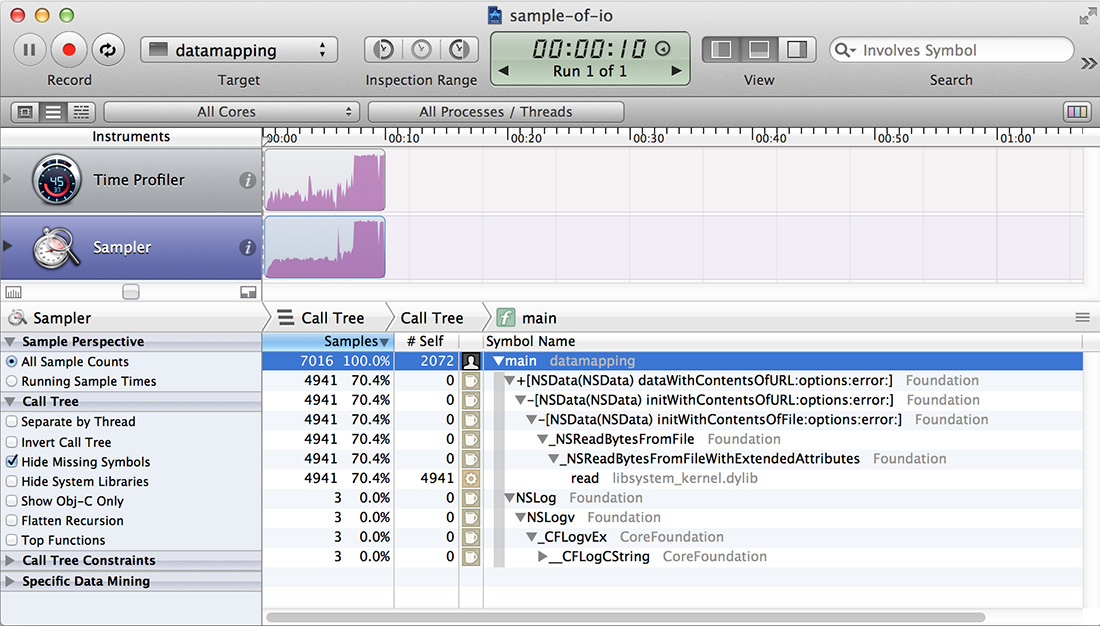
We need to focus on our main function, after which we get what we were looking for. Although we no longer get running time in milliseconds in the tree view, we do still get samples and were sampling at a rate of 1 per ms. The 7,000 odd samples we got correspond to the real time taken, and the read() is now shown as taking 70% of the total.
Note that the profile no longer directed us to the most important part of the program; we had to have that knowledge and use it to actually get at the information we need.
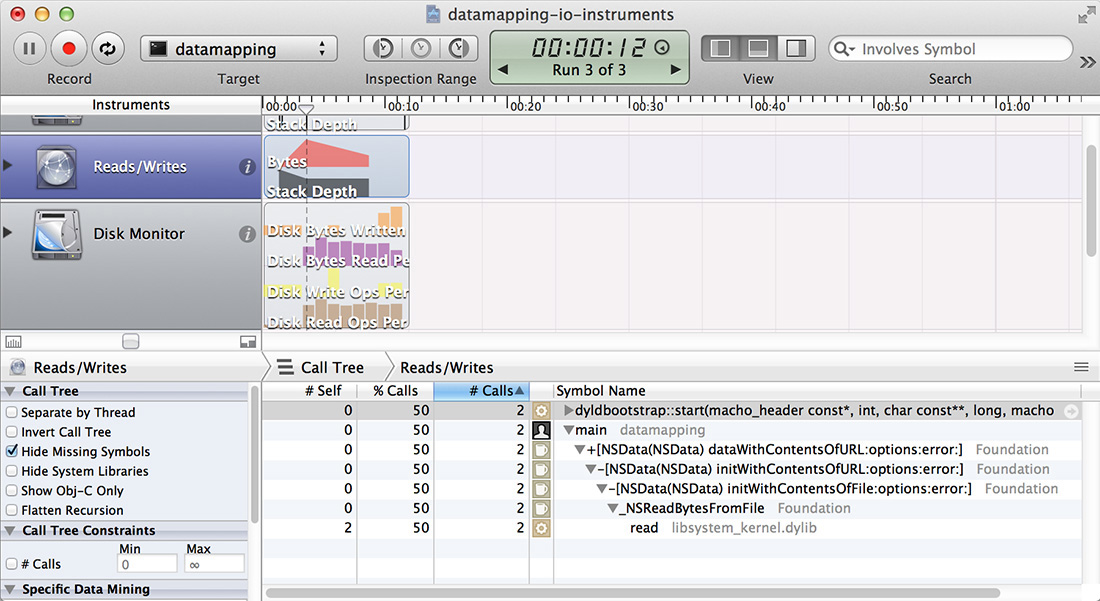
Although there are other, much more I/O-specific instruments available, I haven’t had much use for them. The basic command-line tools give me a better overview, the Sample instrument gives me a better overview of how I/O fits into the rest of the program, and fs_usage discussed in the next section gives me all the detail I would want. Figure 11.5 shows the Reads/Writes instrument. Although it does keep track of bytes read and written, it only graphs this information, allowing only a rough qualitative evaluation. The call graph only shows the number of calls, which is less useful.
Detailed Tracing: fs_usage
The fs_usage tool provides much more detailed information, recording effectively all I/O activity. Beware, though, that it is potentially a firehose, especially when output is not restricted. On my system just 6 s of fs_usage amounted to 1,255 lines of output, despite the system being ostensibly idle!
Data can be limited to certain types of output via the -f flag and to a specific process by adding the process name or process identifier on the command line. The output below shows monitoring the datamapping process using fs_usage:
> sudo fs_usage -f filesys datamapping
15:20:29 open . 0.000025 datamapping
15:20:29 fstat64 0.000005 datamapping
15:20:29 fcntl 0.000007 datamapping
15:20:29 stat64 ook/test-programs 0.000015 datamapping
15:20:29 PAGE_IN_FILE 0.000005 datamapping
15:20:29 open rams/testfile_3gb 0.000019 datamapping
15:20:29 fstat64 0.000004 datamapping
15:20:34 read 5.184634 W datamapping
15:20:36 read 5.025971 W datamapping
15:20:36 close 0.000010 datamapping
15:20:36 write 0.000012 datamapping
Each line of the output indicates a single I/O event. The first column is a timestamp, and the second column indicates the operation—for example, the system call (lstat64, open, read, close). The center portion has additional information if such information exists—for example, filenames. Following this is a number indicating the time the operation took, in seconds. The number of digits after the decimal is chosen so that the digits show microseconds (0.000025 seconds = 25 microseconds). If the process had to be scheduled out, the time is followed by the letter W, otherwise there is a blank. Scheduling out means that the process was no longer running. For example, actual I/O had to be performed because data was not in the cache, and the process was put to sleep until the I/O completed. Finally, the last column is the process name, which in this case is always datamapping.
With this in mind, we can interpret the trace in the output shown above. First, we see the program opening the current directory (open(".")), getting some information about it using fstat(), and later using stat() to get some more information about the current directory, this time using the full path. Cocoa does a lot of statting, so this is expected. After that, we get a page-fault serviced from a file that is mapped into memory, most likely part of the executable or a shared library (PAGE_IN_FILE). The open() call following the page-fault initiates access to the test file in question, testfile_3gb. fstat64() is most likely used to determine the size of the file, which is then read using two read() calls and closed. The two read() calls are the only ones that needed actual I/O, as indicated by the W after the time. They are also the only ones where the time field shows anything substantial, which isn’t a coincidence: calls serviced from memory (without the W) tend to finish in a few microseconds at most. The final write is our printf() that’s there so compiler doesn’t eliminate the xor-loop due to the result not being used.
When I ran this same test with less free memory (not enough to hold the complete file in memory at once), I saw a lot of additional entries between the read() calls and the close() call of type PAGE_IN_ANON, meaning swapping in data that isn’t backed by a user-defined file, but rather anonymous memory that is backed only by the swapfile. This meant that data was read from the data file, swapped to the swap file, and then paged back into memory from the swap file, which is somewhat insane but can happen when using Unix I/O. The page-out events corresponding to the page-ins observed do not show up when looking at a particular process because paging to disk is handled by the kernel task. It does show up in a global trace.
One caveat of specifying a process to monitor is that fs_usage expects the process to already exist and will terminate with an error message if it doesn’t. There is no equivalent of sample’s -wait flag that will wait for such a process to come into existence. If that is a problem, an alternative is to keep the fs_usage itself unconstrained (global) and filter the output using grep: sudo fs_usage -e | grep datamapping. The output is shown here:
14:32:42 open . 0.000012 datamapping
14:32:42 fstat64 0.000003 datamapping
14:32:42 fcntl 0.000005 datamapping
14:32:42 close 0.000005 datamapping
14:32:42 stat64 ../test-programs 0.000009 datamapping
14:32:42 PAGE_IN_FILE 0.000004 datamapping
14:32:42 PAGE_IN_FILE 0.000012 datamapping
14:32:42 PAGE_IN_FILE 0.000003 datamapping
14:32:42 PAGE_IN_FILE 0.000003 datamapping
14:32:42 open ../testfile_3gb 0.000016 datamapping
14:32:42 fstat64 0.000003 datamapping
14:32:42 RdData[A] 0.000868 W datamapping
14:32:42 RdData[A] 0.000826 W datamapping
14:32:42 RdData[A] 0.000366 W datamapping
14:32:42 RdData[A] 0.000722 W datamapping
14:32:42 RdData[A] 0.000791 W datamapping
14:32:42 RdData[A] 0.000954 W datamapping
14:32:42 RdData[A] 0.000470 W datamapping
...
This approach to filtering generates significantly more output: we see many lower-level RdData[A] events. A lot more: I got around 13K lines of output. It helps to redirect to a file! My current understanding is that the lower-level events are part of the kernel event stream and therefore do not show up when filtering directly by process.
The fs_usage command is very versatile. For example, I was also able to confirm that the job that used to be done by the update daemon (calling sync() every 30 s) is now performed by launchd instead, as the following output shows. As of version 10.8.3, the sync(2) man page still refers to update(8), despite that man page having been removed.
> sudo fs_usage -f launchd | grep sync
12:08:44 sync 0.051223 W launchd
12:09:14 sync 0.057016 W launchd
12:09:44 sync 0.055366 W launchd
12:10:14 sync 0.062487 W launchd
12:10:44 sync 0.049468 W launchd
12:11:14 sync 0.057325 W launchd
Apart from being a firehose, another drawback of fs_usage is that it is flat. There is no call graph, so correlating activity and doing data mining can be arduous. An instrument with the capabilities of fs_usage would be really useful.
Summary
This chapter introduced some of the major tools for measuring I/O performance. Unlike CPU and memory tools, however, they tend to not be enough to pinpoint exact locations of I/O performance problems, never mind root causes. Fortunately, they don’t have to; all we need is evidence that I/O is causing problems and enough information to form a usable working hypothesis.
With a working hypothesis, we can create an experiment (i.e., make a code change) and then verify or reject the hypothesis by measuring the running time of the modified program. Rinse and repeat. We will see that method in action in the next chapter.