Application Insights is an extensible Application Performance Management (APM) service for web developers on multiple platforms to monitor web applications for performance, usability, and availability. It automatically detects performance issues. It includes powerful analytics tools to help us diagnose issues and to understand what users actually do with our app. How cool is that? We can find out about the most and least used features of our web app using Application Insights. We can use the actionable insights from Application Insights to continuously improve the performance and usability of the app. I have personally found Application Insights very useful in diagnosing and fixing performance issues. This is a proactive way of identifying the issue, rather than waiting for the end user to experience an issue and then reporting it. Let's start with enabling Application Insights in our movie booking web app. To do so, we need to do the following:
- In Visual Studio 2017 Solution Explorer, expand the MovieBooking project and click on Connected Services. This will display the Connected Services page, as shown in the following screenshot:

- Click on Monitoring with Application Insights. This will open the Application Insights configuration screen, as shown in the following screenshot:

This same screen can be reached by right-clicking on the MovieBooking project in Solution Explorer and then clicking Add | Application Insights Telemetry, as shown in the following screenshot:

- Click on the Start Free button. This will take us to the registration screen, shown in the following screenshot. Choose the Subscription and Resource based on your requirements. Here, I have created a new resource but you may want to reuse an existing resource. We will go with the free variant, so choose the option in which Application Insights will remain free and halt data collection after the quota of 1 GB / Month is exhausted:

- Click on Register. This may take a while and hence show a progress bar, shown in the following screenshot. Look at the screenshot and we can see how powerful Application Insights is. It has Smart Detection, App Map, Analytics, and CodeLens, among other great features:

- Once the configuration is done, the progress bar will disappear. Application Insights telemetry should now be enabled in the selected project. The configuration will add the instrumentation key in appsettings.json as well and so, after successfully enabling Application Insights, you may get a prompt that the file has been modified. This is fine and expected, so click OK:

We are now ready to monitor the web app after publishing it to remain in sync with the instrumentation key changes and Application Insight SDK changes that we have just done. With this, we are done with setting up Application Insights. Now, we will see how we can monitor the web app and leverage the benefits of Application Insights. We can see the telemetry data of our local debugging setup in Visual Studio itself, while the Azure portal is where we can see the insights of our deployed application.
In the Visual Studio Solution Explorer, we will now have the Application Insights folder inside Connected Services for our movie booking project, as shown in the following screenshot:

Right-click on the Application Insights folder and we will get a number of options. A few of the important ones are shown in the following screenshot:

Here are the explanations of these options:
- Open Application Insights Portal: This will directly open Application Insights in the Azure web portal.
- Application Analytics: This will open the application analytics portal, where we can perform detailed analytics and filtering of data.
- Application Map: This will open the application map for the project in the Azure portal. The application map helps us to spot performance bottlenecks or failure hotspots across all components of the distributed application.
- Configure Application Insights: This can be used to configure Application Insights.
- Choose Telemetry Source: This configures the app that will be used as the telemetry source. By default, the current web app will be the telemetry source.
- Search Live Telemetry: This searches the data in the telemetry from Visual Studio or in the Azure web portal. Using this, we can also see debug telemetry data from the Visual Studio debugging.
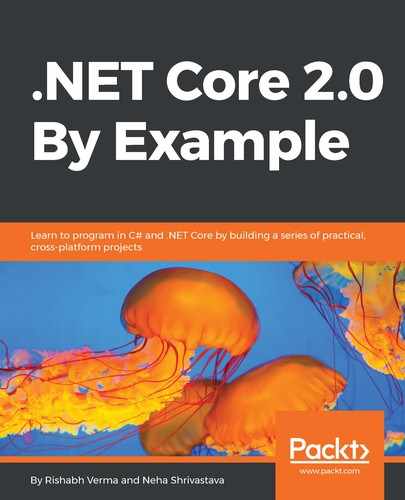
To conclude this discussion, let us see the Application Insights data that was collected while I wrote this section. The following screenshot shows what it looks like for the movie booking app that we developed:
Application Insights is a huge topic and one section of a chapter doesn't do justice to this great and important feature. For a thorough and detailed coverage Application Insights, I would highly recommend readers to read the wonderful documentation on Application Insights at https://docs.microsoft.com/en-us/azure/application-insights/.
In this section, we have looked at Application Insights, which is a great monitoring tool in the developer's repertoire. However, Azure has much more to offer in terms of monitoring options and we will explore these in the next chapter, where I will also discuss how to use Application Insights telemetry data to investigate issues. With this note, we conclude this chapter.