No one is going to share your message if it is not worth sharing. Not a novel idea—yet, marketers are spending a considerable amount of time thinking about the types of information or content they should post online. There is now recognition that the old outbound model of marketing—where marketers seek out consumers via cold calls and unsolicited advertisements—is not working. Consumers need to come to you (i.e., inbound marketing). However, you need something of substance to lure them in; good content embedded in a larger brand story. You also need to be a darn good storyteller.
This focus on delivering valuable content underlines the growing area of content marketing. Content marketing is defined by the Content Marketing Institute as “a strategic marketing approach focused on creating and distributing valuable, relevant, and consistent content to attract and retain a clearly-defined audience—and, ultimately, to drive profitable customer action” (Content Marketing Institute n.d.). Since 2011, interest in content marketing has steadily grown (Snow 2015). A cottage industry has been developed resulting in numerous dedicated software platforms designed to help you create, curate, optimize, analyze, and distribute digital assets (Lieb, Groopman, and Li 2014). In addition, there are also content-marketing conferences and the Content Marketing Institute dedicated to the topic. Content marketing is essential because it is not only the backbone of social media marketing but also search engine optimization (SEO) practices, inbound marketing, and e-mail marketing. Success is measured by web traffic, search engine rankings, brand awareness, lead generations, sale revenue, downloads, and engagement such as social media.
The Content Marketing Institute definition provides a procedural overview of content marketing, yet it misses the mark somewhat, in that, it neglects the heart and soul of content marketing—storytelling. For this, we turn to the content marketing tech agency Contently who defines content marketing as “the use of storytelling to build relationships with consumers by providing them something entertaining or useful” (Contently 2016). In truth, storytelling is only a part of the message communication process. In an analysis of blogs, researchers Kozinets et al. (2010) found that word-of-mouth marketing (WOMM) was influenced by “character narratives” (i.e., personal stories), the specific forum or message context, communal norms found within the forum (i.e., norms impacting communication message “expression, transmission, and reception”), and the marketing message and meaning (i.e., marketing promotional elements) (Kozinets et al. 2010). This chapter will explore each of these WOMM influences within the context of brand story development, message development, textual storytelling, and visual storytelling process. The chapter concludes with how to write a more persuasive story that will ultimately drive consumer action.
What Is Your Brand Story?
Storytelling is central to this chapter because WOMM is about sharing stories—stories that engage and excite consumers; stories that consumers consider valuable. Understanding the social consumer, their interests and passions, and preferences when it comes to media consumption is at the core of spinning a good, authentic tale. Social media brings with it a whole set of storytelling tools—the written word, pictures, video, and even virtual reality are all at our disposal. Social media also provides brands with easy ways to retell stories by allowing retweeting, sharing, and embedding to be so accessible.
Marketers who want to excel in social word of mouth (sWOM) marketing must think of themselves as storytellers and consumers not just as their audience but also as their coauthors. And, like any good storyteller, they need to tailor their story and manner of delivery for their audience. Marketers need to be able to both identify and cultivate storytellers from the consumer rank and acknowledge that they are “coproducers” of marketing communications (Kozinets et al. 2010). Consumers should be encouraged to share their experiences, and marketers should routinely select and profile key stories that are consistent with the overall brand narrative. In the end, the focus needs to be on telling before selling. So, how do you capture a consumer’s attention for them to not only view but share your content? What story will you share? How is your story going to be different from your competitors?
There are numerous examples of companies and individuals who have successfully embraced storytelling in their marketing efforts. Arguably, one of the best-known examples of applying storytelling in their marketing efforts is Red Bull. In fact, Red Bull’s marketing is so interwoven with content development that it can be thought of as a “publishing empire that also happens to sell a beverage” (O’Brien 2012). Red Bull’s content covers a variety of extreme sports and documents their sponsored events, individual athletes, and teams through a variety of social media platforms. All of these efforts are consistent with their lifestyle brand narrative of extreme action and sports. Red Bull further reinforces their story focus through the web series “Red Bull Storyteller.” These stories move away from extreme sports athletes and instead highlight “everyday” consumers encountering extreme situations (i.e., illness, ecology threats, NYC street hustle).
Another example of a company putting brand stories at the center of its marketing efforts is the Coca-Cola Company. In 2011, Coca-Cola began to focus on “content excellence.” The underlying theme of which was to create “contagious ideas” communicated through dynamic brand stories that would drive conversation online. Coca-Cola even changed its company website from a corporate presence to one more along the lines of a digital magazine—called “Coca-Cola Journey” (Elliot 2012). Coca-Cola’s overriding brand story is helping the world live positively. Ten years later, in 2021, Coca-Cola adjusted its story to embrace a new brand philosophy—Real Magic (Coca-Cola 2021a). Real magic is “when we come together in unexpected moments that elevate the everyday into the extraordinary” (Courie 2021). During the 2021 Christmas season, Coca-Cola spread this “real magic” by randomly sending customers a video via Cameo of the iconic Coca-Cola Santa video. They also allowed customers to sign up for personalized Santa messages that could notably be shared on social media (Coca-Cola 2021b). Lastly, TOMS shoes present a story about improving lives. Shifting away from its buy one, give one away model, TOMS now donates one-third of its profits. Specifically, they now provide grants to organizations that focus on supporting mental health, “increasing access to opportunities,” and preventing gun violence (Toms 2022).
So, Red Bull’s story is about extreme action infused with energy, Coca-Cola wants to bring to the world real magic, TOMS is improving lives—but what is your big brand story? The rules of writing and communicating your brand story are very similar to those contained in your local public library. You need good, relatable characters, an interesting and compelling story reinforced by supporting content, and a descriptive and effective way to executive it (Content Marketing Institute n.d.; Gunelius 2013). Social media, thankfully, has provided us with numerous platforms that make this process easier.
Keys to Successful Storytelling
There are six keys to successful storytelling: character, brand voice, “big” story brand idea, story arc, story execution, and coauthorship.
Later, in this chapter, we will discuss many strategies to help your message’s virality—but at a minimum, it is about good storytelling.
• Character: Whether it is an influencer, employee, or a profiled consumer, characters that convey your brand’s content should be someone that your buyer persona can relate to and finds credible. They can play a leading or supporting role in your story, but your consumer needs to develop an emotional connection with your character(s). Therefore, ensuring the message is ripe with information for character development (i.e., video or images) will increase the likelihood that the consumer will not only be engaged but also share the message.
• Brand voice: The voice of your brand—conveyed through text and visually oriented posts—must be consistent; consistent between posts and consistent with the brand image and story. Are the brand voice and subsequent language used informal or formal? Is the personality conveyed—fun, sarcastic, witty, stoic, and so on? Can consumers quickly pick up on personality characteristics (i.e., Intel’s voice is smart and enlightening; Taco Bell is a little wacky)? As we discussed in Chapter 3, it takes a lot of work to establish, achieve, and maintain a consistent brand voice.
• “Big” brand story idea: The story should be simple and get at the core of your brand’s identity. It may seek to explain why your company exists or delve into a problem that your product seeks to resolve. Ultimately, the big brand story must be appealing to your consumers—it must emotionally connect with them. It is hard to think of a more compelling brand story than TOMS shoes. Look to your company’s mission to help develop your brand story.
• Story arc: Brand stories are a collection of information or posts—not told in one sitting. However, posts must be consistent with the larger brand story. Also, like any good story, there should be hurdles and ways to overcome them delivered in regularly scheduled increments. The presented conflict should be something that relates to your consumer’s needs and stage in the purchasing cycle. A great example of a compelling story can be found in Red Bull’s Instagram highlights of Eileen Gui’s 2022 Olympic wins and experience.
• Story execution: Social media is the instrument of story delivery and also provides a framework for the types and methodology of how the stories are told. Stories can be short (e.g., TikTok) or complex (e.g., YouTube channel). They can also be told across multiple social media platforms. The key to selecting where to execute your story is both understanding which social media platforms your consumers are using and knowing the type of content or story they want and expect to be told within a specific network. For example, the content on Pinterest tends to be more “home-orientated” (i.e., food and so on) (Moon 2014; Libert 2014).
• Coauthorship (with consumers): Lastly, it is essential to remember that brand stories are not just the product of orchestrated marketing campaigns born out of corporate boardrooms—they are cocreated with consumers. Consumers are routinely sharing their brand stories, and experiences with the product. Messages on social media related to products are stories—tales of consumers’ experiences and connections with the product that are positive, negative, and neutral. Brands must nurture and encourage their consumers to tell their stories.
Story Content and Making It Contagious
So, how will you tell your story on social media? As mentioned, your individual posts must reinforce your brand story, but above all, they must be interesting and valuable to consumers. This is especially true if you want consumers to share your story. However, simply getting a consumer to view or read your post does not guarantee its virality. Let’s face it; the vast majority of posted content within social media is simply not shared with others. In fact, most fans of branded pages do not even see the Facebook posts in their newsfeed, let alone “like” or “share” them. So, what should you do? The answer to not only getting exposure on platforms like Facebook but also getting users to share, retweet, and repin comes down to one simple truth: you must provide content that your consumers value.
Value, much like beauty, is in the eye of the beholder. And, it will also vary from consumer group to consumer group. Fortunately, research examining virality and word-of-mouth (WOM) communication provides us with some tools to increase the likelihood of creating shareable content. Jonah Berger, Wharton Professor and author of Contagious, identified six principles (STEPPS) that drive WOM: Social Currency, Triggers, Emotion, Public, Practical Value, and Stories (Berger 2013). We will briefly explore each of these principles as they relate to social media content. We have chosen to vary the order provided in his STEPPS acronym and discuss emotion last—given its importance in the academic literature.
• Social currency: We care deeply concerned how we appear to other people. And, social media affords us the ability to craft, in some cases, a new and improved digital identity. Consumers, therefore, seek out and share interesting information that is consistent with their desired self. They want to stand out and look good in the eyes of their peers. This can also explain the sharing success of social media posts that include “quotes” (Zarrella 2013b). As a marketer, you need to think about the types of information that consumers will want to share to look “good” and also how to put a spotlight on consumers. This may mean rewarding or simply acknowledging consumers who actively post their product reviews or get the most views on social media. You can also give certain consumers the “inside track” on new product-related information. At a minimum, you should highlight what makes your product or rather your product benefits interesting to consumers.
• Triggers: The secret behind triggers is getting your content to be “top-of-mind.” In other words, people will readily be prompted to think about the content (and then share it). Use specific events (i.e., holidays or big news events), activities (i.e., vacation time), or obstacles (i.e., the morning rush out the door with your children) that your target consumer encounters and align them with your content. Think—Star Wars “may the force be with you” aligned with May 4 “May the fourth be with you.” Also, make sure you time messages to when these events and obstacles occur.
• Public: Make something stand out so that people can identify it and imitate it. While this suggestion was made about creating a highly visible product (i.e., silver-colored Apple computers that contain a backlit apple versus the typical black laptops), it is also relevant in the context of social media. To illustrate, make your content more visible by simply creating a post that contains a photo, video, animated GIF, or cinemagraph. Increasing its visibility allows it to be more easily noticed and shared (more on this later). You can also create a branded sound that begins or ends each of your videos. Think about the very beginning of TED talk videos—the distinctive sound of chimes, a water drop, and then drums (can you hear it?). Another idea is to always include identifiers on your branded content to quickly and readily assign its ownership to you. This can be easily accomplished by putting a small logo at the corner of a post or video.
• Practical value: Many of us simply enjoy useful information and want to spread its value to others. It should come as no surprise that some of the most valuable content is, in fact, instructive and educational posts. Leading Marketing Solution Providers 2015, for example, an analysis of BuzzSumo (they keep track of popular social media posts) articles found that longer posts (2000+ words) are shared more often than shorter posts. Furthermore, infographics and lists outperformed videos when it came to sharing (Kagan 2017). When analyzing retweets, Quicksprout found that tweets linked to “how-to” and “list-based” articles performed well with retweets (Quicksprout 2021). So, the question is—What does your target consumer consider valuable and how can you simply convey this information? Lists, videos, infographics, how-to guides, and frequently asked questions are a good place to start.
• Stories: Up to this point, we have discussed the broad brand story, but within this larger context, there are smaller stories, individual consumer, or employee stories that work to support the bigger story theme. Take, for example, the storied posts on Redbull’s dedicated racing Instagram page. Within it, numerous posts highlight Formula 1 Racing 2021 World Champion Max Verstappen. In fact, they even have a dedicated story highlight reel that celebrates his win, the reaction from his support crew, and fan reaction watching in the Netherlands (where he is from).
• Emotions: Content that conveys emotion readily goes viral. Yet, all emotions are not created equally. Emotions that are high in arousal (e.g., anger and awe) tend to have higher rates of sharing. Whereas, low-arousal emotions (e.g., sadness) do not inspire as much sharing—no one wants to feel or responsible for making others feel miserable. Research suggests that just having a more emotional headline for your content can lead to a higher share rate (Moon 2014). There is a free analyzer tool, the emotional marketing value headline analyzer, that will rate the emotional impact of your headline (Advanced Marketing Institute 2009). A message’s overall associated emotion and the general valence of a message—positive, negative, and neutral—have garnered a lot of research in the academic literature. As such, we provide further elaboration of both message valence and emotional arousal in the next section.
Message Valence and Emotional Arousal
Academics and industry frequently look at WOM messages from a valence or sentiment perspective. In other words, is the information or comment positive, negative, or neutral? While marketers can certainly communicate positive, negative, or neutral information, most often discussions about sentiment relate more to product-related consumer comments and reactions and their consequences. Traditional WOM research has found negative WOM to be more influential on both brand evaluations and on purchase intentions (Bone 1995; Richins 1983; Brown and Reingen 1987). The same has been found for eWOM communications—negative eWOM significantly impacts experiential and more sensory-dependent type goods (Park and Lee 2009). For better or worse, social media allows for the rapid diffusion of negative sWOM information. This dissemination of negative information within social media differs from other WOM and eWOM in its speed and volume, ability to weigh into the conversation in simplistic terms (“like” or retweet), the “echo chamber” of social media (i.e., when consumers are not exposed to new ideas within your network, instead existing ideas are amplified through repetitive postings), the amount of information, and cross-media dynamics (i.e., blurring of online and offline media) (Pfeffer, Zorbach, and Carley 2014). Negative sWOM can be particularly detrimental if it originates with key social influencers such as “hubs” and “bridges” (Stich, Golla, and Nanopoulos 2014). This can be incredibly harmful to a business (“Pink Slime Case Study”).
Texas mom Bettina Elias Siegel ignited a social media firestorm that destroyed a business. Siegel was on a mission to improve the quality of school lunches. She was concerned with the widespread use of a product known as Lean Finely Textured Beef (LFTB)—lean beef that has been extracted from the fat trimmings, a staple of the fast-food industry commonly found in burgers, tacos, and school lunches. Whereas the name LFTB sounds harmless enough, the product because of its color and texture acquired the unappetizing moniker, “Pink Slim.” Siegel turned to her blog, The Lunch Tray, to express her disgust and outrage, calling on lawmakers to ban the product from the federal school lunch program. Within eight days of her posting, more than 200,000 concerned parents had signed an online petition. Siegel’s beef (pun intended) spreads like wildfire and was picked up by ABC news. In response, supermarkets abandoned the product, and fast-food chains, such as Wendy’s, felt the need to reassure consumers—Wendy’s took out a series of newspaper advertisements to assure consumers that they have never used the product. Beef Products Inc. (BPI), the producer of “Pink Slime,” suffered irreversible financial losses and was forced to suspend operations in three of its four plants. AFA Foods, a meat processing company, declared bankruptcy and U.S. sales of ground beef hit a ten-year low. (ElBoghdady 2012)
Negative posts can also be incredibly harmful to social systems—such as politics. An analysis was conducted of approximately 2.7 million Facebook posts and Twitter tweets drawn for the accounts of politicians and media outlets from the United States. The study found that posts criticizing or mocking the “political outgroup” (i.e., opposing party) were shared twice as many times as positive posts from their own party. These findings also extended to emojis (i.e., more “angry face emojis” on political rival posts versus “heart-shaped” emojis on favored candidates). No effect differences were found between Facebook and Twitter (Lewsey n.d.)
Industry and academic research reveal that there are differences in how users of various social media platforms respond to positive, negative, or neutral sentiments. In a study using simulated Pinterest boards, consumers paid more attention to negative sWOM than positive or neutral (Daugherty and Hoffman 2014). An analysis of Facebook posts revealed that neutral posts received fewer likes than positive or negative posts, whereas very negative posts received more comments (Murphy 2012). Finally, Buzzsumo and Fractl conducted an industry study that examined the sharing of one million articles across five different social media platforms and found that some users on platforms had sentiment preferences. Specifically, users on LinkedIn and Pinterest tended to share more positive stories, whereas Facebook shared the most negative among the five platforms reviewed. Twitter and Google+ had the “most balanced range of sentiments” (Libert 2014).
Should we simply view social media posts as positive, negative, or neutral? What about specific emotions and their strength? What role do they play in virality? The strength of the emotion—or emotional arousal—is what leads people to take action or share the message. To be more specific, high emotional arousal content that generates awe, excitement, or humor performs well. In addition, even negative high-arousal emotions such as anger or anxiety are very shareable (Berger 2013). However, emotions that do not elicit high arousal, such as general sadness and contentment, are not viral. An examination of the most frequently e-mailed New York Times articles found that articles that instilled a sense of awe defined as “emotion of self-transcendence, a feeling of admiration and elevation the face of something greater than the self” performed the best (Tierney 2010). Positive content was shared more often than negative content (Berger and Milkman 2011). These findings were reinforced in a separate study that looked at viral videos—high-arousal, positive valence specifically those that inspired the emotion of exhilaration—were shared the most frequently (Nelson-Field, Riebe, and Sharp 2013). In contrast, a study that addressed emoticons use within the Chinese social media platform Weibo found that rage was more viral than joy, sadness, or disgust (Shaer 2014). While the studies contained different conclusions, the importance of high-arousal emotions in sharing remained the same. Furthermore, it may be wise to stay away from negative high-arousal emotions as we do not yet understand the long-term effects it would have on a brand (Nelson-Field, Riebe, and Sharp 2013).
The problem for companies is, of course, how do you create content that arouses our sense of awe, humor, anger, excitement, or anxiety enough to get shared? The answer lies at least, in part, in selecting an appropriate creative strategy.
Creative strategies can be thought of as “executional factors and message strategies used to bridge the gap between what the marketer wants to say and what the consumer needs to hear” (Ashley and Tuten 2015,
18). Some different typologies of traditional media have been developed (Laskey, Day, and Crask 1989; Aaker and Norris 1982). But, how do they relate to social media? In a review of the social media content posted on 28 popular consumer brands across multiple social media platforms, researchers Ashley and Tuten (2015) identified the most popular message strategies (see Figure 4.1 for an overview). They found a variety of creative strategies were being used; the most popular of which was a functional appeal. A functional appeal demonstrates the utility of a product. Despite its popular use, functional appeal approaches were not related to the levels of engagement, social influence, or the number of Facebook fans or Twitter followers.
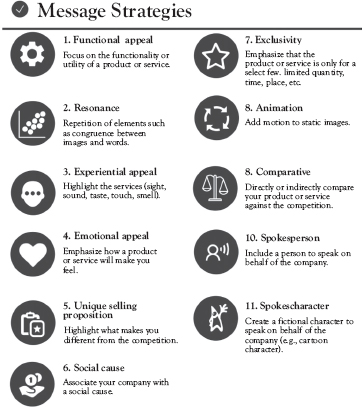
Figure 4.1 Creative message strategies
Ashley and Tuten (2015) also found that brands attempted to engage with consumers by inviting them to share some content, and half of the brands studied encouraged sharing by providing incentives. The results found that there was a significant relationship between the incentive to share content and the number of people following a brand, Facebook fans, social influence score (i.e., Klout), and engagement scores. Contests that offered consumers the chance to win a prize were twice as popular as discounts (Ashley and Tuten 2015). Outside of identifying a variety of appeals and illustrating which appeals are more successful in driving consumer action, these findings highlight an important truth: Do not focus on selling within social media. As the poor performance on the functional appeal illustrates, content posted on social media cannot be solely about your product. Instead, engage with your consumers, provide value, and focus on appeals that include text and images, and emotion, which engages the senses and associates your company with a cause.
Textual Storytelling
Now that you have figured out your brand story and the general content of your story, you need to decide how to execute it. For better or worse, you need to adjust your writing style to conform to the ever-evolving social media lexicon and technology platforms. There are also some other considerations that you need to make if you want to increase the likelihood of your posts being shared.
Length
If you want to increase shareability, in some cases, shorter is better. For example, Buzzsumo found that Facebook posts with 0 to 50 characters had, on average, the highest levels of engagement (Hutchinson 2019). While you can post a long Instagram caption (up to 2,200 characters), the platform truncates them to 125 characters. Like Facebook, posts with 50 characters or less receive more interactions (Quintly 2019). See a trend? Twitter, however, proves to be the exception. In 2017, Twitter increased its character count limit to 280. Longer tweets in this “expanded range” typically see higher levels of engagement (Gessler 2020).
Acronyms
Acronyms—immigrants from texting language—have become an integral part of the social space. Marketers have a vast number of acronyms at their disposal, and they can be an effective and fun way to communicate with your consumers (Figure 4.2). There are also commonly used Acronyms used in B2B social media communications (e.g., CPC—Cost per Click; CTA—Call to Action; SMB—Small- and Mid-Size/Medium Businesses) (Zote 2020). While most of the acronyms are familiar and self-explanatory (e.g., OMG, LOL, DM), some are a little more complicated. Take, for instance, BAE (Before Anyone Else), which can mean a close friend, or a person’s spouse, girlfriend, partner, or FBO (Facebook Official), which marks a life event change that you are making public.

Before you jump on the acronym bandwagon, you need to understand whether using particular acronyms is consistent with your brand voice, and are these acronyms used by your target market. Chances are your target market actively uses only a small number of the acronyms, or they have developed new terms unique to their cohort. According to Askfm (a popular youth-driven social networking site), teens readily use a host of novel acronyms to capture their zeitgeist (TBR = to be rude; SMH = shaking my head; IDEK = I don’t even know; OOTD = outfit of the day) (Askfm 2022). There is some evidence that using an acronym can make your social media post less sharable. This has been found to be true with “LOL” (Zarrella 2009). And, when comparing the use of RT versus actually spelling out “retweet” or “please retweet,” the full-length version comes out on top.
Word Choice
It is not just what you say, but how you say it! Word choice and phrases can dramatically impact whether a post is shared.
Strong copy (and the interesting ideas behind them) is mandatory. This means that word choice needs to follow the 4Cs of copywriting: clear, concise, compelling, and credible (Bly 2013). Writing to be understood by your target market is a given. This means that you need to select words at the vocabulary level of your intended audience (e.g., no advanced GRE/LSAT words for most folks) and be to the point. As a general rule, select your words carefully, avoid rambling, and if appropriate, list items (with or without emojis). Be interesting when you write and make it relevant and entertaining to your reader. Consumers need to feel like they are authentically communicating with the brand. In other words, are the words consistent with the brand voice?
Outside of general word-related guidance, copywriting gurus also rely on what is referred to as “power words.” Power words provoke a psychological response because both persuasive and can trigger an emotional response. Ultimately, they can nudge people to take action. In truth, the power word list is long (just Google it); however, here is a small selection organized by emotion: Greed Power Words: Bargain, Discount, Exclusive, Frugal, Limited, Reduced, Save, Ultimate; Curiosity Power Words: Astonishing, Be the first, Classified, Limited, Stunning, Top Secret, Unexplained; Sloth Power Words: All-inclusive, Complete, Freebie, Instant, Minutes, Painless, Steal, Template; Lust Power Words: Captivating, Desire, Exotic, Mind-blowing, Obsession, Sinful, Thrilling, Wild; Vanity Power Words: Amazing, Beautiful, Brilliant, Epic, Genius, Hero, Smart, Ultimate; Trust Power Words: Authentic, Best-selling, Certified, Expert, Guaranteed, Official, Reliable, Verify; Anger Power Words: Abuse, Bullshit, Evil, Greedy, Punish, Sneaky, Victim, Worst; Fear Power Words: Assault, Beware, Danger, Embarrass, Horrific, Mistake, Panic, Terror (Fernandez 2020).
Influential writing is important, yet what gets shared? In an effort to better understand what headlines receive the most engagement, BuzzSumo analyzed 100 million articles in 2020 (Linehan, Rayson, and Chiu 2021). Their analysis revealed “trigrams”—popular three-word phrases that had the highest levels of engagement on Facebook. These phrases could be found at the start, middle, or end of a headline. Following are the top 10 Facebook headline trigram phrases:
1. of the year
2. in X years
3. for the first
4. the first time
5. one of the
6. you need to
7. need to know
8. X years in
9. on social media
10. to know about
The most engaged headlines shared information related to ranking (e.g., the person of the year), newness (e.g., for the first time in 20 years), hyperbole, instructional (i.e., crucial information), surprise (e.g., shocking fact), curiosity (e.g., only 20 percent of people got X correct, can you?), guidance (e.g., how to), and story (i.e., case study). Overall, the most frequently used theme on Facebook was instructional. If people believed the information was “need to know,” they were more likely to engage and share it. BuzzSumo also analyzed the beginning of Facebook headlines. This analysis revealed the popularity of “listicles” that centered primarily on providing guidance through “how-tos.” So, while not very sexy, the most common word used for highly engaged headlines was “The” followed by “New,” “A,” “How,” and “This.” BuzzSumo replicated their analysis on Twitter and found similar results across the platforms with some exceptions; curiosity and story-related headlines significantly performed better on Twitter. In conclusion, if you want to write a headline that is likely to be shared on both Facebook and Twitter, your best bet is one of these top 10 phrases (Linehan, Rayson, and Chiu 2021):
1. the story of
2. the top X
3. the X best
4. the X most
5. this is how
6. this is the
7. what are the
8. what is the
9. what you need
10. why you should
Call-to-Action (CTA)
Marketers must also ask for what they want. If you want a retweet, ask for a retweet. If you want a like, ask, share, then ask, follow, ask, reply, ask, download, ask (you get the idea). The adage—ask, and you will receive is alive and well on social media. However, that is not to say that every social post should include a CTA—you do not want to come across as needy or pushy. CTAs should be incentivized by posting good content or creating a contest (Romanek 2013). You also should utilize action-oriented words and if relevant power words. And it doesn’t hurt to add a little urgency (e.g., time is running out, call today!). That said, some CTAs work better than others. Following is a list from highest to lowest of the top seven words or phrases that when included in a tweet garnered more retweets than did similar tweets that did not contain these words (Zarrella 2013a). As you can see, having good manners pays off.
• Please Help
• Please Retweet
• Please RT
• Please
• Retweet
• Spread
• Visit
While the preceding list pertains to Twitter, Facebook posts containing CTA words such as “like,” “comment,” and “share” also result in higher levels of compliance than posts that did not integrate these words (Zarrella 2012). Similar results with CTA words were also found on Instagram and Pinterest (Ripen Ecommerce 2014; Zarrella 2014). Specifically, Instagram captions that included CTA words asking to “like” and “comment” had higher levels of engagement (Zarrella 2014). On Pinterest, “Please Repin” and “Please Like” should also drive action. The lesson here is that when you include a CTA, remember to say please.
Links One of the big benefits of social media for marketers is that social can drive traffic outside of the platform through the use of URL links and linked images. Not only do links offer the potential to drive up advertising revenue and conversion rates, but they also provide increased value to consumers by supplementing the information that can be contained in a short post. This increased value is apparent in that consumers are much more likely to retweet and share information from posts that include a link. To illustrate, one study found that retweeting was 86 percent higher with texts that included links (Patel 2014). Beyond providing links, specific content publishers may be more likely to produce engaging content. In particular, youtube.com, cnn.com, guardian.com, nytimes.com, and the washingtonpost.com had the most engaging 2019 and 2020 Twitter headlines, and youtube.com, rollingstone.com, cnn.com, dailymail.co.uk, and boredpanda.com had the most engaging 2019 and 2020 Facebook headlines (Linehan, Rayson, and Chiu 2021).
Hashtags The history of hashtags began in the late 1990s as a way to group items together on Internet Relay Chat. Designer and now-Uber employee Chris Messina co-opted their use to organize group conversation on Twitter in a tweet on August 23, 2007. Three years later, in 2010, Twitter reinforced their usage by emphasizing hashtags through “trending” topics on their front page (Bennett 2014a)—today they are ubiquitous. Users of Facebook, TikTok, Twitter, Instagram, Pinterest, and more use hashtags to organize subjects and photos as well as express their opinion or support on a topic. Hashtags have even entered everyday face-to-face conversational vernacular.
Not surprisingly, hashtags impact sharing. Industry research has found that using hashtags matters when it comes to retweets. Twitter’s analysis of over two million tweets reported that hashtag use resulted in a 16 percent increase in retweets (Rogers 2014). Dan Zarrella’s research found an even higher retweet rate—tweets that contained a hashtag were 55 percent more likely to be retweeted than tweets that did not use hashtags—#Amazing (Zarrella 2013b). However (and as we will discuss in Chapter 7), too many hashtags can be problematic and may present legal problems if they engulf disclosures. On Twitter, hashtags should be limited to no more than two particularly if you want to leave room for retweeting comments and substance. Two also seems to be the magic number on Facebook. However, Instagram and TikTok lend themselves to incorporating more hashtags in their search or discover features. Ayres 2015 Hashtags can either be location-based (e.g., place, city), branded (i.e., brand name, a specific campaign, or event), industry (i.e., marketing), community (i.e., #recoverytok), and descriptive (i.e., #5k) (Warren 2021).
One of the reasons that hashtags successfully impact sharing is that consumers can quickly find relevant content by searching within a specific social media platform or via Google. Similar to SEO practices, it is essential to create or identify meaningful hashtags that your consumers can relate to and that are relevant to your product. When creating hashtags, make sure they are unique to your brand, easy to remember, and relatively short. Also, make sure that there is no secondary meaning or the chance that consumers could misread and, therefore, misinterpret your intended hashtag meaning (e.g., The 2009 Britain’s Got Talent Susan’s Boyle PR team uses #susanalbumparty to announce the album release party—do you see the problem?). When you participate in an ongoing hashtag conversation, know what you are jumping into. Many marketers have not fully understood the meaning behind the hashtag conversation or were ignorant of the larger cultural context a trending topic was meant to illustrate and have quickly regretted their participation. Take, for instance, the dessert company Entenmann’s who tweeted about not feeling bad or #NotGuilty about eating some of their low-calorie options. Unfortunately, #Not Guilty was currently being used to discuss the Casey Anthony trial verdict (Guido 2016). To assist you in finding the perfect hashtag, review hashtag use of competitors and social media influencers, keep track of trending hashtags on specific platforms and utilize a social media listening tool.
Quotes Quotes do well across social platforms. To illustrate, Twitter’s analysis of over two million tweets found tweets that contained a quote received a retweet rate of 19 percent higher, whereas social media scientist, Dan Zarrella, found that tweeted quotes were more likely to be retweeted by 30 percent (Zarrella 2013b; Rogers 2014). Another analysis of approximately 400,000 tweets found that, and I quote, “users who tweeted quotes had 43% more followers” (QuickSprout 2021). While you have the option of including the quote with attribution in a tweet or on a Facebook post, a better approach is to overlay a quote over-an awe-inspiring photo for maximum effect. The power of visuals in social media cannot be overstated. Visual storytelling is an essential part of social media—as the next section will reveal.
Visual Storytelling: A Picture (or Video) Says a Thousand Words
Social media is increasingly becoming a visual medium. In 2021, it was predicted that 82 percent of all global Internet traffic will be from video (Cisco 2016). Visually oriented social media platforms such as Instagram, TikTok, and Snapchat have seen incredibly high adoption rates of growth. This observation coupled with the popularity of the “Stories” feature (short videos found at the top of platforms’ feeds) makes it safe to assume that the majority of social media networking sites’ data volume also revolves around visuals. The amount of visual data produced and shared on social media each day is truly staggering: 3.2 billion photos and 720,000 hours of video per day (Queensland University of Technology 2020). Smartphone adoption, continued advancements in digital camera technology, and a growing number of image- and video-centric social media platforms have led to a perfect storm of consumers wanting to use more images in their communications. This increasing reliance on visuals is consistent with research that has found that our visual IQ (as measured by Raven’s Progressive Matrices nonverbal exam) is increasing faster than other aspects of our IQ (Kremer 2015). In 2015, the critical reading scores of high school graduates in the United States were the lowest they have been in 40 years. In the same year, writing scores, which they began testing in 2005, were the lowest on record (Kitroeff and Lorin 2015). The fact that our visual IQ is increasing and our reading and writing skills are decreasing highlights the importance of making your social posts rich with visual content.
Power of Images
The ability to get noticed within social media’s ever-changing, information-rich environment is crucial. Consumers are experiencing information overload. E-mails, texts, and articles flood our screens. Photos, videos, and infographics assist consumers in their ability to digest data quickly. This is happening, in part, because by the time we reach 18 years of age, most of us will be visual learners. Simply put, many of us learn more through visual modalities: symbols, diagrams, pictures, and videos (Felder and Silberman 1988). Our brains also seem predisposed to visuals; approximately 30 percent of our cortex is dedicated to visual processing, whereas hearing only makes up 3 percent and touch is 8 percent (Grady 1993).
Research on traditional advertising and WOM has established that images are superior to text in garnering attention (Pieters and Wedel 2004; Singh et al. 2000). One study found that consumers are 90 percent more likely to look at an advertisement’s primary picture before they look at the copy (Werner 1984). This could help explain why engagement is higher with social media posts that include images. There is, however, evidence to suggest that consumers may pay more attention to the text, as opposed to images when promoting luxury brands on social media. This may be attributed to the high level of perceived risk (e.g., monetary, social, and psychological risk) that consumers may associate with purchasing luxury items, resulting in a need for detailed information, which is typically contained in the text. Images were still more attention-grabbing for the nonluxury product (Hoffman and Daugherty 2013).
Images are also powerful because, as research suggests, we remember images (recall and recognition) more than we remember text (Childers and Houston 1984). This phenomenon has been called the picture superiority effect (Stenberg 2006; Paivio, Rogers, and Smythe 1968). This effect may not be unique to static images but also include videos. Research has shown that television commercials, more so than print ads, can influence purchase attitudes and intentions (Grass and Wallace 1974). More specifically, videos that evoke high-arousal emotions are remembered the most (Nelson-Field, Taylor, and Hartnett 2013). This relationship between high-arousal emotions and memory also highlights that one of the biggest benefits of images or videos is their ability to influence consumers’ emotions. Images and video have the ability to quickly influence not only your consumers but also general public opinion. There have been numerous instances of a single photograph being credited for changing public sentiment (Pensiero 2015).
The Popularity of Visuals
The sheer volume of digital images captured and shared per day is astonishing. To illustrate, in every minute of the day (in 2021), TikTok users watch 167 million videos, Instagram users share 65,000 photos, YouTube users stream 694,000 hours, and two million Snapchats are sent (Domo 2021). The quick rise of visual-centric platforms (e.g., TikTok and Instagram), Facebook’s Timeline redesign, which focuses more on images, the visibility of images and video included in tweets, and the integration of the “cover” photo and “Stories” across multiple platforms (i.e., Facebook, Twitter, and LinkedIn) all reinforce that we have entered “the age of visual culture” (Bullas 2012). Indeed, some marketers would argue that social media as a whole is shifting away from text and embracing the visual medium (Gupta 2013). The fact that the highest levels of engagement for millennials, as measured by average monthly minutes, occur on visual platforms (i.e., Facebook, Snapchat, and Instagram), suggests that this is the right strategy. Futurists predict that Generation Z (those born after 1996) will rely even more heavily on images to communicate than millennials (Meeker 2016). Smart brands need to make sure they are investing in visually-centric social media platforms. In particular, they should be on Instagram and TikTok, where brand engagement with consumers is higher than on Pinterest, Facebook, LinkedIn, and Twitter (Elliot 2015). TikTok actually has the highest (Cucu 2022).
Photos and Consumption Practices
Photos that are shared the most often do not typically contain pastoral images of the countryside, but rather they capture consumers’ daily lives; lives that involve branded clothing, food, and activities and are contextualized within cars, stores, and restaurants. The ability to easily and quickly associate and communicate not only your opinion about a product but also your product aspirations, usage and ownership is incredibly powerful. In fact, certain types of visual platforms lend themselves to documenting specific points in the consumer decision-making and consumption process, with Pinterest and Instagram representing opposite ends of the consumption spectrum (Gupta 2013). Pinterest images that populate consumer boards are often taken from the brand’s owned media (e.g., website) (Moore 2012). Pinterest boards become an aspirational, prepurchase wish list and work to drive sales to e-commerce websites. Ninety-three percent of users are using Pinterest in prepurchase planning (Shopify 2016), and the average order that originated from Pinterest is almost $59 (Bennett 2014b). In contrast, Instagram documents products that consumers own. It reflects their postpurchase use and conveys their satisfaction.
Photos that are posted on social media are often sanitized, filtered, and photoshopped versions. Uploaded photos are cherry-picked from a much larger set (Eveleth n.d.). Teens and adults alike are being careful in which digital artifacts they select to convey their desired digital identity. Part of presenting one’s best self online is utilizing filters. Filters are used to correct perceived problems and improve aesthetics, and create unique fun photos. Highlighting specific objects in the photo, changing the color, and applying vintage effects are other motivations for using filters (Bakhshi et al. 2014). Not surprisingly, filters can impact engagement, although the results are somewhat mixed. A study analyzing 7.6 million Flickr photos found that filtered photos increased viewing by 21 percent and were likely to have attracted 45 percent more comments (Bakhshi et al. 2014). In contrast, an Instagram study found that photos with “no filter” applied generated the highest number of likes per follower (Zarrella 2014). While the novelty of some basic filters has worn off for consumers, augmented reality (AR) filters have a lot of potential to increase brand engagement and conversions. Want to see how a new shade of lipstick or sunglasses looks on you? Now you can. AR filters are immersive and offer consumers a fun brand experience.
Videos and Other Digital Assets
Videos are another increasingly important sWOM tool. This is especially true now that Instagram allows video posts to be between 3 seconds and 10 minutes, video platform TikTok’s high engagement, and the “Stories” feature popularity. Increasingly, social media serves to capture consumer or brand micro-moments via video. Consumers seem to appreciate the increased media richness as seen through the soaring popularity of Instagram and TikTok. Videos also seem to capture spontaneous and authentic moments. And these “real” moments are arguably best illustrated through the temporary, 24-hour “Stories” feature. While Snapchat birthed the feature, “Stories” quickly moved to Instagram, Facebook, Facebook Messenger, Twitter Fleets (2021 retired), LinkedIn, Pinterest, and YouTube (West 2021). Why so many Stories? Well, they are popular. In fact, 500 million people were using Instagram Stories in 2019 each day (McLachlan 2022).
While our visual storytelling discussion concentrates its efforts on static images and videos, GIFs, cinemagraphs, slides, and infographics are also increasingly popular image choices. In the social media sea of static images, marketers are embracing animated GIFs (i.e., graphics interchange format) and cinemagraphs (i.e., a photo and video combination where one or more image attributes seem alive through their movement) (Piekut 2015). Luxury brands, in particular, are drawn to cinemagraphs because of their ability to bring photos to life and allow them to articulate both beauty and sophistication in their visual storytelling. Both GIFs and cinemagraphs can be used on websites, e-mail, ads, and embedded within social media posts. Animated GIFs and cinemagraphs boast higher rates of engagement and conversion than static images (King 2016; Johnson 2015; Piekut 2015). However, they are not alone—although waning in popularity, infographics have also demonstrated strong virality (Dugan 2012). Finally, we would be remiss if we did not mention the incredible popularity of Slideshare. Infographics on Slideshare are also liked and shared considerably more than other documents and presentations (Abramovich 2014). Whereas this chapter does not include a detailed discussion on GIFs, cinemagraphs, slides, or infographics, much of the following discussion of visual storytelling is also applicable to these forms of visuals.
Visual Storytelling Is Not an Option
Visual assets’ ability to increase engagement rates and influence purchases has forced companies to acknowledge their worth. A CMO Council and Libris sponsored survey of 177 senior marketing executives found that 65 percent of those surveyed believed that visual assets, in general, are essential in telling the story of their brand (CMO Council and Libris 2015). Forty-six percent of those surveyed believe that photos were “critical” in marketing and storytelling strategies, followed by video (36 percent), infographics (19 percent), and illustrations (15 percent). They also believe that visual asset use and importance will continue to grow (CMO Council and Libris 2015). Marketers consider their brand editorial images to be the most important in crafting their marketing strategy, followed by consumer-generated images, then brand stock images, influencer images, and finally, partner images (Curalate and Internet Marketing Association 2015). In other words, a combination of company, consumer, and collaborative content is important for telling your brand story.
While some social media platforms are dominated by company-generated images (i.e., Pinterest), most rely heavily on consumer-generated images. Consumers are actively creating and posting their visuals and sharing those created by other consumers on social media. Both company- and consumer-generated images work to influence consumer decision making, but consumer-generated content also influences marketers. For example, Pinterest boards were a source of design inspiration for the automotive company Buick (Gupta 2013). Engagement with images can be used to predict in-store and onsite product engagement, and consumer photos are now selected for inclusion in branded websites’ homepages, fan galleries, and even product-landing pages (Curalate n.d.).
A recurring theme in this book is that consumers and marketers must work collaboratively within the social space. Marketers need to not only continue to encourage engagement from consumers but also actively integrate their content. Visual marketing firm Curalate recommends the 80/20 principle in your visual integration strategy: 80 percent of visuals should be generated by a company, whereas 20 percent should be “outsourced” to consumers and influencers, advocates, and so on (consumer and collaborative). How do we find consumer content to incorporate into our marketing?
Visual Analytics and Commerce
To find and then utilize visually oriented consumer-generated content requires new marketing solutions—enter visual intelligence and analytical tools and visual commerce. Historically, social media analytics have relied solely on textual analysis, ignoring the content of the image itself. As a result, approximately 85 percent of a brand’s photos are “lost” because the brand is not mentioned in a post’s text (Laughlin 2016). Companies, such as YouScan, Visua, and Crimson Hexagon, are using logo recognition software to analyze millions of social images to identify brand logos that are contained anywhere within a photo (e.g., on a cup, shoe, billboard) or even in a video or GIF. The logo may not even be the image’s focal point; however, understanding the number of visual mentions within the social realm indicates a brand’s popularity and media impact. It also allows marketers to discover affinities with other brands and general types of product relationships that they may not have known existed. In essence, visual analytics contextualizes and shows how consumers are using your product. Capturing the organic visual sWOM conversations allows the marketer to find and target consumers that have previously gone unnoticed, develop new products based on discovering new or unknown usage behavior, forge new marketing partnerships with affiliate brands, and understand which promotional materials are working. Some of the visual analytical tools also help you to identify and help connect with frequent brand posters or influencers and their social network.
Visual commerce is defined as:
The full-funnel approach used in making all of the images both within and outside of a brand’s control actionable at every point of the customer journey. This is accomplished by directly linking images to the products or services associated with them, resulting in traffic, conversions, and revenue. (Curalate and Internet Marketing Association 2015)
Visual commerce is a growing area. It allows an image to become a point of purchase. In other words, images have become shoppable. Consumers can click on a specific product in an image and be taken to an e-commerce platform to purchase it. One image can provide multiple purchasing opportunities. No longer are brand purchases limited to following a link in the brand’s social media bio. Social media technology has evolved. To illustrate, Instagram allows “product tags” where brands can place clickable tags on their product posts and ads. One hundred and thirty million people click on Instagram shopping tags each month (Instagram 2022)! Instagram also includes a “Shop Tab” on the home screen to allow consumers to find additional products to purchase. Not to be outdone, Pinterest includes Product Pins that either direct users to a retailer’s website or some products can be purchased within the Pinterest platform. TikTok also includes an in-app shopping experience. Creators can include a shopping tab to their profile which is connected to a creator’s Shopify product catalog.
And, while we now have analytical tools that allow us to analyze photos and visual commerce tools that allow us to make purchases through images, we still do not know the answer to the question …
What types of images or videos are consumers more likely to share? If you did not know already, more than likely it is not going to be an image solely of your product (remember: tell, not sell). Do not worry; your product can be part of the image, but there needs to be a positive context and perhaps a friendly face captured in it as well. The type of image or video that is shared is going to depend on the social media platform.
Consumers post a wide variety of images on Instagram. One study identified eight separate categories of Instagram images: friends (i.e., two human faces in the photo), food, gadgets (i.e., electronics, transportation), captioned photos, pets, activity (i.e., concert, landmark), selfies, and fashion (i.e., clothing, shoes, and so on). The most frequent categories of images posted (consisting of almost half of the data set of photos combined) were friends and selfies. The least frequent were pets and fashion (Hu, Manikonda, and Kambhampati 2014). In contrast, images posted on Pinterest without faces received 23 percent more repins than those that included faces (Curalate and Internet Marketing Association 2015). This difference can perhaps be attributed to the varying motives beyond using the social network; Pinterest is more about “things” and Instagram is more about “people.”
Video communication provides a much richer communication platform, and arguably, it is harder to pinpoint, let alone create content that can be contagious. However, a content analysis of videos collected from the UK does yield some suggestions. In a study of 800 user-generated and branded social videos, researchers Nelson-Field, Riebe, and Sharp (2013) looked at the average rate of sharing each day, aggregated by the type of creative devices used in the video. The most popular creative device use (by a considerable amount) was personal triumph, followed by weather, science, or nature and baby or young child (remember the popular “Charlie Bit My Finger” video?).
Image Attributes
From the time we opened up our first Crayola box, color has fascinated us. And, we all have our favorite. Color can capture attention, generate emotions, and symbolize ideas. Its effects are both physiological and psychological. And, importantly for marketing, color impacts consumer decision making. But, does color impact sharing behavior within social media?
Research has readily shown that blue (across cultures) is most often selected as the favorite color, and this preference is also seen online (at least on Instagram). Visual marketing firm Curalate’s study of more than 8 million Instagram images found that when blue is the dominant color in an Instagram image, it attracts 24 percent more likes than an image that is predominately red and orange (Dixit 2013). However, this was not found to be the case on Pinterest, where images that contain red, orange, and brown are repinned approximately twice as often as images containing blue images (Lowry 2013). A separate study also found that red and related shades (e.g., pink and purple) increased repinning behavior, whereas black, yellow, yellow-green, green, and blue deterred it (Bakhshi and Gilbert 2015). Instead of focusing on one color within Pinterest, multiple colors might be a better approach. On Pinterest, repinning was 3.25 times higher when an image contained multiple colors as opposed to one dominant (Lowry 2013).
Levels of brightness and saturation are other considerations when posting images. On Pinterest, “medium” lightness is best for repinning (Lowry 2013), whereas “high lightness” attracts considerably more likes than dark images on Instagram (Dixit 2013). The background of the image can also make a difference in liking and sharing. On Pinterest, images containing relatively little white space (i.e., less than 30 percent) were repinned at higher rates (Lowry 2013). In contrast, Instagram images with a lot of backgrounds were liked more often (Dixit 2013). Even the texture of an image, determined by the number of edges, makes a difference on Pinterest. Smooth texture images (think rounded surfaces) are repinned at considerably higher rates than images that have many rough edges (Lowry 2013). The opposite was found within Instagram, where a lot of texture led to considerably more likes (Dixit 2013). Unfortunately, color selection is not a black and white decision (pun intended), nor will one color be the answer for higher engagement. Social media colors are impacted by the brand’s colors and also the specific product category of the brand. An analysis of over 200,000 Instagram fashion images found significant color-related engagement differences between different types of fashion (i.e., casual wear did well with purple; footwear did well with black). It is, however, not easy to be green. Posts featuring green, across fashion categories, didn’t perform well (Nanji 2018).
Phew! That is a lot of information to digest. So, we helped you out by summarizing this information in Figure 4.3. We added text and images, but unfortunately, we were unable to add color, video, or sound.
So, have you figured out your big brand story? Will it be textually and visually rich? Even when you have written your tale, the next hurdle you face is figuring out how you will use it to drive action. In other words, how will you influence others within social media?
Aaker, D.A. and D. Norris. 1982. “Characteristics of TV Commericals Perceived as Informative.” Journal of Advertising Research 22, no. 2, pp. 61–70.
Abramovich, G. 2014. “15 Mind-Blowing Stats About Slideshare.” CMO. Retrieved from www.cmo.com/features/articles/2014/3/10/mind_blowing_stats_slideshare.html#gs.jAcOvsA.
Advanced Marketing Institute. 2009. “Emotional Marketing Value Headline Analyzer.” Retrieved from www.aminstitute.com/headline/index.htm.
Ashley, C. and T. Tuten. 2015. “Creative Strategies in Social Media Marketing: An Exploratory Study of Branded Social Content and Consumer Engagement.” Psychology and Marketing 32, no. 1, pp. 15–27.
ASKfm. 2022. “A, Bae, C’s: Top Teen Terms Decoded.” ASKfm blog. Retrieved from https://safety.ask.fm/a-bae-cs-top-teen-terms-decoded/.
Bakhshi, S. and E. Gilbert. 2015. “Red, Purple and Pink: The Colors of Diffusion on Pinterest.” PLoS One 10, no. 2, p. e011718. Retrieved from https://journals.plos.org/plosone/article?id=10.1371/journal.pone.0117148.
Bakhshi, S., D. Shamma, L. Kennedy, and E. Gilbert. 2014. “Why We Filter Our Photos and How It Impacts Engagement.” In International AAAI Conference on Human Factors in Computing Systems, pp. 12–22. http://comp.social.gatech.edu/papers/icwsm15.why.bakhshi.pdf.
Bennett, S. 2014a. “The History of Hashtags in Social Media Marketing.” AdWeek. Retrieved from www.adweek.com/socialtimes/history-hashtag-social-marketing/501237.
Bennett, S. 2014b. “U.S. Social Commerce—Statistics & Trends.” AdWeek. Retrieved from www.adweek.com/socialtimes/social-commerce-stats-trends/500895?red=at.
Berger, J. 2013. Contagious. New York, NY: Simon and Schuster.
Berger, J. and K. Milkman. 2011. “What Makes Online Content Viral?” Journal of Marketing Research 49, no. 2, pp. 192–205.
Bly, B. 2013. “A New Copywriting Formula: The 4 Cs.” IBPA. Retried from https://articles.ibpa-online.org/article/a-new-copywriting-formula-the-4-cs/#:~:text=A%20copywriting%20formula%20I%20use,concise%2C%20compelling%2C%20and%20credible.
Bone, P. 1995. “Word-of-Mouth Effects on Short-Term and Long-Term Product Judgments.” Journal of Business Research 32, no. 3, pp. 213–23.
Brown, J. and P. Reingen. 1987. “Social Ties and Word-of-Mouth Referral Behavior.” Journal of Consumer Research 14, no. 3, pp. 350–362.
Bullas, J. 2012. “6 Powerful Reasons Why You Should Include Images in Your Marketing.” Jeffbullas.com. Retrieved from www.jeffbullas.com/2012/05/28/6-powerful-reasons-why-you-should-include-images-in-your-marketing-infographic/.
Childers, T.L. and M.J. Houston. 1984. “Conditions for a Picture-Superiority Effect on Consumer Memory.” Journal of Consumer Research 11, no. 2, pp. 643–53.
Cisco. 2016. “VNI Complete Forecast Highlights.” Cisco. Retrieved from www.cisco.com/c/dam/m/en_us/solutions/service-provider/vni-forecast-highlights/pdf/Global_2021_Forecast_Highlights.pdf.
CMO Council and Libris. 2015. “From Creativity to Content: The Role of Visual Media in Impactful Brand Storytelling.” Retrieved from https://d3kjp0zrek7zit.cloudfront.net/uploads/attachment/file/42928/expirable-direct-uploads_2F09469a4a-87fa-43c8-afe4-a71d013c5bcb_2FCMO-Council_PhotoShelter_Whitepaper_Final.pdf.
Coca-Cola. 2021a. “Coca-Cola Launces ‘Real Magic’ Brand Platform Including Refreshed Visual Identity and Global Campaign.” Retrieved from www.coca-colacompany.com/news/coca-cola-launches-real-magic-brand-platform-including-refreshed-visual-identity-and-global-campaign.
Coca-Cola. 2021b. “Coca-Cola Launces New Christmas Campaign Under ‘Real Magic’ Platform.” Retrieved from www.coca-colacompany.com/news/real-magic-christmas-campaign.
Content Marketing Institute. n.d. “What Is Content Marketing.” Retrieved from http://contentmarketinginstitute.com/what-is-content-marketing/ (accessed July 31, 2016).
Contently. 2016. “The Content Marketing Encyclopedia.” Retrieved from https://contently.com/strategist/2016/06/29/content-marketing-101-art-storytelling-webinar/ (accessed July 31, 2016).
Courie, E. 2021. “Exclusive: Coca-Cola Brings ‘Real Magic’ in First New Campaign Since 2016.” Biz Community. Retrieved from www.bizcommunity.com/Article/196/11/222738.html.
Cucu, E. 2022. “2022 Social Media Industry Benchmarks.” Social Insider Blog. Retrieved from www.socialinsider.io/blog/social-media-industry-benchmarks/.
Curalate. n.d. “The Complete Guide to Visual Commerce: How to Command Attention in a Visual Words.” Retrieved from http://pages.curalate.com/the-complete-visual-commerce-guide.html.
Curalate and Internet Marketing Association. 2015. “The State of Visual Commerce.” Retrieved from http://pages.curalate.com/rs/496-DAU-231/images/The_State_of_Visual_Commerce.pdf.
Daugherty, T. and E. Hoffman. 2014. “eWOM and the Importance of Capturing Consumer Attention Within Social Media.” Journal of Marketing Communications 20, no. 1–2, pp. 82–102. doi:10.1080/13527266.2013.797764.
Dixit, P. 2013. “Want Your Instagram Photos to Get Attention? Use the Color Blue.” Fast Company. Retrieved from www.fastcompany.com/3021407/want-your-instagram-photos-to-get-attention-use-the-color-blue.
Domo. 2021. “Data Never Sleeps 9.0.” Domo Resources. Retrieved from www.domo.com/learn/infographic/data-never-sleeps-9.
Dugan, L. 2012. “Infographics Shared on Twitter Get 832% More Retweets Than Images and Articles.” Adweek. Retrieved from www.adweek.com/socialtimes/infographics-on-twitter/468324.
ElBoghdady, D. April 20, 2012. “‘Pink Slime’ Outrage Goes Viral in Stunning Display of Social Media’s Power.” The Washington Post. Retrieved from https://www.washingtonpost.com/business/pink-slime-outrage-goes-viral-in-stunning-display-of-social-medias-power/2012/04/20/gIQAIf5XVT_story.html
Elliot, N. 2015. “How Does Your Brand Stack Up on Facebook, Twitter and Instagram?” Forrester: Nate Elliott’s Blog. Retrieved from www.forrester.com/blogs/15-09-15-how_does_your_brand_stack_up_on_facebook_twitter_and_instagram/.
Elliot, S. November 11, 2012. “Coke Revamps Website to Tell Its Story.” The New York Times. Retrieved from www.nytimes.com/2012/11/12/business/media/coke-revamps-web-site-to-tell-its-story.html?_r=0.
Eveleth, R. n.d. “How Many Photographs of You Are Out There in the World?” The Atlantic. Retrieved from www.theatlantic.com/technology/archive/2015/11/how-many-photographs-of-you-are-out-there-in-the-world/413389/.
Felder, R.M. and L.K. Silberman. 1988. “Learning and Teaching Styles.” Engineering Education 78, no. 7, pp. 67–81.
Fernandez, M. 2020. “700+ Power Words That Will Boost Your Conversions.” Optinmonster Blog. Retrieved from https://optinmonster.com/700-power-words-that-will-boost-your-conversions/.
Gessler, K. 2020. “Twitter Length Study: Do Longer Tweets Drive More Engagement and Referral Traffic.” Kurt Gessler Blog. Retrieved from https://kurtgessler.medium.com/twitter-length-study-do-longer-tweets-drive-more-engagement-and-referral-traffic-3dd0781363ff.
Grady, D. 1993. “The Vision Thing: Mainly in the Brain.” Discover. Retrieved from http://discovermagazine.com/1993/jun/thevisionthingma227.
Grass, R.C. and U.H. Wallace. 1974. “Advertising Communication: Print vs. TV.” Journal of Advertising Research 14, no. 5, pp. 19–23.
Guido, M. 2016. “10 Brutal Trend and Campaign Hashtag Fails + Lessons to Learn From Them.” Keyhole. Retrieved from http://keyhole.co/blog/10-trend-campaign-hashtag-fails-by-big-brands-lessons/.
Gunelius, S. 2013. “5 Secrets to Use Storytelling for Brand Marketing Success.” Forbes. Retrieved from www.forbes.com/sites/work-in-progress/2013/02/05/5-secrets-to-using-storytelling-for-brand-marketing-success/#1e344bfa3dd9.
Gupta, A. 2013. “The Shift From Words to Pictures and Implications for Digital Marketers.” Forbes. Retrieved from www.forbes.com/sites/onmarketing/2013/07/02/the-shift-from-words-to-pictures-and-implications-for-digital-marketers/#586b936c2549.
Hoffman, E. and T. Daugherty. 2013. “Is a Picture Always Worth a Thousand Words? Attention to Structural Elements of Ewom for Consumer Brands Within Social Media.” In Advances in Consumer Research, eds. S. Botti and A. Labroo. Association for Consumer Research. www.acrwebsite.org/volumes/v41/acr_v41_14817.pdf.
Hu, Y., L. Manikonda, and S. Kambhampati. 2014. “What We Instagram: A First Analysis of Instagram Photo Content and User Types.” In Proceedings of the 8th International AAAI Conference on Weblogs and Social Media. Association for Advancement of Artificial Intelligence. Retrieved from www.aaai.org/ocs/index.php/ICWSM/ICWSM14/paper/view/8118/8087.
Hutchinson, A. 2019. “New Report Looks at Optimal Facebook Posting Practices in 2019.” Social Media Today. Retrieved from www.socialmediatoday.com/news/new-report-looks-at-optimal-facebook-posting-practices-in-2019/545233/.
Instagram. 2022. “Shopping.” Retrieved from https://about.instagram.com/features/shopping.
Johnson, L. 2015. “Here’s Why GIFs Are Back in Style and Bigger Than Ever for Brands: Creators Race for Marketers’ ‘Loopy’ Business.” Adweek. Retrieved from www.adweek.com/news/technology/heres-why-gifs-are-back-style-and-bigger-ever-brands-165499.
Kagan, N. 2017. “How to Create Viral Content: 10 Insights From 100 Million Articles.” OkDork. Retrieved from https://okdork.com/why-content-goes-viral-what-analyzing-100-millions-articles-taught-us/.
King, C. 2016. “5 Ways to Use Cinemagraphs in Digital Marketing Campaigns.” Flixel Blog. Retrieved from http://blog.flixel.com/5-ways-to-use-cinemagraphs-in-digital-marketing-campaigns/.
Kitroeff, N. and J. Lorin. 2015. “Students Bombed the SAT This Year, in Four Charts.” Bloomberg. Retrieved from www.bloomberg.com/news/articles/2015-09-03/students-bombed-the-sat-this-year-in-four-charts.
Kozinets, R.V., K. De Valck, A.C. Wojnicki, and S.J.S. Wilner. 2010. “Networked Narratives: Understanding Word-of-Mouth Marketing in Online Communities.” Journal of Marketing 74, no. 2, pp. 71–89.
Kremer, W. 2015. “Are Humans Getting Cleverer?” BBC News. www.bbc.com/news/magazine-31556802.
Laskey, H., E. Day, and M. Crask. 1989. “Typology of Main Message Strategies for Television Commercials.” Journal of Advertising 18, no. 1, pp. 36–41.
Laughlin, S. 2016. “Q& A: David Rose, CEO, Ditto Labs.” J. Walter Thompson Intelligence. Retrieved from www.jwtintelligence.com/2016/03/david-rose-ceo-ditto-labs/.
Lewsey, F. n.d. “Slamming Political Rivals May Be the Most Effective Way to Go Viral—Revealing Social Media’s ‘Perverse Incentives.’” University of Cambridge Stories. Retrieved from www.cam.ac.uk/stories/viralpolitics.
Libert, K. 2014. “Here’s What 2.7 Billion Social Shares Say About Content Marketing.” Marketingland. Retrieved from http://marketingland.com/heres-2-7-billion-social-shares-say-state-online-publishing-99572.
Lieb, R., J. Groopman, and C. Li. 2014. “The Content Marketing Software Landscape: Marketer Needs and Vendor Solutions.” Retrieved from https://rebeccalieb.com/sites/default/files/downloads/1406%20Content%20Marketing%20Software%20Landscape%20RL.pdf.
Linehan, L., S. Rayson, and H. Chiu. 2021. “100m Articles Analyzed: What You Need to Know to Write the Best Headlines.” BuzzSumo Blog. Retrieved from https://buzzsumo.com/blog/most-shared-headlines-study/#section-66.
Lowry, B. 2013. “Beautify Your Content: 8 Image Features That Shine on Pinterest.” Curalate Blog. Retrieved from www.curalate.com/blog/8-image-features-that-shine-on-pinterest/.
McLachlan, S. 2022. “35 Instagram Stats That Matter to Marketers in 2022.” Hootsuite Blog. Retrieved from https://blog.hootsuite.com/instagram-statistics/.
Meeker, M. 2016. “Internet Trends 2016—Code Conference.” Retrieved from www.kleinerperkins.com/perspectives/2016-internet-trends-report/.
Moon, G. 2014. “Make Your Content More Sharable With These Simple Tricks, Backed by Research.” Buffer. Retrieved from https://blog.bufferapp.com/shareable-content-social-media-research.
Moore, R. 2012. “Pinterest Data Analysis: An Inside Look.” The Datapoint. Retrieved from https://blog.rjmetrics.com/2012/02/15/pinterest-data-analysis-an-inside-look/.
Murphy, S. 2012. “How to Get More Likes, Shares on Facebook.” Mashable. Retrieved from http://mashable.com/2012/06/19/how-to-get-more-likes-shares-on-facebook-infographic/#SrvzU.0Boiqt.
Nanji, A. 2018. “How Color Impacts Fashion Brands’ Instagram Engagement.” Marketing Profs. Retrieved from www.marketingprofs.com/charts/2018/33544/how-color-impacts-fashion-brands-instagram-engagement.
Nelson-Field, K., E. Riebe, and B. Sharp. 2013. “Emotions and Sharing.” In Viral Marketing: The Science of Sharing, eds. K. Nelson-Field and B. Sharp, pp. 13–32. South Melbourne, Australia: Oxford University Press.
Nelson-Field, K., J. Taylor, and N. Hartnett. 2013. “The Pay Off.” In Viral Marketing: The Science of Sharing, eds. K. Nelson-Field and B. Sharp, pp. 69–78. South Melbourne, Australia: Oxford University Press.
O’Brien, J. 2012. “How Red Bull Takes Content Marketing to the Extreme.” Mashable. Retrieved from http://mashable.com/2012/12/19/red-bull-content-marketing/#oBPQRljrL5qN.
Paivio, A., T.B. Rogers, and P. Smythe. 1968. “Why Are Pictures Easier to Recall Than Words?” Psychonomic Science 11, no. 4, pp. 137–38.
Park, C. and T.M. Lee. 2009. “Information Direction, Website Reputation and the eWOM Effect: A Moderating Role of Product Type.” Journal of Business Research 62, no. 1, pp. 61–67.
Patel, N. 2014. “What Type of Content Gets Shared the Most on Twitter.” Quicksprout Blog. Retrieved from www.quicksprout.com/2014/03/05/what-type-of-content-gets-shared-the-most-on-twitter/.
Pensiero, K. September 11, 2015. “Alylan Kurdi and the Photos That Change History.” The Washington Street Journal. Retrieved from www.wsj.com/articles/aylan-kurdi-and-the-photos-that-change-history-1442002594.
Pfeffer, J., T. Zorbach, and K.M. Carley. 2014. “Understanding Online Firestorms: Negative Word-of-Mouth Dynamics in Social Media Networks.”Journal of Marketing Communications 20, no. 1–2, pp. 117–128. doi:10.1080/13527266.2013.797778.
Piekut, K. 2015. “How Cinemagraphs Are Helping Brands Break Away From Static Content.” Econslutancy Blog. Retrieved from https://econsultancy.com/blog/66568-how-cinemagraphs-are-helping-brands-break-away-from-static-content/.
Pieters, R. and M. Wedel. 2004. “Attention Capture and Transfer in Adverting: Brand, Pictorial, and Text-Size Effects.” Journal of Marketing 68, no. 2, pp. 36–50.
Queensland University of Technology. 2020. “Seeing no longer Believing: The Manipulation of Online Images.” Science Daily. Retrieved from www.sciencedaily.com/releases/2020/10/201021112337.htm.
Quicksprout. 2021. “How to Increase Twitter Engagement by 324%.” Quicksprout Blog. Retrieved from www.quicksprout.com/twitter-engagement/.
Quintly. 2019. “Instagram Study 2019.” Quintly. Retrieved from https://info.quintly.com/instagram-study-2019/view#length.
Richins, M.L. 1983. “Negative Word-of-Mouth by Dissatisfied Consumers: A Pilot Study.” Journal of Marketing 47, no. 1, pp. 68–78.
Ripen Ecommerce. 2014. “Adding Pinterest to Your Ecommerce Strategy.” Retrieved from www.ripenecommerce.com/blog/pinterest-for-ecommerce.
Rogers, S. 2014. “What Fuels a Tweet’s Engagement.” Twitter Blog. https://blog.twitter.com/2014/what-fuels-a-tweets-engagement.
Romanek, J. 2013. “Tweet Tips: Most Effective Calls to Action on Twitter.” Twitter Blog. Retrieved from https://blog.twitter.com/2013/tweet-tips-most-effective-calls-to-action-on-twitter.
Shaer, M. 2014. “What Emotion Goes Viral the Fastest.” Smithsonian. Retrieved from www.smithsonianmag.com/science-nature/what-emotion-goes-viral-fastest-180950182/?no-ist.
Shopify. 2016. “How Pinterest Drives Online Commerce.” Retrieved from www.shopify.com/infographics/pinterest (accessed August 15, 2016).
Singh, S.N., P.V. Lessig, D. Kim, R. Gupta, and M.A. Hocutt. 2000. “Does Your Ad Have Too Many Pictures?” Journal of Advertising Research 40, no. 1, pp. 11–27.
Snow, S. 2015. “State of Content Marketing 2016: The Tipping Point.” Contently. Retrieved from https://contently.com/strategist/2015/12/17/state-of-content-marketing-2016/.
Stenberg, G. 2006. “Conceptual and Perceptual Factors in the Picture Superiority Effect.” European Journal of Cognitive Psychology 18, no. 6, pp. 813–47.
Stich, L., G. Golla, and A. Nanopoulos. 2014. “Modelling the Spread of Negative Word-of-Mouth in Online Social Networks.” Journal of Decision Systems 23, no. 2. pp. 230–21. doi:10.1080/12460125.2014.886494.
Tierney, J. February 08, 2010. “Will You Be E-Mailing This Column? It’s Awesome.” The New York Times. Retrieved from www.nytimes.com/2010/02/09/science/09tier.html.
Toms. 2022. “Toms Impact Report 2021.” Retrieved from www.toms.com/us/impact/report.html.
Warren, J. 2021. “Instagram Hashtags: Everything You Need to Know in 2022.” Later Blog. Retrieved from https://later.com/blog/ultimate-guide-to-using-instagram-hashtags/.
Werner, K.R. 1984. “Effects of Emotional Pictorial Elements in Ads Analyzed by Means of Eye Movement Monitoring.” In Advances in Consumer Research, ed. T. Kinnear, pp. 591–596. Association for Consumer Research. www.acrwebsite.org/volumes/6313/volumes/v11/NA-11.
West, C. 2021. “Social Media Stories: Your Guide to All Social Media Story Platforms.” Sprout Blog. Retrieved from https://sproutsocial.com/insights/social-media-stories/.
Zarrella, D. 2009. “The Science of Retweets.” Retrieved from www.slideshare.net/danzarrella/the-science-of-re-tweets/24-ReTweets_are_Social_and_Concrete.
Zarrella, D. 2012. “New Facebook Data Proves Social CTAs Lead to More Comments, Likes & Shares.” HubSpot. Retrieved from http://blog.hubspot.com/blog/tabid/6307/bid/33860/New-Facebook-Data-Proves-Social-CTAs-Lead-to-More-Comments-Likes-Shares-INFOGRAPHIC.aspx#sm.00018n9uis1172fifrc4xqq28xm0f.
Zarrella, D. 2013a. “New Data Shows the 7 Most Powerful Calls-to-Actions for More Retweets.” Dan Zarrella. Retrieved from http://danzarrella.com/new-data-shows-the-7-most-powerful-calls-to-action-for-more-retweets/ (accessed February 08, 2017).
Zarrella, D. 2013b. “Use ‘Quotes’ and #Hashtags to Get More Retweets.” Dan Zarrella. Retrieved from http://danzarrella.com/new-data-use-quotes-and-hashtags-to-get-more-retweets/ (accessed February 08, 2017).
Zarrella, D. 2014. “The Science of Instagram.” Dan Zarrella. Retrieved from http://danzarrella.com/infographic-the-science-of-instagram/ (accessed February 08, 2017).
Zote, Z. 2020. “130 Most Important Social Media Acronyms and Slang You Should Know.” Sprout Social Blog. Retrieved from https://sproutsocial.com/insights/social-media-acronyms/.