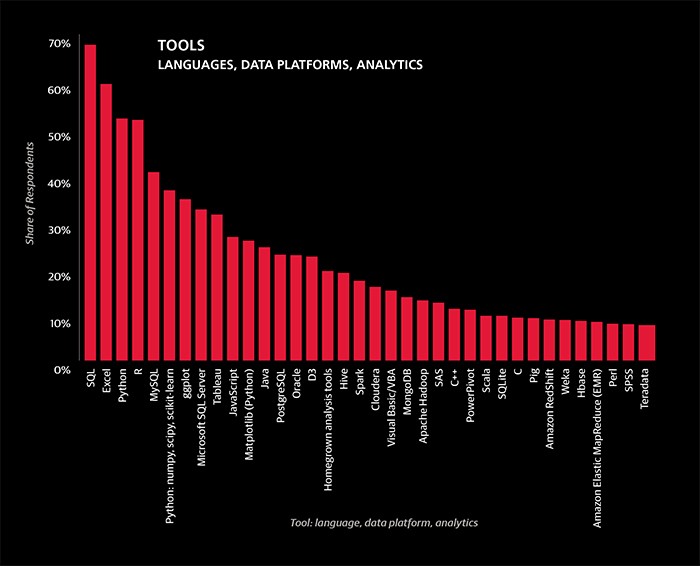
Tools versus Tools
Let’s Take a Break from the Money
The first category of tools that’s worth mentioning is operating systems. Windows is still the most widely used (72%), and Linux (50%) is slightly more popular than Mac OS X (43%). Compared to last year, Mac OS X and Windows have both gained 6-7%. Almost everyone uses either Mac OS X or Windows (94%, up from 87% of last year’s sample), and there is a significant overlap between each of these operating systems: all three are used by 12% of the sample (compared to 9% last year), and only 46% use just one of the three.
Specific Tool Usage Rates
Beyond operating systems, we will refrain from imposing our own system of classification.[6] Tool usage rates on the whole changed little from last year’s salary survey results:
• 68% of the sample use SQL
• 59% use Excel
• 51% use Python
All of the above rates are within 1% of last year’s values.
• R, however, fell from 57% to 52%, although this is only marginally significant (p = .13).
• The new, powerful, and suddenly popular Spark, as well as Scala, the language in which Spark is written, saw large increases to 17% and 10%, respectively.
• Tableau’s share also grew from 25% to 31%.
Aside from R, other tools that are not used as widely by this year’s survey respondents as last year’s include:
• Perl (12% to 8%)
• Matlab (12% to 6%)
• C# (12% to 6%)
• Mahout (10% to 3%)
• Apache Hadoop (19% to 13%)
• Java (32% to 23%)
All of these differences are statistically significant at the 0.10 level.
Tool Clusters
One possible route in analyzing tool usage is to organize them in clusters; this is a route we have taken in the past two salary survey reports as well. Using an affinity propagation algorithm using (a transformation of) the Pearson correlation coefficient between two tools’ usage values as a similarity metric, we construct nine clusters consisting of two to eight tools out of those used by at least 5% of the sample. Plotting the nine clusters based on their average similarity by the same metric (after scaling down to two dimensions), we have a picture of which tools tend to be used with which others.[7]
Analysis of the Clusters
The clusters based on this year’s data share the basic divide found in the clusters of the previous two reports: open source versus proprietary, new Hadoop versus more established relational, scripting versus point-and-click. The former tools are found in the lower right of the “map,” the latter in the upper left. However, a few important differences have emerged, beyond the idiosyncrasies generated by the algorithm.[8]
In the 2014 data, for example, Tableau was a unique tool occupying the otherwise empty middle ground between the two mega-clusters representing open source and proprietary tools. The current picture is more mixed, and more bridges appear to be stretching across the divide.
OPERATING SYSTEMS (Respondents could choose more than one OS)

TOOL CLUSTERS
WHICH TOOLS TEND TO BE USED WITH WHICH OTHERS
After determining the nine clusters, we plot them using multidimensional scaling with average correlation as the distance metric. So, for example, the Python/Spark and MySQL/PostgreSQL are close together because correlations of tool pairs between the clusters – Scala and MySQL, Python and MySQL, Java and SQLite, etc. – are relatively high. Of course, correlations of tool pairs between the clusters are generally not as high as correlations within a cluster.
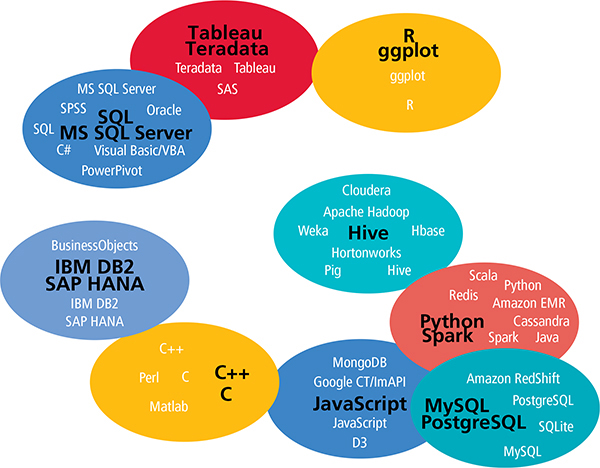


R usage is changing
R is a prime example of a tool that is bridging the divide between open source and proprietary tools. The correlation coefficient between R and a majority of tools from clusters 1, 7, and 9 increased—the correlation between R and Teradata becoming particularly strong—as well as the coefficient between R and Windows (operating systems were not included in the clustering), from –0.059 to 0.043. In contrast, the coefficient between R and almost all (22 of 26) tools in the other clusters decreased. Most notable were the drop in correlation with Python (0.298 to 0.188), MongoDB (0.081 to -0.042), Spark (0.090 to 0.004), and Cloudera (0.087 to -0.063).
There are several reasons why R usage might be changing. The acquisition of Revolution Analytics by Microsoft reflects a particular interest in R by one of the traditional leaders in the data space, as well as a general rise in attention paid by large software vendors to open source products. Alternatively, the open-source-only crowd might be finding they don’t need such a large selection of tools, that Spark and Python do the job just fine. The large number of R packages has often been cited as a key advantage of R over tools such as Python, but this is not the kind of advantage that is guaranteed to last: there is no reason why developers of other open source tools can’t gradually build on their own libraries to catch up. In contrast, it makes sense that users of tools such as Teradata, which now supports R, would find it enormously useful to have access to such a variety of open source libraries within the proprietary tool they are already using. If users of other open source tools are dropping R, it would be ironic that the hottest new open source big data tool, Spark, recently released a version that supports R.
Other open source tools
Aside from R, the main “open source” tools are found in clusters 2, 4, 5, and 6. Tools between these four clusters are all relatively well-correlated, though it is interesting that they are distributed with clear themes: cluster 4 contains top open source relational databases, cluster 5 consists of major open source Hadoop distributions and associated tools, cluster 6 is concerned with the web and web-based visualization in particular, and cluster 2 is defined by Spark and Python.
Spark and Scala
On the topic of cluster 2 we should mention Scala: like Spark, or rather with Spark, it has grown tremendously in the data space in the last year. The correlation coefficient between the two tools is 0.548 (up from 0.360 last year), but perhaps the most telling statistic is that while among Spark users 46% use Scala, among those who do not use Spark only 2% of the sample used Scala. It appears that in the data space, despite its suitability for a variety of applications, the Scala language has become inextricable with Spark. In comparison, while Java remains in the open source cluster with Python and Spark, its usage declined from 2014 according to the survey data.
Hadoop-themed cluster
Cluster 5, the Hadoop-themed cluster, contains tools that in last year’s sample correlated very negatively with the collection of proprietary tools. This year, however, it has drifted closer toward them, somewhat similarly to R, but without the same drop in correlation with open source tools in other clusters. Pairs of tools such as Cloud-era/Visual Basic, Apache Hadoop/C#, Pig/SPSS, and Excel/Horton-works correlated negatively in the 2014 sample but now correlate positively.[9] Large software companies that produce proprietary data products have made efforts to incorporate new and popular open source technology into their own products, and as with R, Hadoop seems to be making its way into the non-open source mainstream. Perhaps this a general pattern illustrated well by the cluster map: new open source tools pop up in the lower right corner and drift up and to the left, making room for the next new tools and letting the cycle repeat. There are, of course, exceptions: MySQL and PostgreSQL (of cluster 4) have not drifted anywhere close to the proprietary clusters, and remain firmly planted in the open source bottom right.
Tools with the most overall usage
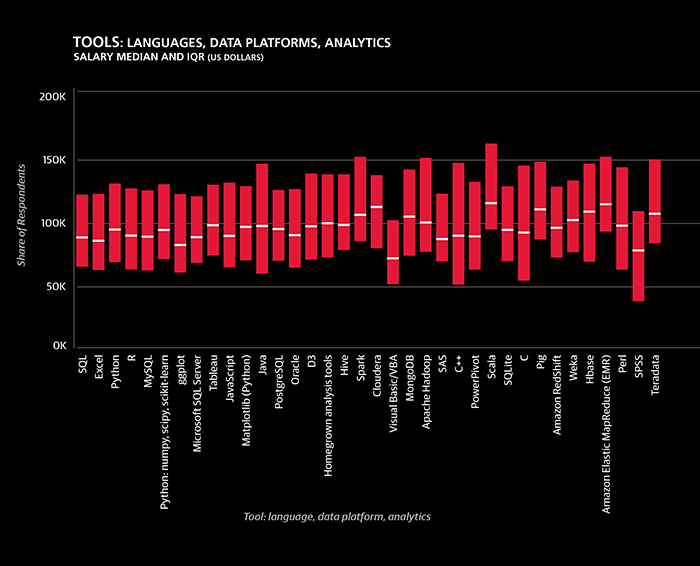
The cluster of tools that has the most usage overall was cluster 1, consisting of SQL, five Microsoft products, and two other proprietary tools, Oracle and SPSS. Respondents who use these tools tend to work in larger, older companies and are less likely to come from a software company than those who do not use them. Continuing the pattern from the previous year’s report, cluster 1 tools correspond with lower salaries on average. Seven of the twelve tools whose users had median salaries of $95,000 or less were from this cluster.