Integrating Job Titles into Our Final Model
THE OMISSION OF JOB TITLES as features in the models we’ve so far presented is deliberate: we want to see how much can be predicated only from demographics and information about what someone does, not what they are called. This also allows us to compare the model without titles to a fourth and final model with titles, to see if job titles give us information not extractible from the other data we have about each individual. Before we show this model, it is worth describing the job title categories we are using in the context of the other variables we have been working with: demographics, tasks, and tools. As with the second and third models, we will restrict this section to the non-managerial and non-academic groups.
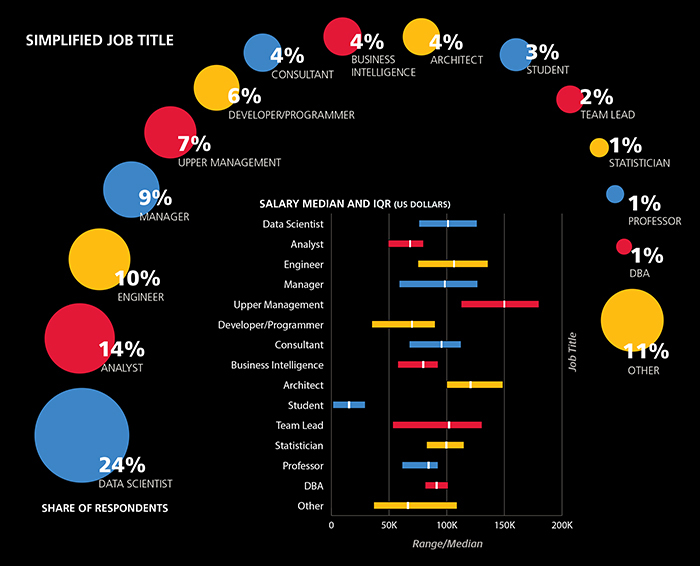
Classifying Job Titles
Respondents entered their job titles into a text field (as opposed to picking a choice from a drop-down menu), and we have classified the entries using a few simple rules to remove the overlapping respondents who would otherwise qualify for more than one group.[10]
Little can be said with any certainty about some of the smaller groups such as DBA and statistician: the former tends to use Perl and work for older companies, the latter tends to use R and not use any cloud computing, but none of these observations are backed up by much statistical significance. However, these titles do not appear to be very common in the space, and we would expect that many who could call themselves statisticians could have reasonably called themselves something else (for example, “analyst” or “data scientist”).
Architects
Architects are more likely to use D3 (54% of architects use D3 versus 24% of non-architects), Java (52% vs. 23%), Horton-works and Cassandra (both 30% vs. 6%). They spend more time than the rest of the sample on ETL and attending meetings. Only two architects were women (7%)—even lower than the share of women in the rest of the sample (21%).
Developers/Programmers
The developers (or programmers) in the sample should not be considered an unbiased representation of all developers: they did, after all, complete a long data science survey. Still, this group is clearly different from the rest of the respondents, using less R (22% vs. 52%) but more JavaScript (56% vs. 26%) and D3 (44% vs. 24%). This indicates that the intersection of the data space and the wider world of programming is most active in the sub-space of visualization.
Engineers
Like developers, engineers use less R than the rest of the sample (30% vs. 53% of non-engineers). They use less Excel (34% vs. 64%) and SAS (3% vs. 13%) as well, but more Scala (24% vs. 9%) and Spark (29% vs. 18%). In terms of tasks, engineers are less likely to spend time presenting analysis (44% present analysis less than one hour a week, versus 25% for non-engineers).
Business Intelligence roles
The set of “Business Intelligence”/“Business Analyst” respondents was similar to non-BI analysts, and these two are closer to each other than either to data scientists. Few respondents from either the BI or analyst groups use Spark (BI: 4%, analysts: 3%, data scientists: 28%) and Apache Hadoop (7%, 7%, 19%), while most use Excel (85%, 82%, 54%). They are also less likely to work for startups (more specifically, companies five years or younger: 17%, 15%, 32%). For most other variables that set the BI and analysts apart from data scientists, a clear gradient exists with analysts in the middle.
Tools favored by BI that fit this pattern include Visual Basic/VBA (41%, 27%, 9%), PowerPivot (37%, 15%, 6%), Microsoft SQL Server (71%, 44%, 24%), and SQL (93%, 82%, 72%); while tools favored by data scientists include Python (28%, 39%, 72%) and R (41%, 50%, 72%).
Aside from tool usage, there are other variables that follow this gradient: holding a PhD (4%, 10%, 44%), spending at least one hour per day on creating visualizations (57%, 44%, 31%), spending at least one hour per day on machine learning (12%, 24%, 54%) and performing most or all tasks on cloud computing (4%, 13%, 29%). One variable that does not follow this gradient is age: BI are the oldest (53% older than 35), then data scientists (32%), and analysts are the youngest (only 22% over 35).
In addition to the above job title classification, we can extract features conveying the level of an individual: “Senior,” “Lead,” “Staff,” “Chief,” and “Principal” are terms that frequently precede titles such as “Data Scientist,” “Analyst,” “Engineer,” and “Developer”.[11]
Our Final Model
Adding job title and level features to the third salary model, we produce our final model. Six of the new features are kept in this model, and R2 rises slightly to 0.433.
30572 intercept
+1395 age (per year of age above 18)
+5911 bargaining skills (times 1 for "poor" skills
to 5 for "excellent" skills)
+382 work_week (times # hours in week)
-2007 gender=Female
+1759 industry=Software (incl. security, cloud services)
-891 industry=Retail / E-Commerce
-6336 industry=Education
+718 company size: 2500+
-448 company size: <500
+8606 PhD
+851 master's degree (but no PhD)
+13200 California
+10097 Northeast US
-3695 UK/Ireland
-18353 Europe (except UK/I)
-23140 Latin America
-30139 Asia
+7819 Meetings: 1 - 3 hours / day
+9036 Meetings: 4+ hours / day
+2679 Basic exploratory data analysis: 1 - 4 hours / week
-4615 Basic exploratory data analysis: 4+ hours / day
+352 Data cleaning::1 - 4 hrs / week
+2287 cloud computing amount: Most or all cloud computing
-2710 cloud computing amount: Not using cloud computing
+9747 Spark
+6758 D3
+4878 Amazon Elastic MapReduce (EMR)
+3371 Scala
+2309 C++
+1173 Teradata
+625 Hive
-1931 Visual Basic/VBA
+31280 level: Principal
+15642 title: Architect
+3340 title: Data Scientist
+2819 title: Engineer
-3272 title: Developer
-4566 title: Analyst
“Principal” is the only job level to be kept in the model, with a large coefficient attached to it (+$31,280). Respondents with other job levels specified in their title do have higher median salaries than those with no title, but job levels correlate well with other features, such as age, and so they do not add anything to the model that isn’t there already.
Coefficients
Job titles, on the other hand, do add something more. Architects, data scientists, and engineers have positive coefficients, while developers and (non-BI) analysts have negative coefficients. Having seen the correlations between tools and titles it should be no surprise that there is a reduction in magnitude of certain tools’ coefficients. For example, there is a clear shift from the coefficients of Spark and D3 to those of Architect, Data Scientist, Engineer: to a majority of respondents, their expected salary based on the model would be the same (e.g., to an analyst who doesn’t use Spark or a data scientist who does). One interesting newcomer that enters the model once title features are allowed is Teradata, finally breaking the open source monopoly on positive coefficients.
The inclusion of job titles by the parsimonious lasso algorithm could mean that there aren’t enough features to properly differentiate the functions of different jobs. That is, we are missing too many details about the skills, tasks, and challenges that define a data professional’s job. Alternatively, it could mean that simply calling yourself something different can have a real impact on salary. The improvement from the third to fourth model is probably too small to seriously make the latter claim, but we can’t rule it out.
JOB LEVEL (Sample of Respondents)
