Customer retention is an important aspect of any service business. The present literature has a plethora of information about the ways to measure customer satisfaction. Customers are the raison d’être for any for-profit firm. At a majority of the service firms, customers rank above any other shareholders. However, customer management has more often been an art. Customer metrics are often not correlated with the corporate performance metrics and are not that well defined. Managers most often rely on financial metrics.
Customer satisfaction, retention, customer equity, and lifetime value are some of the commonly used metrics. All of these metrics could also be classified as observable (or behavioral) and unobservable (perceptual) measures. Unobservable constructs, such as service quality, perception of the service, and intention to buy a service, are more important for a service firm. Customer loyalty and retention are observable constructs and usually are measured in terms of customer equity or lifetime value of a customer. Successful management of these behaviors should result in financial gains for a service firm.
Customer satisfaction and service quality are the most common unobservable measures used by service firms. Customer satisfaction is the customers’ perception or judgment about whether the service has exceeded, met, or fallen short of the expectations. Satisfaction is usually an overall perception rather than evaluation of individual processes or transactions. Survey methodology is the most common method to measure customer satisfaction. Marketing research textbooks have detailed descriptions of the survey methodology.
In certain cases, however, customers may not articulate their preferences or may not know their needs. In these cases, firms, especially in service sectors, use methodology based on the principles of anthropology and ethnography. These techniques take knowledge from fields such as clinical psychology, cognitive neuroscience, and sociology. One such patented technique called ZMET (the Zaltman Metaphor Elicitation Technique) combines such principles and identifies perceived personal relevant mental models. The technique involves conducting in-depth interviews with customers and mapping the mental model. The exercise of mapping the mental models is similar to a mind-mapping exercise.
Customers do not think in terms of processes but perceive the whole service as an experience. Customers also think in terms of satisfying the need and do not think in terms of products or services. The most common approach to measuring the quality of a service is ServQual, a methodology developed in the 1980s. The ServQual model identifies gaps in service along different service quality dimensions. The driver is the difference between customer perception and customer expectations of the service delivered.
A service firm not only needs to provide a service to its customers, but it also must provide a solution to customer needs leading to a memorable experience. The paradigm of processes to service to solution to experience is an important one to understand for a service firm, because customers do not think in terms of discrete steps or process activities. Customers need solutions and experiences. An example of managing an experience includes a theme park right at the center of the Mall of America in Minneapolis, Minnesota. Another example is providing video games, news, Internet services, and movies during a long flight on an airplane.
A customer-centric view is a key success factor in the competitive marketplace. The customers are at the center of understanding the needs of the market. Firms that fail to understand their customers’ needs are doomed for failure. A customer-centric view requires that a firm map customer needs and demands an ongoing dialogue with the customers. Customer needs could be implicit or explicit. Implicit needs are in terms of features of the service, and explicit needs could be considered benefits or the value to customers.
Customer needs result in expectations. The expectations of customers also consider previous experience with similar services and any word-of-mouth or communication by the service provider. At the “moment of truth” or at the time of delivery of the service, customers compare expectations with the perception of the service delivered.
A solution perspective takes the view that customers have needs and need solutions to satisfy those needs. As described by Mohanbir Sawhney in The Service-Dominant Logic of Marketing—Dialogue, Debate, and Directions, a product-centric view can no longer sustain long-term competitive advantage. Solution needs are specific to a particular segment of customers. Some of the metrics that are relevant in a solution-centric view are the share of customer spending and segment profitability/revenue.
One tool that helps identify the need of customers is customer activity mapping. Activity mapping describes how customers select, buy, and consume services. Customer experience mapping or activity blueprinting describes the whole experience in discrete steps. Each step clearly identifies the value added and should be analyzed for the purpose of providing differentiated solutions.
As we acknowledge customers as cocreators of value in a service context, we need to consider the importance of this particular element. Because customers participate, create, and consume services, firms need to continuously identify the latent need of customers. Service firms also engage customers during the process of service innovation. As firms become customer-need focused, the firm is more likely to retain customers leading to sustainable profit.
The purpose of the customer metrics is to focus on firm profitability and growth. A firm incurs customer-related costs to acquire and retain a particular customer. These costs include acquisition cost, operating cost, and customer retention costs. On the revenue side, a firm gets base revenue, future revenue, and some price premium from early adopters. A higher loyalty and retention will lead to reduced acquisition costs and perhaps higher revenue if a firm is able to cross-sell other services to its existing customers. The net effect is higher profit.
A differentiation should be between loyalty and retention. The customer loyalty is “earned” and proves customers are truly satisfied and have received a high quality of service. Retention shows that customers have repurchased from the same firm but does not give any indication about the true satisfaction of customers. Loyalty could be “bought” by providing some incentives such as coupons, promotions, or some special deals for existing customers. This section describes typical customer retention metrics.
Customer satisfaction is the most common measure used at a firm level and at the national level. At a macro level, we have seen the development of a satisfaction index, such as the American Customer Satisfaction Index (ACSI) and the Swedish Customer Satisfaction Index (SCSI). The SCSI, established in 1989, was the first national customer satisfaction index. ACSI was introduced in 1994. It is supposed to represent the economy as a whole and provides firm-level and sector-level satisfaction indicators. Scores of individual service firms relative to the sector average indicate the strength or weakness of a particular firm’s strategy. For example, the Southwest consistently beats the industry average score.
Frederick Reichheld proposed a metric called the “Net Promoters Index” and suggested that this is the only index a firm needs to grow. The hypothesis behind using one number is that “the only path to profitable growth may lie in a company’s ability to get loyal customers to become, in effect, its marketing department.” The basic idea is that a firm should grow the size of promoters and reduce the size of detractors. The index is defined as the percentage of respondents answering a 9 or 10 on a 0–10 willingness-to-recommend scale minus the percentage of respondents answering 0–6. A typical net promoters score is between 10 percent and 20 percent for most firms. The index is simple, is easy to measure, and has gained some traction among practitioners. Firms that have used this index are General Electric, The Wall Street Journal, Intuit, and Symantec.
Existing customers should be acting as the marketing department, promoting the image of the company, and in turn bringing in more business. Many companies, especially service firms such as an airline, car-rental company, and Internet service provider, grow based on word-of-mouth recommendations. A firm needs only to know answers to basic questions, and the customer survey should reflect this simplicity of intent. Firms have started using the Net Promoters Score as one important score to tie compensation and other rewards throughout the organization. The usual practice of making the number transparent throughout the organization and working on improving the number should be followed. However, because we know that one particular number cannot predict the performance of a firm, the theoretical basis for this index has been questioned and has yet to be proven.
Customers are considered assets just like any other tangible/intangible assets. Considering that customers are financial assets, firms should measure, analyze, and improve the customer equity component. Customer Equity and Lifetime Value are similar concepts. Lifetime Value (LTV) is defined as “net present value of future streams of contributions to firm profit expected from the customers.” Without considering the time value of money, the lifetime value is simply equal to total customer revenue times percent margin times total number of loyal years. Some of the decisions made during the calculation include pricing policies, extent of service provided, and add-on services provided.
Focusing on a metric such as Customer Lifetime Value is important for a firm, because this metric provides long-term focus and directly relates to the firm profit. One implicit assumption of the model is that it is indeed possible to accurately predict future profitability of the customers. With time, in reality, customers might be misclassified. Therefore, a service firm needs to manage the Lifetime Value model dynamically and continuously update the numbers. While calculating the Lifetime Value of a customer, one needs to identify the time horizon or customer life cycle, the forecasting method, the source of customer data, and supported managerial decisions. LTV should include direct contributions by the customers as well as indirect contributions, such as recommending the services to others and providing ideas for new services.
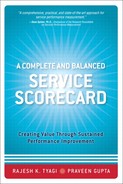
Customer equity can be broken into the following three categories: Acquisition Equity, Retention Equity, and Add-On Selling Equity. The equity calculation method is shown in Figure 10.1. Calculation methods are still evolving, and no general agreement exists about the time horizon to use in projecting sales and other data, the time periods to measure, and the customer cohorts of subsegments to use. As shown in these equations, the rates, expenditure and margins of acquisition, retention, and add-on selling are included in the calculations. Margins and expenditures are per customer.
Total customer equity per customer is the sum of acquisition, retention, and add-on selling equities. One basic assumption of customer equity calculations is that no discount factor is considered. Another basic assumption is that retention rate, expenditure, and margins are constant throughout the life cycle. Some of these assumptions can be relaxed, and calculations may be modified accordingly.
As proposed by Blattberg, Getz, and Thomas in book titled Customer Equity, customer equity could also be considered as a flow, and the Customer Equity Flow statement could be prepared to help managers make better decisions. The Customer Equity Flow statement considers the dynamic nature of retention rates and changes in the buying patterns of customers. Changes to numbers could be made from period to period to reflect the numbers close to reality.
Satisfaction leading to loyalty logic is much more applicable in the service context, where customers are often coproducers, and delivery takes place at the choice of the customer. Loyalty could likely have a negative impact on a firm’s financial performance for a product-centric firm. For a service firm, however, the impact is positive. Service firms need to “earn” the loyalty of customers. Product firms often bring down prices to retain customers. This logic was tested using three-year data, and services do tend to show a stronger affinity toward the satisfaction-loyalty-profit argument. Customer referrals and intangible recommendations should make a greater difference for service firms. Product quality is tangible and can easily be communicated to customers. Typical metrics will include growth in business with existing customers, number of new customers with referrals from existing customers, customer satisfaction, customer equity, or net promoter index.
Wachovia Corporation ranks high in the ACSI ranking of customer satisfaction. The team is now calculating household customer equity for each of its households. Wachovia has more than 13 million customers. Wachovia wants to optimize customer contact. A ten-member team is using advanced statistical analysis and multilevel modeling techniques to analyze available data. The information is used to make managerial decisions to achieve superior performance.
Sprint is the third-largest wireless service provider in the U.S. On June 25, 2007, Sprint fired about 1,000 of its customers by sending mass cancellation letters. The call volume from these customers represented around 40 to 50 times the average call volume from customers. This mass cancellation provides an example of customer equity and customer management calculations and taking a drastic measure to “cull its customer base.” The decision was likely based on customer equity. Perhaps, customer equity for these customers was negative. The long-term consequences of such a decision are still not clear.
British Airways, one of the largest global airlines, is considered to be among those with the best customer service. The airline provides an easy way to complain using various available channels. For example, an e-mail could be used to categorize the type of issue under in-flight, baggage, airport, or corporate policy issues. Often, firms fail to respond to complaints, and customers either keep quiet and move away or tell others about the bad service, causing loss of customer goodwill.
A service firm could grow by acquiring new customers, entering into new markets using existing services, creating and delivering new services, and selling more services to existing customers. However, the most important and sustainable way to grow a service business is by creating and delivering new services. In this section, growth by service innovation is examined. Innovation could be in the form of new services or a new solution to existing customer needs.
Creating a new solution is as important as creating new services. Customers require an end-to-end solution to satisfy their needs. Customers do not need a product or a service per se. Understanding customer needs is a challenge for service firms due to its intangibility and other characteristics of services. The solution paradigm has been adopted by many firms recently. Some firms recently adopting a solution-based paradigm are IBM, Ericsson, General Electric, and Cargill.
Differences between the solution-centric paradigm and the product-centric paradigm are highlighted in Table 10.1. Solution (service) innovation is based on creating solutions for a particular segment of customers. The front-facing organization is based on the needs of the customer, and the back-end organization could be based on the capability of the organization. In a ground-breaking article titled “Evolving to a New Dominant Logic for Marketing,” published in the Journal of Marketing (2004), S.L. Vargo and R.F. Lusch described Service Dominant Logic. Service Dominant Logic considers customer needs and provides a solution.
Table 10.1. Innovation in the Solution and Service Environment
Development Step | New Product Development | New Service/Solution Development |
|---|---|---|
Opportunity Identification | Feature-based Find customers for products | Experience and activity focus Customer solutions Reduce complexity |
Design and Development | Concurrent engineering Design for assembly Design for manufacturability | Collaborative design Design for flexibility Design for reliability Design for repeatability |
Testing and Improving | Product prototyping and testing In-house testing | Prototype using experiences Testing with customers and partners |
Implementation | Pricing Distribution channels SKU | Coproduction incentives Learn as implementation happens |
Key Performance Indices (KPIs) | Product revenue Profit Market share | Customer experience Repeatability |
Innovation in a service environment is a bit different compared to managing innovation at a product-centric firm. Differences between innovations in these two contexts are still debated. Service firms typically do not have a department called Research and Development and hardly ever apply for a patent for the intellectual property. Innovation is driven by employee engagement, customer engagement, business practices, and the human-resource-management practices of a firm.
As discussed in the previous chapters, the following four views dominate the service innovation literature:
Assimilation approach—. The process of innovation is similar in both manufacturing and service settings. Concepts and tools derived from the manufacturing setting are applicable to the service context. Innovation in transaction-based services could be explained using this approach.
Demarcation approach—. Service innovation is inherently different from innovation in the manufacturing setting because of intangibility and customer participation in the production process. The approach broadly defines service innovation as an improvement in the delivery system and the customization of services to satisfy the needs of different customer segments. Innovation in experience-based services could be explained using this approach.
Traditional view—. Innovation in services is not an interesting topic and services are relatively unprogressive. This view considers service firms to be dependent on suppliers or service-chain partners, as suppliers control innovation inputs. According to this view, a service firm does not have an important role to play.
Synthesis approach—. This approach combines the demarcation approach while applying existing tools and concepts to the service setting. This approach makes the most sense.
The appropriateness of the innovation approach will also depend on the subsector of the service firm and the nature of the offerings. The three main service sectors discussed in the literature are the supplier-dominated, production-intensive, and specialized service sectors.
Special characteristics of new service development, NSD, are discussed in the literature and are important to note. NSD innovation may not be recognized, new services can be imitated by and from competitors, termination of NSD projects tends to be easy, NSD is considered a trial-and-error process, there are no natural occasions for review, and a problem with communication may arise; thus, frontline coworkers should be involved. With these characteristics in place, it is easy to say that service firms do not innovate by use of “formal methods” like those used in the manufacturing sector. NSD tends to be an ad hoc process. Thus, NSD is easy to imitate by the competition, and improvements will most always be on a trial-and-error basis.
Authors J.P.J. de Jong, A. Bruins, W. Dolfsma, and J. Meijaard have explored service firm innovation in the business sector. The academic environment and existing literature have yet to fully integrate service innovation into their domains. The field itself is relatively new, and hardly any courses are offered that focus exclusively on service innovation. To understand service innovation, understanding the nature of services is crucial. The classical differences between products and services are discussed widely in the literature: Services are intangible, services are produced and consumed simultaneously, services are heterogeneous, and services cannot be stored.
The intangibility and simultaneous production and consumption aspects of services create an added challenge in terms of defining the value of innovation and the impact on customer behavior. Because customers experience the service and do not look at it as a collection of processes, a firm needs to study the experience aspect upfront. An example is provided by a large bank that introduced an innovative, fast, and efficient ATM. The ATM was superior to previous models and provided a faster service. However, the ATM was totally silent. The bank wanted to study the impact on customer experience and was puzzled when examining customer reaction. Customers faced an ATM that was totally silent and were, in a way, afraid that the machine was idle and not doing anything. In the end, the bank had to add an artificial sound effect to make the machine look as though something was happening to provide a comfort factor to its customers. Demand-driven innovation and consumer participation is much more critical for innovation in services.
Service innovation could also be described using the value chain concept. Value is added by the delivery interface, technological options, delivery system, and delivery concept. Hence, four dimensions of innovation in services could be described: the service concept, client interface, service delivery system, and technological options. Service innovation can happen along any of those four dimensions. The innovation is more often nontechnological in nature. The service concept adapts to an existing market environment, including competitive reactions and offerings.
Client interface (or client service delivery channels) is defined as being service offerings that are marketed and produced in a client-specific way. Various delivery channels are provided for customer convenience, and an appropriate pricing scheme is devised for the same purpose. The service delivery system is the third part of service innovation and is the “internal organizational arrangements that have to be managed to allow service workers to perform their job properly.” Service delivery includes service capacity at various points in the system, delivery channels management, information management, and various aspects of service inventory. Service inventory or access policies were discussed in Chapter 2, “Performance Challenges in the Service Sector.”
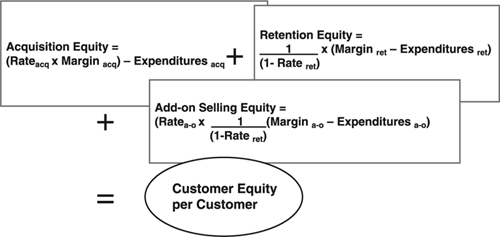
The final dimension of service innovations is the technological option. The technological options dimension refers to the development and implementation of new forms of technology and related reconfigurations so that service concepts and processes can interface with customers. New technology options could include new software, improvements in existing concepts and technologies, or anything that has to deal with the improvement of technology overall. A conceptual model of service innovation is shown in Figure 10.2. Services are inherently unique.
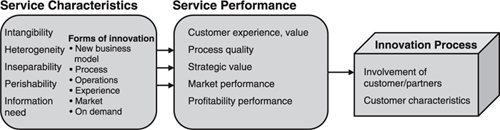
Strategy service innovation, or business model service innovation, touches customers directly and includes providing the total solution by including additional services, thus creating new markets and new customer segments. This type of service innovation includes the way a service markets to its customers and how it delivers the services. An example is provided in Figure 10.3.
Figure 10.3 shows new distribution methods used by Dell and Amazon.com using this direct model. The method bypasses retailers and wholesalers. Firms such as eBay and Priceline.com build new markets by providing unique ways to satisfy customer needs. Similarly, Wal-Mart enter into Wal-Mart.com and Hughes Electronics providing DirecTV are other dimensions of strategic service innovation. Southwest Airlines is yet another dimension of this unique business model, which includes utilizing the following services:
A point-to-point direct service
No seat assignments
One type of aircraft
Direct-to-customer online and live (phone) booking systems.
On-demand innovation is provided by firms to customize the service provided and makes use of the service inventory approach described previously.
Innovation will affect bottom-line or top-line growth depending on the degree of impact on the organization and its customers. The impact could be radical, substantial, and/or incremental. Examples of incremental impact are a hotel providing an automated check-in/out using an ATM-like machine, a retailer providing automated approval for checks and age checks, and an airline providing more legroom for passengers in economy class. Incremental innovation can easily be copied by other service firms. However, incremental innovation should be considered an essential part of the continuous improvement process.
Substantial and breakthrough innovations provide a first-mover with competitive advantage by providing unique services and/or solutions to its customers. A successful service firm should have a comprehensive and enterprisewide innovation program. The innovation process should involve all stakeholders and should be measured using leading indicators.
A service firm needs a well-defined innovation strategy that everybody understands and that has been institutionalized firmwide. A best practice firm should also hire, train, develop, and retain an effective workforce that has the flexibility and necessary empowerment to bring innovative ideas to the market.
As discussed in Ideas Are Free, by Allan Robinson and Dean Schroeder, a firm named Wainwright found that idea-generating employees helped the culture of the company as well as the company’s performance. Service innovation aspects and human resource aspects are intricately related to the corporate performance. High-performing firms have a deeply rooted innovation culture as well as happy employees. The management of Wainwright found that when they trusted employees more, the employees formulated better ideas and generated them more often. By 1994, using these total quality management techniques led Wainwright Industries to win the Malcolm Baldrige National Quality Award. Since then, the company has continued to experience success. In 2002, Wainwright averaged 65 implemented ideas per employee. Because the employees were able to act on their ideas, many of these new visions by employees were implemented by the company.
The book also describes how in the late 1980s, Japanese companies were getting many more ideas through their employees than companies in the United States were getting from their employees. Japanese companies did not have to pay out heavily in rewards for those ideas, either. U.S. companies were paying out 200 times what Japanese companies were, and U.S. companies were getting less than three-hundredths of the number of ideas. In 1989, Japan was averaging 37.4 ideas per employee, while the U.S. was averaging only 0.12 ideas per employee. Japan also had a participation rate of 77.6 percent, while the U.S. had a participation rate of 9 percent. The average reward for idea generation in Japan was $2.83; in the U.S. the reward was $602.
Throughout the 1990s the U.S. companies used benchmarking to attain greater results in idea generation. They learned and utilized Japan’s reward system; because of this they were getting more ideas and paying less for them. The explanation for why the employee steps forward (while not getting rewarded) is pretty straightforward. Employees naturally want to make their job easier, so when employees see a problem in front of them, they want to fix it.
The only way for this system to work is if the management welcomes proposals from the employees about problems they find. If the management is willing to listen, being heard is enough reward for the employee. The truth is most people step forward with ideas because they want to do so. Even if the ideas are small ones, their importance is not undermined. Small ideas are often just as valuable as “home run” ideas. Employees want to see their ideas being utilized, and they also appreciate a little public display of praise.
Managers need to create a supportive environment for employees to share their ideas. Managers can use coaching or mentors when trying to get employees active in generating ideas. Most important, managers need to help develop employee ideas and let the employees know that their ideas are valued by the company. The management needs to get employees excited to participate in generating ideas. Wal-Mart does this by using “pep rallies” before their morning shifts to pep up their employees and get them excited to serve the customers. That same environment needs to be created when employers are trying to get employees to participate.
The book Ideas are Free describes the metrics that are used to measure idea performance. This system measures the quantity of ideas, where they come from, and the speed at which they are processed. The quantities of ideas are measured by time using weeks, months, or years. The book makes references to seasonal effects on the number of ideas generated. For example, during a new product or service launch, idea generation by employees may experience a spike. Problems could easily arise because the new product or service is in its early stages; the kinks in any system always need to be worked out. Few systems are impervious to errors when they are first implemented. Because of this tendency, employees generate a greater number of ideas during these periods.
If idea generation is low, there may be a morale problem or something deterring employees from speaking up. This will decrease the number of ideas generated. Source metrics measure where ideas are coming from. This metric is usually measured by quarters; it is measured by the percentage of people in a given unit. For example, if you have 300 employees, and your company is generating a lot of ideas, where do those ideas come from? Are they coming from 10 employees or all 300? If only 10 people are generating all those ideas, what are their supervisors doing to get them to generate so many? What are other supervisors doing wrong? The source metric can answer these questions.
Knowing how to promote employee ideas will become a core competency for managers and will be the difference between effective and ineffective managers. Ideas are free, and they have the power to liberate employees and transform a company. Without the support of the service firm’s leadership, it is very difficult for new services development to take hold and have a corporate culture that supports it.
Considering growth through service innovation as a process, we could consider metrics at three different levels: input metrics such as number of ideas per employees as discussed in the employee innovation section in Chapter 9, “Innovation and Execution”; process velocity metrics tracking the employee responsiveness to ideas; and output metrics such as revenue/profit growth from new services. For example, when an employee has an idea, how long does it take to get heard, and how long does it take to get the idea implemented? A company that is very responsive will likely have more employees who want to participate. We consider percent of revenue from new services to be a relevant metric. By using this metric in combination with other metrics, companies and managers can stay informed about how their employees are doing in generating ideas. Typical metrics could include one or some combination of the following: revenue (profit) from existing customers with existing products, revenue (profit) from existing customers with new products, revenue (profit) from new customers with existing products, revenue (profit) from new customers with new products, or number of new customers added.
Growth drives profitability and the growth of a firm. Innovative services allow a firm to charge a price premium. Generally speaking, service innovation could take place at three levels: the process level, the service offering level, and the strategic level. New services innovation provides new solutions, new services, or offerings to customers, thus driving the top-line growth and, hence, the profit. New processes usually drive the cost or productivity side of the equation by making a firm more effective, hence driving the bottom-line productivity. Process innovation is about execution excellence, usually involves back offices, and is usually not visible to customers. Front-office process innovation should improve customers’ perception of the service. Examples of front-office process innovation could be FedEx providing an online tracking facility for a package or a bank providing online wire-transfer capability to its customers.
Therefore, one of the prerequisites for new service development is the service firm’s culture and leadership. The main parts of an NSD firm’s culture are the management support, an open culture, internal communications, trust in employees, and the autonomy of the coworkers. Culture also involves hiring the right type of employees. Innovative service firms generally look for the following characteristics when hiring an employee:
Resourcefulness and problem-solving abilities—. Whether the person can experiment and find a solution to the problem and not be worried about making mistakes; and whether the person can discover the necessary information and gather necessary resources and make things happen, or whether the person waits for things to happen.
Possessing an open mind and varied interests—. Whether the person has a spongelike attitude toward absorbing new information and thrives in an environment where steep learning takes place; and whether the person is an explorer and a “world traveler” who reads on a variety of topics.
Strength of character—. Whether the person has a strong work ethic, and whether the person is disciplined and self-motivated.
Creativity—. Whether the person is creative.
Appropriate metrics should also be used to manage service innovation. We propose two types of metrics to manage such a process. First, a metric about revenue share from new services should be considered. Second, a metric showing the velocity and amount of flow of innovative ideas throughout the system, such as launch rate, commercial success rate, and time to market, should be used.
One prime example of various forms of service innovation is the insurance firm Progressive, which implemented a fast-claim process that allows its clients to settle claims on the spot. Other insurance firms take weeks or days just to have the whole incident reported. Progressive also provides quotes from its competition on its Web site. Various pilot studies are taking place using new ideas.
American Airlines uses a suggestion management system called “IdeaAAs” that allows employees to provide ideas and be appropriately rewarded. In a typical year, the company receives about 17,000 ideas. Eight thousand of those ideas could be considered seriously, and about one-quarter of those might be implemented.
Various customer retention measures are in use by service firms. Examples are net promoters scores, customer equity/lifetime value, and customer satisfaction.
Growth of a service firm is driven by customer retention and business innovation.
Growth from new services is an important indicator of the growth potential.